EP0569506B1 - Method of determining the stroke volume and the cardiac output of the human heart - Google Patents
Method of determining the stroke volume and the cardiac output of the human heart Download PDFInfo
- Publication number
- EP0569506B1 EP0569506B1 EP92905499A EP92905499A EP0569506B1 EP 0569506 B1 EP0569506 B1 EP 0569506B1 EP 92905499 A EP92905499 A EP 92905499A EP 92905499 A EP92905499 A EP 92905499A EP 0569506 B1 EP0569506 B1 EP 0569506B1
- Authority
- EP
- European Patent Office
- Prior art keywords
- pressure
- aorta
- flow
- accordance
- compliance
- Prior art date
- Legal status (The legal status is an assumption and is not a legal conclusion. Google has not performed a legal analysis and makes no representation as to the accuracy of the status listed.)
- Expired - Lifetime
Links
Images

Classifications
-
- A—HUMAN NECESSITIES
- A61—MEDICAL OR VETERINARY SCIENCE; HYGIENE
- A61B—DIAGNOSIS; SURGERY; IDENTIFICATION
- A61B5/00—Measuring for diagnostic purposes; Identification of persons
- A61B5/02—Detecting, measuring or recording pulse, heart rate, blood pressure or blood flow; Combined pulse/heart-rate/blood pressure determination; Evaluating a cardiovascular condition not otherwise provided for, e.g. using combinations of techniques provided for in this group with electrocardiography or electroauscultation; Heart catheters for measuring blood pressure
- A61B5/026—Measuring blood flow
- A61B5/029—Measuring or recording blood output from the heart, e.g. minute volume
Definitions
- the invention relates to a method of determining the stroke volume and the cardiac output of the human heart from the pulse-type blood-stream pressure signal derived from the aorta and consisting in each case of a systolic and diastolic period. It is known in practice to calculate the stroke volume and the cardiac output with the aid of a thermodilution determination by injecting cold liquid into the blood stream and measuring it downstream at regular intervals.
- a pulse contour method or prescription is used to determine the stroke volume V s and the cardiac output or heart minute volume Q from a pressure signal p(t) measured in the human aorta.
- the stroke volume is the volume of blood ejected by the heart in one contraction or stroke.
- a typical value is, for example, 70 cm3, but this quantity can vary from stroke to stroke.
- the cardiac output is the volume of blood which the heart pumps in a unit time of one minute. In this connection, a typical value is 5 l/min, and this volume can typically vary between 2 and 30 l/min.
- Windkessel a container partially filled with liquid and with gas - which can absorb the surges in flow and buffer them in the gas bubble and which is incorporated downstream of a pulsatile pump is meant.
- the volume of blood ejected by the heart pump is largely received in the aorta or windkessel and partially flows away through the peripheral vascular regions of the various organs which branch off from the aorta. In the period in which the heart pump does not eject a volume of blood, i.e.
- the outward flow from the windkessel continues to be fed to the peripheral vascular regions.
- the aorta does not then contain any gas but the aorta wall is elastic and this elastic vascular wall fulfils the same function as the windkessel.
- the aorta is much longer than wide.
- the pressure wave generated by the heart requires a time of 0.1 to 0.3 sec. to reach the end of the aorta and then approximately the same time to return to the heart, whereas the entire expulsion period of the heart (the systolic period or systole, T s ) lasts only 0.2 to 0.4 sec.
- T s the entire expulsion period of the heart
- the so-called transmission line model (figure 1a).
- the aorta is conceived as a homogeneous elastic tube of "adequate" length filled with liquid (blood), with drainage to the peripheral vascular zones concentrated at the end.
- liquid blood
- Such a tube has two characteristic properties. A pressure wave generated by the heart at the start of the tube travels at finite velocity v p to the end of the tube, is partially reflected there and travels back to the start of the tube.
- the "adequate length" is that length of tube which, given the propagation velocity of the wave, ensures that the reflected pressure wave does not return too soon.
- the second characterising property is the characteristic impedance Z o .
- This impedance reflects the ratio between the amplitude of the pressure wave and that of the accompanying flow wave in the aorta and is also affected by the cross sectional area A and the compliance C'.
- the heart With a short systolic period, the heart only experiences the (low) impedance at the start of the aorta while contracting, but with a longer-lasting systole it also experiences the (higher) peripheral impedance. This will mean that the instantaneously expelled quantity of blood will become increasingly smaller as the systole advances since it is gradually curbed by the increasing reflected impedance.
- a third approximation is the following. After the blood has been forced into the aorta due to an increase in the pressure, the pressure in the subsequent diastolic period will, of course, not be zero immediately, but the aorta will slowly empty through the peripheral resistance. As a consequence of this, the subsequent stroke will be forced out against a somewhat increased pressure and the two pressures will in fact be superimposed on each other. The diastolic pressure will always increase further with every stroke until equilibrium has been reached between systolic inward flow and diastolic outward flow. This is comparable to a windkessel function.
- the object of the invention is to eliminate the abovementioned problems and to provide a method for the said determination of the stroke volume and cardiac output which takes account both of the windkessel properties and the transmission-line properties. This is achieved in the method as defined in the claims.
- the nonlinear aorta properties are important and are involved in this method, while it is advantageous for the verification of the correctness of the steps of the method if the flow curve can be continuously calculated and displayed during a systole.
- the integral of the flow curve then yields the stroke volume.
- the invention assumes the transmission-line model, in particular, the transmission-line property that pressure wave and flow wave are related by a fixed factor, the characteristic impedance Z o , at least before reflections return to the heart from the periphery.
- This model lacks the gradual curbing of the outward flow from the heart by early reflections and the diastolic windkessel action.
- these two shortcomings are eliminated by means of adding one component, an aorta windkessel compliance C w , to the transmission-line model (see figure 2a).
- the flow is determined in the first instance by Z o and is then gradually curbed during the ejection phase by the pressure increase of p w (t) which is built up in the windkessel receiver by the inflow q(t).
- the improved model according to the invention contains linear timeinvariant components.
- two versions are now possible.
- the pressure curve recorded in the method is first linearised and then applied to a linear pulse contour model.
- the pressure measured in the method is regarded as given, but the pulse contour model is provided with pressuredependent components.
- the start of the expulsion phase in the pressure curve and the associated final diastolic pressure p d are determined.
- the nonlinear aorta pressure/volume relationship or, assuming a fixed aorta length, pressure/cross section relationship is linearised by means of the tangent to the curve and the equivalent linear pressure is calculated for every pressure sample taken on the pressure curve.
- the equivalent linear pressure becomes equal to approximately 92 mmHg.
- A(p) A m [0.5 + (1/ ⁇ .)tan ⁇ 1 ⁇ (p-p o )/p1 ⁇ ]
- A(p) is the cross section as a function of the pressure p
- a m is the limit cross section at very high pressure
- p o and p1 are, respectively, the pressure at the point of inflection of the relationship and the slope of the relationship at the point of inflection.
- the compliance C' per unit of length as a function of the pressure follows from this as a result of differentiation with respect to p as: where
- the values of the parameters A m , p o and p1 are known from the work of Langewouters et al. In particular, these parameters depend on the sex and age of the person.
- the value for A m has, in addition, a dispersion of approximately 20%. It is not therefore possible to determine the values of the components in the pulse contour model in an absolute sense without more exact calibration unless a standard deviation of approximately 20% is regarded as acceptable.
- Z o and v p can readily be calculated with the aid of A and C' found in this way.
- To calculate the total windkessel compliance of the aorta still one more parameter is required, namely the effective length of the aorta.
- a good value for for adults is 60 cm.
- the pulse contour model of figure 2b includes a component representing the total peripheral resistance R p of all the vascular drainage beds in parallel. The value of the latter is initially unknown.
- the average aorta pressure p m is also known as the integral of the pressure over a time period divided by the time period:
- the stroke volume V s can be found from the flow curve by integrating the flow during the systole, the heartbeat rate f as the quotient of 60 and the time period of every stroke, the cardiac output Q as the product of stroke volume V s and heartbeat rate f , and the peripheral resistance R p as the low-pass-filtered quotient of the average pressure p m and the cardiac output Q as indicated in formulae 3, 4 and 5.
- a measured pressure curve and the flow curve calculated from it are shown in figure 4 for a 62 year old male patient.
- the beginning of the rising edge of the pressure curve in figure 4a is determined using a pattern recognition algorithm.
- the diastolic pressure p d on the curve is recorded, and with the latter, the correct values for the characteristic impedance and the windkessel compliance are found using a function generator and introduced into the model.
- the pressure is linearised using the arctangent pressure/ cross section relationship and is applied to the model.
- the correct values for the parameters which determine the arctangent pressure/cross section relationship follow from regression equations according to Langewouters et al.
- these calculations can advantageously be carried out by a digital processor.
- the flow curve therefore becomes available at these time instants.
- a preferred sample interval is 10 ms.
- a shorter interval of 5 ms is possible if a fast computer is used but only gives a marginal improvement in the precision.
- the integration of the flow curve in order to calculate the stroke volume is replaced by a summation of the flow samples in the systolic period.
- the new method has been evaluated in six patients who were undergoing an open-heart operation.
- the reference value for the cardiac output was measured at some time instants during the operation by repeating a thermodilution (TD) determination at least four times after injections of cold liquid distributed with precise regularity over the respiratory cycle.
- TD thermodilution
- a single thermodilution determination would be too inaccurate.
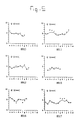
- the particular feature is that the four determinations were injected so as to be spread regularly over the respiratory cycle, as a result of which an averaging of the four values usually means an improvement in the precision of the estimate of the actual cardiac output by a factor of four. This improvement is only achieved with mechanical insufflation and not, therefore, if the patient breathes spontaneously. Spontaneous breathing always takes place during the first determination, i.e. at "s", as marked in figure 5, and during all the subsequent determinations, the patient is anaesthetised and he is artificially insufflated.
- the cardiac output calculated by the novel pulse contour method was recorded at the same time for comparison. The results are shown separately for each of the patients in figure 5. The number of simultaneous determinations, the mean error, the error standard deviation (SD) and the error span are shown for each patient number 8910 to 8912 and 8915 to 8917 in table 1 and averaged for the group. Note that the sixth patient has a larger error for three determinations. These were carried out after a period of total heart-long bypass while, although the heart was already beating and pumping blood, the pump of the heart-lung machine was still assisting at approximately one litre per minute. This flow was in fact measured by the thermodilution method but not by the pulse contour method, resulting in this discrepancy.
- the cardiac output was also calculated by the earlier method according to Wesseling et al. from US 3,841,313, which method was known as the most accurate in the literature.
- the mean error standard deviation was in this case 12%, against 8% for the novel method.
- the novel method therefore has a variance of less than half that of the old.
- the inventor has found that the transmission properties have a relatively small spread around a mean value. In that case it is possible to correct the resonance properties by an anti-resonance in a filter, as a result of which it is indeed possible to accurately determine the pulse contour stroke volume of the left-hand half of the heart.
- a simple second-order filter can be used for this purpose.
- a digital, IIR (infinite impulse response) second- or third-order filter is used which corrects the mean resonance precisely up to a frequency of 8 Hz.
- a series of output signal samples y n is calculated using the formula: where c and d are constant filter coefficients.
- c and d are constant filter coefficients.
Abstract
Description
- The invention relates to a method of determining the stroke volume and the cardiac output of the human heart from the pulse-type blood-stream pressure signal derived from the aorta and consisting in each case of a systolic and diastolic period. It is known in practice to calculate the stroke volume and the cardiac output with the aid of a thermodilution determination by injecting cold liquid into the blood stream and measuring it downstream at regular intervals.
- In another known method, a pulse contour method or prescription is used to determine the stroke volume Vs and the cardiac output or heart minute volume Q from a pressure signal p(t) measured in the human aorta. In this connection, the stroke volume is the volume of blood ejected by the heart in one contraction or stroke. A typical value is, for example, 70 cm³, but this quantity can vary from stroke to stroke. The cardiac output is the volume of blood which the heart pumps in a unit time of one minute. In this connection, a typical value is 5 l/min, and this volume can typically vary between 2 and 30 l/min.
- In the past relatively simple relationships have been assumed between the measured aorta pressure signal p(t) and the mean aorta flow g(t). In this connection, the starting point is the pressure signal since said pressure can be measured relatively easily and well, but the flow cannot. In practice it has been found that such a relationship or "model" is much more complicated than was first assumed. This has emerged, in particular, in hospitals, where this so-called pulse contour calculation has resulted in frustration in the case of seriously ill patients.
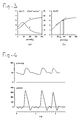
- In practice, usually a so-called "Windkessel" or air-receiver model is assumed, the aorta being conceived as a single compliance (figure 1b). In this case a windkessel - a container partially filled with liquid and with gas - which can absorb the surges in flow and buffer them in the gas bubble and which is incorporated downstream of a pulsatile pump is meant. The volume of blood ejected by the heart pump is largely received in the aorta or windkessel and partially flows away through the peripheral vascular regions of the various organs which branch off from the aorta. In the period in which the heart pump does not eject a volume of blood, i.e. the diastolic period Td, the outward flow from the windkessel continues to be fed to the peripheral vascular regions. The aorta does not then contain any gas but the aorta wall is elastic and this elastic vascular wall fulfils the same function as the windkessel.
- This concept contains various factors which are neglected. Firstly, the aorta is much longer than wide. In fact, the pressure wave generated by the heart requires a time of 0.1 to 0.3 sec. to reach the end of the aorta and then approximately the same time to return to the heart, whereas the entire expulsion period of the heart (the systolic period or systole, Ts) lasts only 0.2 to 0.4 sec. At the beginning of the output flow, only a small portion of the compliance is therefore available for buffering the outward flow. However, still more important is the fact that, after two times the propagation or transit time of the pressure wave, twice the capacity is available, albeit with a doubling of the initial pressure wave amplitude. In addition, a second neglect which is generally made is that the windkessel is linear, that is to say a doubling of the stored stroke volume is accompanied by a doubling of the pressure. In reality it has been known for a number of years from the work of G.J. Langewouters et al. in J. Biomechanics 17, pages 425-435 (1984) that the relationship between pressure p and volume V is strongly nonlinear in accordance with an arctangent function (figure 3a). In addition, said arctangent function is dependent on the age and sex of the patient. Finally, the drainage from the aorta to the peripheral vascular zones is not concentrated at one location but distributed along the aorta. That is to say, it takes a little time before the increased pressure at the start of the aorta has reached the various branching points to the peripheral vascular zones and the drainage actually increases due to the increased aorta pressure.
- To summarise, the neglects therefore amount to the fact that the aorta does not behave linearly and that there is a time factor due to a travelling wave along the aorta.
- In practice, however, another model is also assumed, the so-called transmission line model (figure 1a). In this approximation, the aorta is conceived as a homogeneous elastic tube of "adequate" length filled with liquid (blood), with drainage to the peripheral vascular zones concentrated at the end. Such a tube has two characteristic properties. A pressure wave generated by the heart at the start of the tube travels at finite velocity vp to the end of the tube, is partially reflected there and travels back to the start of the tube. By the time the reflected wave arrives there, the expulsion phase, the systole, of the heart is already over, the aorta valve is already closed and the heart no longer has any trouble from the reflected wave since the latter is, after all, held back by the closed valve. The "adequate length" is that length of tube which, given the propagation velocity of the wave, ensures that the reflected pressure wave does not return too soon. The propagation velocity vp is primarily determined by the area A of the cross section of the aorta, the compliance C' of the aorta per unit of length and the density ρ of the blood in the tube as follows:


- In addition to the propagation velocity, the second characterising property is the characteristic impedance Zo. This impedance reflects the ratio between the amplitude of the pressure wave and that of the accompanying flow wave in the aorta and is also affected by the cross sectional area A and the compliance C'. In fact, the characteristic impedance is given by the formula:


- This model also contains various approximations which, although they have less serious consequences for the stroke volume calculation, make the latter still too inaccurate under certain circumstances. Firstly, it is also true of this model that the aorta does not behave linearly in relation to the relationship between pressure p and volume V and therefore, with constant aorta length, as regards the cross section


- A third approximation is the following. After the blood has been forced into the aorta due to an increase in the pressure, the pressure in the subsequent diastolic period will, of course, not be zero immediately, but the aorta will slowly empty through the peripheral resistance. As a consequence of this, the subsequent stroke will be forced out against a somewhat increased pressure and the two pressures will in fact be superimposed on each other. The diastolic pressure will always increase further with every stroke until equilibrium has been reached between systolic inward flow and diastolic outward flow. This is comparable to a windkessel function.
- Finally, it is also true that the drainage is not concentrated at the end of the aorta but is distributed over the length thereof.
- To summarise, the neglects are a consequence of the fact that the aorta has nonlinear properties and cannot be conceived as homogeneous.
- Both the above model concepts are not adequate if an attempt is made to calculate the aorta flow pattern from the aorta pressure as a function of time during a systole using the models. The curve found with the transmission line model only resembles an actual flow curve to any extent under the conditions of a short-duration systole. The windkessel model does not actually even permit a calculation of a flow curve. In practice, for both models only the stroke volume of the heart, that is to say the flow curve integrated over one systole, is therefore calculated from the pressure curve.
- The object of the invention is to eliminate the abovementioned problems and to provide a method for the said determination of the stroke volume and cardiac output which takes account both of the windkessel properties and the transmission-line properties. This is achieved in the method as defined in the claims.
- In this case, the nonlinear aorta properties are important and are involved in this method, while it is advantageous for the verification of the correctness of the steps of the method if the flow curve can be continuously calculated and displayed during a systole. The integral of the flow curve then yields the stroke volume.
- The invention will be explained in greater detail on the basis of an embodiment, reference being made to the drawings, wherein:
- figures 1a and 1b show the two known pulse contour models, viz. the windkessel model and the uniform transmission line model;
- figures 2a and 2b show the pulse contour model according to the invention based on the transmission line model supplemented by the windkessel function, respectively without and with peripheral drainage;
- figure 3a shows a graph with stylised pressure/cross section and pressure/compliance per unit length relationship for a 40 year old male aorta;
- figure 3b shows a diagrammatic representation of the calculation of a linearised pressure using the arterial final diastolic pressure as initial value;
- figures 4a and 4b show, respectively, an input pressure signal p(t) and a calculated flow curve q(t) calculated with the aid of a pulse contour model; and
- figure 5 shows a number of graphs of the pulse contour (line) and thermodilution (o) cardiac output of six open-heart operation patients plotted against the number of the thermodilution determination.
- The invention assumes the transmission-line model, in particular, the transmission-line property that pressure wave and flow wave are related by a fixed factor, the characteristic impedance Zo, at least before reflections return to the heart from the periphery. This model lacks the gradual curbing of the outward flow from the heart by early reflections and the diastolic windkessel action. According to the invention, these two shortcomings are eliminated by means of adding one component, an aorta windkessel compliance Cw, to the transmission-line model (see figure 2a). After all, in the systole, the flow is determined in the first instance by Zo and is then gradually curbed during the ejection phase by the pressure increase of pw(t) which is built up in the windkessel receiver by the inflow q(t).
- A further neglect was that the peripheral drainage was conceived as concentrated at the end of the transmission line. As a result of now associating, according to the invention, the equivalent peripheral resistance Rp with the windkessel compliance Cw, the latter is connected to an average (albeit low-pass-filtered) pressure and consequently represents reality better. See figure 2b. For in this model, the outward flow

is subtracted from the inflow q(t) so that the curbing of the inflow takes place somewhat less rapidly. - The improved model according to the invention contains linear timeinvariant components. In reality, we are concerned with a strong nonlinear aorta whose pressure/cross section relationship varies in accordance with an arctangent. According to the invention two versions are now possible. In the first version, the pressure curve recorded in the method is first linearised and then applied to a linear pulse contour model. In the second version, the pressure measured in the method is regarded as given, but the pulse contour model is provided with pressuredependent components.
- In this first version it is assumed that the pressure curve arises because a certain volume of blood is pumped by the heart into the aorta, and this is followed by a rise in pressure. The magnitude of the rise in pressure depends on the pressure/volume relationship of the aorta. At a high pressure, a low volume increase will result in a high pressure increase, whereas at a low pressure, the same volume increase results in a smaller pressure increase (arctangent relationship). However, it is possible to calculate, by means of the pressure/volume relationship assumed to be known, the pressure curve which would have existed if the aorta had had a linear pressure/volume relationship. The procedure can be indicated graphically in a simple manner (see figure 3b). For every stroke, the start of the expulsion phase in the pressure curve and the associated final diastolic pressure pd are determined. At said pressure, the nonlinear aorta pressure/volume relationship or, assuming a fixed aorta length, pressure/cross section relationship is linearised by means of the tangent to the curve and the equivalent linear pressure is calculated for every pressure sample taken on the pressure curve. Assuming an initial pressure pd of 70 mmHg, in this example of a pressure sample of 100 mmHg, the equivalent linear pressure becomes equal to approximately 92 mmHg. This pressure is then applied to the pulse contour model which, for characteristic impedance and windkessel compliance calculated from the applicable pressure/cross section relationship, has the values associated with the final diastolic pressure for the stroke concerned.
- In this second version, it is assumed that the pressure curve arises as a result of the outward flow of the blood into a nonlinear aorta, given all its properties and not only its windkessel properties, as above. A linear correction is not then applied to the pressure curve but is accepted as it is. However, during the expulsion phase of the stroke concerned, the value of the characteristic impedance and of the windkessel compliance varies according to the pressure value such as it exists at any instant and is calculated from the nonlinear arctangent pressure/cross section relationship according to the above formulae. At any instant when a pressure sample is taken, the associated characteristic impedance and windkessel compliance, and the effect of these altered values on the flow are calculated.
- According to Langewouters et al., the relationship between the area of the aorta cross section and the aorta pressure can be specified using the formula:

- The compliance C' per unit of length as a function of the pressure follows from this as a result of differentiation with respect to p as:

where
The values of the parameters Am, po and p₁ are known from the work of Langewouters et al. In particular, these parameters depend on the sex and age of the person. The value for Am has, in addition, a dispersion of approximately 20%. It is not therefore possible to determine the values of the components in the pulse contour model in an absolute sense without more exact calibration unless a standard deviation of approximately 20% is regarded as acceptable. - Zo and vp can readily be calculated with the aid of A and C' found in this way. To calculate the total windkessel compliance of the aorta, still one more parameter is required, namely the effective length of the aorta. The windkessel compliance is then the compliance per unit of length multiplied by the effective length:

- The value of the peripheral resistance.
- The pulse contour model of figure 2b includes a component representing the total peripheral resistance Rp of all the vascular drainage beds in parallel. The value of the latter is initially unknown. After the stroke volume Vs has been calculated for the first time and the heartbeat rate f, the number of heartbeats per minute, has been found from the sum of the systolic and diastolic time periods


The value of the peripheral resistance then readily follows as:
- Calculation of the flow using the pulse contour model.
- The flow q at any instant can be calculated using a simulation. In this connection, equations are set up which describe the behaviour of the model of figure 2b. The aorta flow follows from the equation: q(t) = 1/Zo).{(p(t) - pw(t)}. The flow through the peripheral resistance follows from:


formulae - A measured pressure curve and the flow curve calculated from it are shown in figure 4 for a 62 year old male patient. Before every stroke, the beginning of the rising edge of the pressure curve in figure 4a is determined using a pattern recognition algorithm. At this instant, the diastolic pressure pd on the curve is recorded, and with the latter, the correct values for the characteristic impedance and the windkessel compliance are found using a function generator and introduced into the model. The pressure is linearised using the arctangent pressure/ cross section relationship and is applied to the model. The correct values for the parameters which determine the arctangent pressure/cross section relationship follow from regression equations according to Langewouters et al. and are as follows for women and men, respectively, having an age n:
for women: for men: Am = 4.12 Am = 5.62 po = 72 - 0.89n po = 76 - 0.89n p₁ = 57 - 0.44n p₁ = 57 - 0.44n
where Am is in cm², the pressures p is in mmHg and the age n is in years. - Obviously, these calculations can advantageously be carried out by a digital processor. For this purpose, it is necessary to replace the continuous pressure curve by a series of samples with regular spacing intervals and to repeat the calculation for every sample taken. The flow curve therefore becomes available at these time instants. A preferred sample interval is 10 ms. A shorter interval of 5 ms is possible if a fast computer is used but only gives a marginal improvement in the precision. The integration of the flow curve in order to calculate the stroke volume is replaced by a summation of the flow samples in the systolic period.
- The precision of the new method.
- The new method has been evaluated in six patients who were undergoing an open-heart operation. The reference value for the cardiac output was measured at some time instants during the operation by repeating a thermodilution (TD) determination at least four times after injections of cold liquid distributed with precise regularity over the respiratory cycle. A single thermodilution determination would be too inaccurate. The particular feature is that the four determinations were injected so as to be spread regularly over the respiratory cycle, as a result of which an averaging of the four values usually means an improvement in the precision of the estimate of the actual cardiac output by a factor of four. This improvement is only achieved with mechanical insufflation and not, therefore, if the patient breathes spontaneously. Spontaneous breathing always takes place during the first determination, i.e. at "s", as marked in figure 5, and during all the subsequent determinations, the patient is anaesthetised and he is artificially insufflated.
- The cardiac output calculated by the novel pulse contour method was recorded at the same time for comparison. The results are shown separately for each of the patients in figure 5. The number of simultaneous determinations, the mean error, the error standard deviation (SD) and the error span are shown for each
patient number 8910 to 8912 and 8915 to 8917 in table 1 and averaged for the group. Note that the sixth patient has a larger error for three determinations. These were carried out after a period of total heart-long bypass while, although the heart was already beating and pumping blood, the pump of the heart-lung machine was still assisting at approximately one litre per minute. This flow was in fact measured by the thermodilution method but not by the pulse contour method, resulting in this discrepancy. - For comparison, the cardiac output was also calculated by the earlier method according to Wesseling et al. from US 3,841,313, which method was known as the most accurate in the literature. The mean error standard deviation was in this case 12%, against 8% for the novel method. The novel method therefore has a variance of less than half that of the old.
- Roughly speaking, all the mean errors - shown in the last two rows - with the new method are more than a factor of √2 lower than with the older method.
Table 1 pat nr TD PC Error old Error new old new mean SD span mean SD span 8910 4.67 5.21 4.53 0.54 0.43 1.02 0.14 0.38 1.12 8911 5.43 4.89 4.99 0.54 0.38 1.02 0.44 0.37 0.99 8912 4.59 5.31 5.41 0.73 0.45 1.24 0.08 0.38 1.37 8915 4.10 4.49 3.80 0.38 0.65 1.81 0.30 0.26 0.60 8916 4.69 4.98 5.13 0.29 0.45 1.44 0.43 0.33 0.89 8917 4.29 4.33 4.03 0.04 0.88 2.97 0.26 0.50 1.50 mean 4.63 4.87 4.50 0.24 0.54 1.58 0.13 0.37 1.08 SD 0.46 0.39 0.52 0.45 0.19 0.74 0.30 0.08 0.33 - During the intensive monitoring of a patient in the operating theatre or intensive-care ward, it is only rarely possible to record the arterial pressure in the aorta. For reasons of convenience and safety for the patient, the pressure in the artery radialis or brachialis or a finger pressure will normally be recorded non-invasively. This pressure is distorted compared with the aorta pressure, that is to say the shape of the pressure curve has changed. This is due to the fact that the pressure curve generated in the aorta propagates through the arterial system to the more peripherally situated upper arm, pulse or finger and that this transmission path has certain properties, the most important of which are its narrow-band nature and its low-frequency resonance. It is possible to measure these properties in a large number of patients. In this connection, the inventor has found that the transmission properties have a relatively small spread around a mean value. In that case it is possible to correct the resonance properties by an anti-resonance in a filter, as a result of which it is indeed possible to accurately determine the pulse contour stroke volume of the left-hand half of the heart. To a good approximation, a simple second-order filter can be used for this purpose. In practice, a digital, IIR (infinite impulse response) second- or third-order filter is used which corrects the mean resonance precisely up to a frequency of 8 Hz.
- In this case, on the basis of a series of input signal samples xn, a series of output signal samples yn is calculated using the formula:

where c and d are constant filter coefficients. For the second-order filter, the following values are used: - co
- = 0.077
- d₁
- = 1.484
- d₂
- = -0.561
Claims (9)
- A method for determining blood stroke volume from a pulsatile aorta blood-flow pressure signal in a subject, comprising the steps of:- providing a sensor for measuring arterial blood pressure in the subject and producing a corresponding aorta blood-flow pressure signal consisting of a systolic and and a diastolic period,- providing a simulation model of the aorta as a transmission line supplemented with a windkessel compliance, and providing an arctangent relation for the nonlinear pressure-volume relation in the aorta,- introducing the pressure in above model and calculating the flow therefrom as function of time, and- integrating the flow over the systolic period thereby providing the stroke volume.
- Method in accordance with claim 1, wherein said step of providing the arctangent pressure-volume relation is derived, with a fixed aorta length, from the aorta pressure/crosssection according to:
 A(p) = the cross section as a function of the pressure p,Am = the limit cross section at very high pressure,po = the pressure of the point of inflection of the arctangent relationship, andp₁ = is the slope of the arctangent relationship at the point of inflection.
 - Method in accordance with claim 2, further including- continuously introducing the measured pressure into the simulation model, and- continuously adapting the characteristic impedance of the transmission line and windkessel compliance to the pressure of the windkessel compliance in accordance with the arctangent relation during each stroke.
- Method according to claim 2, further including- linearizing the pressure on the basis of a linear pressure/volume relation of the aorta, and- introducing said pressure into the pulse contour model while maintaining the values of characteristic impedance of the transmission line and windkessel compliance associated with the final diastolic pressure.
- Method in accordance with claim 4, further including calculating the flow g(t) according to a formula


ρ = density of blood,

Cm =
- Method in accordance with claim 1, further including calculating cardiac output Q as product of the stroke volume and heart rate.
- Method in accordance with claim 6, further including- calculating a peripheral resistance Rp in accordance with a formula

 - calculating the flow through the peripheral resistance Rp in accordance with a formula
- Method in accordance with claim 1, further including- measuring the blood pressure in the arteria radialis or brachialis, and- filtering the measured pressure signal in order to correct resonance distortion in the pressure curve caused by transmission.
- Method in accordance with claim 1, further including- measuring the blood pressure, non-invasively, in the finger, and- filtering the measured pressure signal in order to correct resonance distortion in the pressure curve caused by transmission.
Applications Claiming Priority (3)
| Application Number | Priority Date | Filing Date | Title |
|---|---|---|---|
| NL9100150A NL9100150A (en) | 1991-01-29 | 1991-01-29 | METHOD FOR DETERMINING THE BATTLE VOLUME AND THE HEART MINUTE VOLUME OF THE HUMAN HEART. |
| NL9100150 | 1991-01-29 | ||
| PCT/NL1992/000022 WO1992012669A1 (en) | 1991-01-29 | 1992-01-28 | Method of determining the stroke volume and the cardiac output of the human heart |
Publications (2)
| Publication Number | Publication Date |
|---|---|
| EP0569506A1 EP0569506A1 (en) | 1993-11-18 |
| EP0569506B1 true EP0569506B1 (en) | 1995-10-11 |
Family
ID=19858791
Family Applications (1)
| Application Number | Title | Priority Date | Filing Date |
|---|---|---|---|
| EP92905499A Expired - Lifetime EP0569506B1 (en) | 1991-01-29 | 1992-01-28 | Method of determining the stroke volume and the cardiac output of the human heart |
Country Status (10)
| Country | Link |
|---|---|
| US (1) | US5400793A (en) |
| EP (1) | EP0569506B1 (en) |
| JP (1) | JP3293621B2 (en) |
| AT (1) | ATE128837T1 (en) |
| CA (1) | CA2101531C (en) |
| DE (1) | DE69205417T2 (en) |
| DK (1) | DK0569506T3 (en) |
| ES (1) | ES2080489T3 (en) |
| NL (1) | NL9100150A (en) |
| WO (1) | WO1992012669A1 (en) |
Cited By (5)
| Publication number | Priority date | Publication date | Assignee | Title |
|---|---|---|---|---|
| US6758822B2 (en) | 1999-04-27 | 2004-07-06 | Salvatore Romano | Method and apparatus for measuring cardiac output |
| US7220230B2 (en) | 2003-12-05 | 2007-05-22 | Edwards Lifesciences Corporation | Pressure-based system and method for determining cardiac stroke volume |
| US7422562B2 (en) | 2003-12-05 | 2008-09-09 | Edwards Lifesciences | Real-time measurement of ventricular stroke volume variations by continuous arterial pulse contour analysis |
| US7452333B2 (en) | 2003-12-05 | 2008-11-18 | Edwards Lifesciences Corporation | Arterial pressure-based, automatic determination of a cardiovascular parameter |
| DE102016001710A1 (en) | 2016-02-15 | 2017-08-17 | Fresenius Medical Care Deutschland Gmbh | Device for extracorporeal blood treatment with an evaluation and control unit |
Families Citing this family (64)
| Publication number | Priority date | Publication date | Assignee | Title |
|---|---|---|---|---|
| US5584298A (en) * | 1993-10-25 | 1996-12-17 | Kabal; John | Noninvasive hemodynamic analyzer alterable to a continuous invasive hemodynamic monitor |
| US5836884A (en) * | 1993-12-17 | 1998-11-17 | Pulse Metric, Inc. | Method for diagnosing, monitoring and treating hypertension and other cardiac problems |
| US5535753A (en) * | 1994-10-04 | 1996-07-16 | Rutgers University | Apparatus and methods for the noninvasive measurement of cardiovascular system parameters |
| EP0818175B1 (en) * | 1995-11-01 | 2004-04-28 | Seiko Epson Corporation | Living body condition measuring apparatus |
| US6569103B2 (en) | 1995-12-22 | 2003-05-27 | Arrow International Investment Corp. | Device for determining a characteristic point in the cardiac cycle |
| US6010457A (en) * | 1996-03-15 | 2000-01-04 | Pmv Medical Pty Ltd | Non-invasive determination of aortic flow velocity waveforms |
| US5971934A (en) * | 1996-10-04 | 1999-10-26 | Trustees Of The University Of Pennsylvania | Noninvasive method and apparatus for determining cardiac output |
| GB9714550D0 (en) | 1997-07-10 | 1997-09-17 | Lidco Ltd | Improved method and apparatus for the measurement of cardiac output |
| DE19814371A1 (en) | 1998-03-31 | 1999-10-14 | Pulsion Verwaltungs Gmbh & Co | Method for in-vivo determination of the compliance function and the systemic blood flow of a living being and device for carrying out the method |
| US6117087A (en) * | 1998-04-01 | 2000-09-12 | Massachusetts Institute Of Technology | Method and apparatus for noninvasive assessment of a subject's cardiovascular system |
| US6986744B1 (en) * | 1999-02-02 | 2006-01-17 | Transonic Systems, Inc. | Method and apparatus for determining blood flow during a vascular corrective procedure |
| US6315735B1 (en) | 1999-03-31 | 2001-11-13 | Pulsion Medical Systems Ag | Devices for in-vivo determination of the compliance function and the systemic blood flow of a living being |
| US6440078B1 (en) | 1999-07-23 | 2002-08-27 | Roberto Curiel | Method and system of determining cardiac contractility |
| US6939303B2 (en) * | 1999-07-23 | 2005-09-06 | Provecto Tecnico R-2000, Ca | Method and system of determining cardiac contractility |
| AU776098B2 (en) * | 1999-11-24 | 2004-08-26 | Edwards Lifesciences Corporation | Method and apparatus for determining cardiac output or total peripheral resistance |
| AUPQ420599A0 (en) * | 1999-11-24 | 1999-12-16 | Duncan Campbell Patents Pty Ltd | Method and apparatus for determining cardiac output or total peripheral resistance |
| US6510337B1 (en) * | 1999-11-26 | 2003-01-21 | Koninklijke Philips Electronics, N.V. | Multi-phase cardiac imager |
| NL1016320C2 (en) | 2000-10-03 | 2002-04-04 | Jozef Reinier Cornelis Jansen | Device for controlling heart supporting devices. |
| US7011631B2 (en) * | 2003-01-21 | 2006-03-14 | Hemonix, Inc. | Noninvasive method of measuring blood density and hematocrit |
| US7815578B2 (en) * | 2003-02-10 | 2010-10-19 | Massachusetts Institute Of Technology | Methods and apparatus for determining cardiac output |
| FR2860980B1 (en) * | 2003-10-16 | 2005-12-30 | Ela Medical Sa | ACTIVE IMPLANTABLE MEDICAL DEVICE COMPRISING MEANS FOR ADJUSTING THE MAXIMUM FREQUENCY OF VENTRICULAR STIMULATION BASED ON THE HEMODYNAMIC STATUS OF THE PATIENT |
| US7813808B1 (en) | 2004-11-24 | 2010-10-12 | Remon Medical Technologies Ltd | Implanted sensor system with optimized operational and sensing parameters |
| US20060167361A1 (en) * | 2005-01-27 | 2006-07-27 | Bennett Tommy D | Method and apparatus for continuous pulse contour cardiac output |
| US7935062B2 (en) * | 2005-01-27 | 2011-05-03 | Medtronic, Inc. | Derivation of flow contour from pressure waveform |
| US7651466B2 (en) * | 2005-04-13 | 2010-01-26 | Edwards Lifesciences Corporation | Pulse contour method and apparatus for continuous assessment of a cardiovascular parameter |
| DE602006007989D1 (en) * | 2005-05-19 | 2009-09-03 | Jansen Jozef Reinier C | T PATIENT MONITORING PARAMETERS RELATED TO THE PATIENT |
| US7742815B2 (en) * | 2005-09-09 | 2010-06-22 | Cardiac Pacemakers, Inc. | Using implanted sensors for feedback control of implanted medical devices |
| AT502922B1 (en) * | 2005-11-08 | 2011-07-15 | Arc Seibersdorf Res Gmbh | METHOD AND DEVICE FOR DETERMINING THE HEART TIME VOLUME |
| US20070142727A1 (en) * | 2005-12-15 | 2007-06-21 | Cardiac Pacemakers, Inc. | System and method for analyzing cardiovascular pressure measurements made within a human body |
| US8343061B2 (en) | 2006-03-15 | 2013-01-01 | Board Of Trustees Of Michigan State University | Method and apparatus for determining central aortic pressure waveform |
| US8905939B2 (en) | 2006-07-13 | 2014-12-09 | Edwards Lifesciences Corporation | Method and apparatus for continuous assessment of a cardiovascular parameter using the arterial pulse pressure propagation time and waveform |
| US7955268B2 (en) * | 2006-07-21 | 2011-06-07 | Cardiac Pacemakers, Inc. | Multiple sensor deployment |
| WO2008144525A1 (en) | 2007-05-16 | 2008-11-27 | Massachusetts Institute Of Technology | System and method for prediction and detection of circulatory shock |
| WO2008144490A1 (en) * | 2007-05-16 | 2008-11-27 | Massachusetts Instutute Of Technology | Systems and methods for model-based estimation of cardiac ejection fraction, cardiac contractility, and ventricular end-diastolic volume |
| US8282564B2 (en) * | 2007-05-16 | 2012-10-09 | Massachusetts Institute Of Technology | Systems and methods for model-based estimation of cardiac output and total peripheral resistance |
| EP2178433A1 (en) * | 2007-07-20 | 2010-04-28 | Bmeye B.V. | A method, a system and a computer program product for determining a beat-to beat stroke volume and/or a cardiac output |
| DE102007057235A1 (en) * | 2007-11-28 | 2009-06-04 | Iprm Intellectual Property Rights Management Ag | Method and device for determining the end of the systolic part of a pressure curve |
| US20090270739A1 (en) * | 2008-01-30 | 2009-10-29 | Edwards Lifesciences Corporation | Real-time detection of vascular conditions of a subject using arterial pressure waveform analysis |
| US8725260B2 (en) * | 2008-02-11 | 2014-05-13 | Cardiac Pacemakers, Inc | Methods of monitoring hemodynamic status for rhythm discrimination within the heart |
| US8369960B2 (en) | 2008-02-12 | 2013-02-05 | Cardiac Pacemakers, Inc. | Systems and methods for controlling wireless signal transfers between ultrasound-enabled medical devices |
| DE102008008840A1 (en) * | 2008-02-13 | 2009-09-24 | Up Management Gmbh | Method and device for the non-invasive measurement of dynamic heart-lung interaction parameters |
| EP2296537B1 (en) * | 2008-02-15 | 2018-05-30 | Université Paris Sud | Device and process for calculating new indices of arterial stiffness, and/or for stroke volume monitoring |
| KR101006198B1 (en) * | 2008-04-16 | 2011-01-12 | ㈜비엔컴 | Hands-free system using bluetooth and control method thereof |
| US10251566B2 (en) | 2008-05-27 | 2019-04-09 | Board Of Trustees Of Michigan State University | Methods and apparatus for determining a central aortic pressure waveform from a peripheral artery pressure waveform |
| US20100152547A1 (en) | 2008-07-02 | 2010-06-17 | Sterling Bernhard B | Method and system for determining cardiac performance |
| WO2010027652A1 (en) * | 2008-08-26 | 2010-03-11 | Cardiac Pacemakers, Inc. | Cardiac output estimation using pulmonary artery pressure |
| JP5465252B2 (en) * | 2008-10-10 | 2014-04-09 | カーディアック ペースメイカーズ, インコーポレイテッド | System and method for determining cardiac output using pulmonary artery pressure measurements |
| GB0821084D0 (en) * | 2008-11-18 | 2008-12-24 | King S College London | Apparatus and method |
| WO2010059291A1 (en) | 2008-11-19 | 2010-05-27 | Cardiac Pacemakers, Inc. | Assessment of pulmonary vascular resistance via pulmonary artery pressure |
| US20100324378A1 (en) * | 2009-06-17 | 2010-12-23 | Tran Binh C | Physiologic signal monitoring using ultrasound signals from implanted devices |
| US20110040194A1 (en) * | 2009-08-12 | 2011-02-17 | Rajendra Prasad Jadiyappa | Method and system for determining cardiac parameters |
| EP2493373B1 (en) * | 2009-10-29 | 2016-03-16 | CNSystems Medizintechnik AG | Apparatus and methods for enhancing and analyzing signals from a continuous non-invasive blood pressure measurement device |
| JP5850861B2 (en) | 2010-01-29 | 2016-02-03 | エドワーズ ライフサイエンシーズ コーポレイションEdwards Lifesciences Corporation | Eliminating the effects of irregular cardiac cycles in determining cardiovascular parameters |
| US9782089B2 (en) | 2010-09-08 | 2017-10-10 | Siemens Healthcare Gmbh | Worksheet system for determining measured patient values for use in clinical assessment and calculations |
| EP2763583A1 (en) | 2011-10-07 | 2014-08-13 | Edwards Lifesciences Corporation | Detecting a vasoactive agent in the bloodstream |
| CN102499658B (en) * | 2011-11-08 | 2013-12-11 | 中国科学院深圳先进技术研究院 | Central blood pressure waveform reconstruction module and reconstruction method |
| WO2015006295A1 (en) | 2013-07-08 | 2015-01-15 | Edwards Lifesciences Corporation | Determination of a hemodynamic parameter |
| AU2015223182B2 (en) | 2014-02-25 | 2017-09-14 | Icu Medical, Inc. | Patient monitoring system with gatekeeper signal |
| JP6674553B2 (en) | 2015-10-19 | 2020-04-01 | アイシーユー・メディカル・インコーポレーテッド | Hemodynamic monitoring system with detachable display unit |
| CN105496360B (en) * | 2015-12-03 | 2018-06-19 | 北京大学人民医院 | A kind of kit of the full crowd's systemic blood vessels compliance of auxiliary judgment |
| CN105361886B (en) * | 2015-12-03 | 2018-06-19 | 北京大学人民医院 | A kind of kit of auxiliary judgment sub-health population systemic blood vessels compliance |
| DE102015015784A1 (en) * | 2015-12-08 | 2017-06-08 | WSH Engineering Services GbR (vertretungsberechtigter Gesellschafter: Hieronymi, Andreas, 61440 Oberursel) | Method for detecting arterial parameters of a human and apparatus for carrying out the method |
| EP3430989B1 (en) | 2016-04-15 | 2021-06-09 | Omron Corporation | Biological information analysis device, system, program, and biological information analysis method |
| CN111493855B (en) * | 2020-04-21 | 2023-01-06 | 重庆理工大学 | System and method for non-invasive measurement of individualized cardiac output |
Family Cites Families (4)
| Publication number | Priority date | Publication date | Assignee | Title |
|---|---|---|---|---|
| US4632125A (en) * | 1984-01-13 | 1986-12-30 | American Hospital Supply Corp. | Right heart ejection fraction and cardiac output catheter |
| JPS62207435A (en) * | 1986-03-07 | 1987-09-11 | テルモ株式会社 | Catheter for measuring cardiac output |
| US5211177A (en) * | 1990-12-28 | 1993-05-18 | Regents Of The University Of Minnesota | Vascular impedance measurement instrument |
| US5183051A (en) * | 1991-01-14 | 1993-02-02 | Jonathan Kraidin | Means and apparatus for continuously determining cardiac output in a subject |
-
1991
- 1991-01-29 NL NL9100150A patent/NL9100150A/en not_active Application Discontinuation
-
1992
- 1992-01-28 WO PCT/NL1992/000022 patent/WO1992012669A1/en active IP Right Grant
- 1992-01-28 AT AT92905499T patent/ATE128837T1/en not_active IP Right Cessation
- 1992-01-28 CA CA002101531A patent/CA2101531C/en not_active Expired - Lifetime
- 1992-01-28 US US08/094,052 patent/US5400793A/en not_active Expired - Lifetime
- 1992-01-28 DE DE69205417T patent/DE69205417T2/en not_active Expired - Lifetime
- 1992-01-28 DK DK92905499.7T patent/DK0569506T3/en active
- 1992-01-28 JP JP50509092A patent/JP3293621B2/en not_active Expired - Lifetime
- 1992-01-28 EP EP92905499A patent/EP0569506B1/en not_active Expired - Lifetime
- 1992-01-28 ES ES92905499T patent/ES2080489T3/en not_active Expired - Lifetime
Non-Patent Citations (2)
| Title |
|---|
| ENCYCLOPEDIA OF MEDICAL DEVICES AND INSTRUMENTATION, vol.3, 1988, J.Webster, pages 1493-1509; N.Westerhof et al.:"Hemodynamics" * |
| MEDICAL AND BIOLOGICAL ENGINEERING AND COMPUTING. vol. 16, no. 6, November1978, STEVENAGE GB pages 697 - 706; A.O.BRUBAKK: 'Use of a simulation model forestimating cardiac output from aortic' * |
Cited By (9)
| Publication number | Priority date | Publication date | Assignee | Title |
|---|---|---|---|---|
| US6758822B2 (en) | 1999-04-27 | 2004-07-06 | Salvatore Romano | Method and apparatus for measuring cardiac output |
| US7220230B2 (en) | 2003-12-05 | 2007-05-22 | Edwards Lifesciences Corporation | Pressure-based system and method for determining cardiac stroke volume |
| US7422562B2 (en) | 2003-12-05 | 2008-09-09 | Edwards Lifesciences | Real-time measurement of ventricular stroke volume variations by continuous arterial pulse contour analysis |
| US7452333B2 (en) | 2003-12-05 | 2008-11-18 | Edwards Lifesciences Corporation | Arterial pressure-based, automatic determination of a cardiovascular parameter |
| US7785263B2 (en) | 2003-12-05 | 2010-08-31 | Edwards Lifesciences Corporation | Pressure-based system and method for determining cardiac stroke volume |
| US7967757B2 (en) | 2003-12-05 | 2011-06-28 | Edwards Lifesciences Corporation | Arterial pressure-based, automatic determination of a cardiovascular parameter |
| DE102016001710A1 (en) | 2016-02-15 | 2017-08-17 | Fresenius Medical Care Deutschland Gmbh | Device for extracorporeal blood treatment with an evaluation and control unit |
| WO2017140424A2 (en) | 2016-02-15 | 2017-08-24 | Fresenius Medical Care Deutschland Gmbh | Equipment for extra-corporeal treatment of blood, comprising an evaluation- and control unit |
| DE102016001710B4 (en) | 2016-02-15 | 2022-08-25 | Fresenius Medical Care Deutschland Gmbh | Device for extracorporeal blood treatment with an evaluation and control unit |
Also Published As
| Publication number | Publication date |
|---|---|
| DE69205417D1 (en) | 1995-11-16 |
| JPH06505651A (en) | 1994-06-30 |
| JP3293621B2 (en) | 2002-06-17 |
| US5400793A (en) | 1995-03-28 |
| WO1992012669A1 (en) | 1992-08-06 |
| ES2080489T3 (en) | 1996-02-01 |
| NL9100150A (en) | 1992-08-17 |
| EP0569506A1 (en) | 1993-11-18 |
| ATE128837T1 (en) | 1995-10-15 |
| CA2101531C (en) | 2003-01-14 |
| DE69205417T2 (en) | 1996-05-30 |
| DK0569506T3 (en) | 1995-12-04 |
| CA2101531A1 (en) | 1992-07-30 |
Similar Documents
| Publication | Publication Date | Title |
|---|---|---|
| EP0569506B1 (en) | Method of determining the stroke volume and the cardiac output of the human heart | |
| US9375160B2 (en) | Systems and methods for model-based estimation of cardiac output and total peripheral resistance | |
| AU729956B2 (en) | Improved method and apparatus for the measurement of cardiac output | |
| JP3710823B2 (en) | Improved method and apparatus for measuring cardiac output | |
| AU2010257159B2 (en) | Method and device for detecting and assessing reactive hyperemia using segmental plethysmography | |
| EP0765630A1 (en) | Method and device for determining brachial arterial pressure wave on the basis of noninvasively measured finger blood pressure wave | |
| US20090287097A1 (en) | Method for estimating a central pressure waveform obtained with a blood pressure cuff | |
| US20170238824A1 (en) | Method for oscillatory non-invasive blood pressure (nibp) measurement and control unit for an nibp apparatus | |
| EP2566387A2 (en) | Brachial cuff | |
| CN111493855B (en) | System and method for non-invasive measurement of individualized cardiac output | |
| US10226186B2 (en) | Method and device for detecting and assessing reactive hyperemia using segmental plethysmography | |
| WO2017129495A1 (en) | Pulse rate measurement module and method | |
| EP1150604B1 (en) | Method and device for continuous analysis of cardiovascular activity of a subject | |
| CA2942022C (en) | Method and device for detecting and assessing reactive hyperemia using segmental plethysmography | |
| Seabra et al. | Arterial Flow and Diameter-based Blood Pressure Models-an In-silico Comparison | |
| EA003497B1 (en) | Method of compression volume oscillometry for determining parameters of blood circulation system | |
| Westerhof et al. | Sensitivity of pressure transfer to arterial parameters |
Legal Events
| Date | Code | Title | Description |
|---|---|---|---|
| PUAI | Public reference made under article 153(3) epc to a published international application that has entered the european phase |
Free format text: ORIGINAL CODE: 0009012 |
|
| 17P | Request for examination filed |
Effective date: 19930728 |
|
| AK | Designated contracting states |
Kind code of ref document: A1 Designated state(s): AT BE CH DE DK ES FR GB IT LI LU NL SE |
|
| 17Q | First examination report despatched |
Effective date: 19931119 |
|
| GRAA | (expected) grant |
Free format text: ORIGINAL CODE: 0009210 |
|
| AK | Designated contracting states |
Kind code of ref document: B1 Designated state(s): AT BE CH DE DK ES FR GB IT LI LU NL SE |
|
| REF | Corresponds to: |
Ref document number: 128837 Country of ref document: AT Date of ref document: 19951015 Kind code of ref document: T |
|
| REF | Corresponds to: |
Ref document number: 69205417 Country of ref document: DE Date of ref document: 19951116 |
|
| REG | Reference to a national code |
Ref country code: DK Ref legal event code: T3 |
|
| ITF | It: translation for a ep patent filed |
Owner name: STUDIO TORTA SOCIETA' SEMPLICE |
|
| REG | Reference to a national code |
Ref country code: ES Ref legal event code: FG2A Ref document number: 2080489 Country of ref document: ES Kind code of ref document: T3 |
|
| ET | Fr: translation filed | ||
| PLBE | No opposition filed within time limit |
Free format text: ORIGINAL CODE: 0009261 |
|
| STAA | Information on the status of an ep patent application or granted ep patent |
Free format text: STATUS: NO OPPOSITION FILED WITHIN TIME LIMIT |
|
| 26N | No opposition filed | ||
| PGFP | Annual fee paid to national office [announced via postgrant information from national office to epo] |
Ref country code: ES Payment date: 19970731 Year of fee payment: 6 |
|
| PG25 | Lapsed in a contracting state [announced via postgrant information from national office to epo] |
Ref country code: ES Free format text: THE PATENT HAS BEEN ANNULLED BY A DECISION OF A NATIONAL AUTHORITY Effective date: 19980129 |
|
| REG | Reference to a national code |
Ref country code: GB Ref legal event code: IF02 |
|
| REG | Reference to a national code |
Ref country code: ES Ref legal event code: FD2A Effective date: 20020204 |
|
| PGFP | Annual fee paid to national office [announced via postgrant information from national office to epo] |
Ref country code: FR Payment date: 20110607 Year of fee payment: 20 Ref country code: CH Payment date: 20110512 Year of fee payment: 20 Ref country code: SE Payment date: 20110513 Year of fee payment: 20 Ref country code: LU Payment date: 20110603 Year of fee payment: 20 |
|
| PGFP | Annual fee paid to national office [announced via postgrant information from national office to epo] |
Ref country code: DK Payment date: 20110512 Year of fee payment: 20 Ref country code: GB Payment date: 20110520 Year of fee payment: 20 Ref country code: AT Payment date: 20110512 Year of fee payment: 20 Ref country code: BE Payment date: 20110511 Year of fee payment: 20 Ref country code: NL Payment date: 20110520 Year of fee payment: 20 |
|
| PGFP | Annual fee paid to national office [announced via postgrant information from national office to epo] |
Ref country code: IT Payment date: 20110527 Year of fee payment: 20 |
|
| REG | Reference to a national code |
Ref country code: DE Ref legal event code: R071 Ref document number: 69205417 Country of ref document: DE |
|
| REG | Reference to a national code |
Ref country code: DE Ref legal event code: R071 Ref document number: 69205417 Country of ref document: DE |
|
| BE20 | Be: patent expired |
Owner name: NEDERLANDSE ORGANISATIE VOOR TOEGEPAST-NATUURWETEN Effective date: 20120128 |
|
| REG | Reference to a national code |
Ref country code: CH Ref legal event code: PL |
|
| REG | Reference to a national code |
Ref country code: NL Ref legal event code: V4 Effective date: 20120128 |
|
| REG | Reference to a national code |
Ref country code: DK Ref legal event code: EUP |
|
| REG | Reference to a national code |
Ref country code: GB Ref legal event code: PE20 Expiry date: 20120127 |
|
| REG | Reference to a national code |
Ref country code: SE Ref legal event code: EUG |
|
| REG | Reference to a national code |
Ref country code: AT Ref legal event code: MK07 Ref document number: 128837 Country of ref document: AT Kind code of ref document: T Effective date: 20120128 |
|
| PG25 | Lapsed in a contracting state [announced via postgrant information from national office to epo] |
Ref country code: DE Free format text: LAPSE BECAUSE OF EXPIRATION OF PROTECTION Effective date: 20120129 |
|
| PG25 | Lapsed in a contracting state [announced via postgrant information from national office to epo] |
Ref country code: GB Free format text: LAPSE BECAUSE OF EXPIRATION OF PROTECTION Effective date: 20120127 |
|
| PGFP | Annual fee paid to national office [announced via postgrant information from national office to epo] |
Ref country code: DE Payment date: 20110511 Year of fee payment: 20 |