EP0791207B1 - Method and device for imaging the interior of a turbid medium - Google Patents
Method and device for imaging the interior of a turbid medium Download PDFInfo
- Publication number
- EP0791207B1 EP0791207B1 EP96927152A EP96927152A EP0791207B1 EP 0791207 B1 EP0791207 B1 EP 0791207B1 EP 96927152 A EP96927152 A EP 96927152A EP 96927152 A EP96927152 A EP 96927152A EP 0791207 B1 EP0791207 B1 EP 0791207B1
- Authority
- EP
- European Patent Office
- Prior art keywords
- image
- turbid medium
- light
- light source
- detector
- Prior art date
- Legal status (The legal status is an assumption and is not a legal conclusion. Google has not performed a legal analysis and makes no representation as to the accuracy of the status listed.)
- Expired - Lifetime
Links
Images


Classifications
-
- G—PHYSICS
- G06—COMPUTING; CALCULATING OR COUNTING
- G06T—IMAGE DATA PROCESSING OR GENERATION, IN GENERAL
- G06T11/00—2D [Two Dimensional] image generation
- G06T11/003—Reconstruction from projections, e.g. tomography
- G06T11/008—Specific post-processing after tomographic reconstruction, e.g. voxelisation, metal artifact correction
-
- G—PHYSICS
- G01—MEASURING; TESTING
- G01N—INVESTIGATING OR ANALYSING MATERIALS BY DETERMINING THEIR CHEMICAL OR PHYSICAL PROPERTIES
- G01N21/00—Investigating or analysing materials by the use of optical means, i.e. using sub-millimetre waves, infrared, visible or ultraviolet light
- G01N21/17—Systems in which incident light is modified in accordance with the properties of the material investigated
- G01N21/47—Scattering, i.e. diffuse reflection
- G01N21/4795—Scattering, i.e. diffuse reflection spatially resolved investigating of object in scattering medium
-
- G—PHYSICS
- G06—COMPUTING; CALCULATING OR COUNTING
- G06T—IMAGE DATA PROCESSING OR GENERATION, IN GENERAL
- G06T2211/00—Image generation
- G06T2211/40—Computed tomography
- G06T2211/421—Filtered back projection [FBP]
-
- G—PHYSICS
- G06—COMPUTING; CALCULATING OR COUNTING
- G06T—IMAGE DATA PROCESSING OR GENERATION, IN GENERAL
- G06T2211/00—Image generation
- G06T2211/40—Computed tomography
- G06T2211/424—Iterative
Definitions
- the invention relates to a method of imaging an interior of a turbid medium, as defined in the pre-amble of Claim 1.
- the invention also relates to a device as defined in the pre-amble of Claim 6 for carrying out such a method.
- turbid medium a volume of a highly scattering substance, for example, an Intralipid solution or biological tissue. It may be possible to use the known method in medical diagnostics for imaging tumours in breast tissue.
- an iterative process is used for determining an image of the interior of the turbid medium from the measured intensities. In said iterative process, the measured intensities are compared with calculated intensities of a simulation model incorporating the light source, the interior of the turbid medium, and the detector.
- the turbid medium is represented as a set of volume elements with associated scattering and/or absorption coefficients in this simulation model. Furthermore, an error function is minimized in the iterative process, which function is determined by the calculated intensities and the measured intensities. The eventual values of the scattering and/or absorption coefficients of the volume elements may subsequently be represented in the form of an image of the interior.
- a disadvantage of the known method is that this method requires many iterative steps, and accordingly much calculation capacity. Consequently real time imaging is not possible.
- U.S. Patent No. 5,079, 698 to grenier discloses a transillumination method for the diagnosis of breast tumors, which normalizes an electronic image by modelling the illumination field of said image to compensate for the non-uniformity of the illumination field and then combining the moduled field with the original image.
- the first image is obtained by means of back projection of the determined values of the measured optical parameter.
- the first image is the blurred version of the second image because the image is convoluted with a normally occurring 1/r effect and a spatially varying convolution function.
- the normal 1/r effect occurs upon reconstruction of an object through back projection of measured intensities.
- the normal 1/r effect is negligible relative to the convolution function in the first instance because of the scattering and absorption in the turbid medium.
- the 1/r effects can be compensated for by applying a band limited filter.
- the invention is based on the recognition that a light path distribution function can be used for the description of the propagation of the light through the turbid medium.
- This light path distribution function is subsequently used for determining the convolution function with which the second image is convoluted. It follows from this light path distribution function that the most probable light paths of the light in a homogeneously turbid medium are present mainly within a banana-shaped space or tubular space between a light source and a detector.
- the light path distribution function is known inter alia from the article "Monte Carlo simulations of photon migration path distributions in multiple scattering media" by S. Feng et al., SPIE vol. 1988, pp. 78-88.
- the spatially varying parameters of the light path distribution function are determined from the determined optical parameters. Because the back projection and combination are linear operations the order of the back projection and the combination may be reversed.
- the first image is then formed by the determined intensity values. Further in this patent application with light is meant electro magnetic radiation with a wavelength between approximately 200 and 1000 nm.
- An embodiment of the method according to the invention is characterized in that the second image is determined by a deconvolution of the first image with the first spatially varying convolution function.
- One possibility to obtain a second image is to deconvolute the first image with the convolution function in the pseudo-time domain or space domain.
- Another embodiment of the method according to the invention is characterized in that the second image is determined by inverse Fourier transform of the quotient of the Fourier-transformed first image and the Fourier-transformed first spatially varying convolution function.
- An alternative for a deconvolution in the pseudo-time domain is an operation in the frequency or Fourier domain.
- the advantage of the Fourier domain is that the operations are relatively simple to implement.
- An embodiment of the method according to the invention is furthermore characterized by an iterative process in which an (n+1) th image is obtained by carrying out the following steps:
- the (n+1) th improved image can be determined by inverse Fourier-transform of the quotient of the Fourier-transformed n th image and the Fourier-transformed n th convolution.
- the (n+1) th improved image could be determined by a deconvolution of the n th image with the n th convolution function in the pseudo-time domain or space domain.
- An embodiment of the method according to the invention is characterized in that the method includes a step for non-linear coordinate transformation.
- This correction step can be applied when the difference in the attenuation coefficients of the turbid medium and the attenuation coefficient of an immersed object is large.
- the correction step compensates for bending of the light rays as a function of the distance from the object. It is remarked that this correction is known from A. Yariv, Quantum Electronics, p 107, 1975 and from H. Schomberg, An improved approach to reconstructive ultrasound tomography, Journal of Physics D., Vol 11, page, 1978. That correction is based on the eikonal equation of geometric optics.
- optical parameters are the attenuation coefficients.
- the advantage of using attenuation coefficients is that these attenuation coefficient are easy to obtain from the measured intensities and the known shortest length of a light path.
- other optical parameters such as, for example, absorption coefficients, scattering coefficients or diffusing coefficient could be used.
- An embodiment of the method according to the invention is characterized in that the method includes a step for reducing high-frequency noise components.
- high frequency noise components are introduced. These high frequency components could be reduce by a filtering with a low-pass filter.
- the filtering comprises, for example, the multiplication of a Fourier spectrum of the first image by the frequency response of a low-pass filter or convolution of the image with a two-dimensional impulse response of a low-pass filter.
- An embodiment of the method according to the invention is characterized in that the light paths are formed between one light source at a plurality of source positions and one detector at a plurality of detector positions.
- the turbid medium is irradiated with light from a light source that is consecutive replaced at a number of light source positions after carrying out a range of measurements with one detector at a number of detector positions.
- An embodiment of the method according to the invention is characterized in that the light paths are formed between one light source selected from a plurality of light sources located at a plurality of positions and detected by one detector selected from a plurality of detectors at a plurality of positions.
- This method has the advantage that all the light sources and detector could be in the same fixed mechanical positions relative to the turbid medium, so that mechanical positioning means are not necessary.
- An embodiment of the method according to the invention is characterized in that the light paths are formed between one light source at one position and the light is detector by a plurality of detectors at a plurality of positions.
- This method has the advantage that the number of light sources can be reduced. Mechanical means for positioning the turbid medium relative the light source and the detectors are necessary.
- An embodiment of the method according to the invention is characterized in that the light paths are formed between one selected light source out of a plurality of light sources at a plurality of locations and one detector at one position.
- the invention also relates to a device,as defined in Claim 6.
- Fig. 1 shows a measuring device 100 for carrying out measurements in a turbid medium in a measuring space 108.
- the measuring device 100 comprises a measuring light source 103 formed by an output window 104 of a first optical waveguide 105 which is optically coupled to a light source 120, for example a laser diode for generating light with a wavelength of 670 nm and an optical output power of 30 mW.
- the measuring light source 103 is fastened to a movable slide 102.
- the moveable slide is mounted on a platform 101.
- a detector 106 is furthermore arranged opposite the measuring light source 103 on the movable slide 102.
- the detector 106 is formed by the input window 107 of a second optical waveguide 113 which is optically coupled to an optical detector 121.
- the optical detector 121 is, for example, a photosensitive PIN diode or a photomultiplicator tube.
- a measuring space 108 in which the turbid medium or biological tissue may be placed is present between the measuring light source 103 and the detector 106.
- the diameter of the measuring space 108 is, for example, 100 mm.
- the optical waveguides may be, for example, optical fibres, but an alternative possibility is formed by geometric-optical systems provided with, for example, lenses and mirrors.
- the movable slide 102 can be set for a number of measuring positions by means of a motor unit 112 which is coupled to a control unit 122. The number of measuring positions lies, for example, between 16 and 256.
- the control unit 122 will generate a control signal for the light source 120, so that light is generated in the light source 120.
- the light of the light source is guided through the first optical waveguide 105 and the output window into the turbid medium in the measuring space 108.
- the turbid medium comprises. for example, a 1% Intralipid solution in which solution a Delrin cylinder with a radius of 5 mm is immersed.
- the detector 106 receives a portion of the light transported through the turbid medium in the measuring space 108, and the received light is guided through the second optical waveguide 113 towards the optical detector 121.
- the optical detector 121 converts the light received into a detector signal.
- the detector signal is transported to an analog-digital converter 123 via an electrical conductor 127.
- the detector signal is converted into a digital value I in the analog-digital converter.
- the digital intensity value I is subsequently passed on to the reconstruction unit 125 through a data bus 128.
- Data processing takes place in the reconstruction unit 125.
- the result of the data processing is shown on a monitor 126 in the form of an image, or is stored in a data storage unit 124.
- the intensities in M positions are measured in a first direction by means of the detector in a first step, for example, in the X-direction of all orthogonal system of coordinates , and stored in a first data table X(i).
- the origin of the orthogonal system of coordinates is located at the centre of the measurement space 108.
- the intensities are measured in N positions in a second direction, for example the Y-direction of the orthogonal system of coordinates.
- the number of positions in each direction may lie, for example, between 16 and 256. A practical choice will often be 32.
- the slide is rotated approximately 90° relative to the turbid medium in the measuring space 108 present between the measuring light source 103 and the detector 106 for measuring in the second direction.
- the measured intensity values belonging to the second direction are subsequently stored by the reconstruction unit 125 in a second table Y(j).
- the attenuation coefficient also other optical parameters could be determined, for example, the absorption coefficient, the scattering coefficient or diffuse distance. In addition to this it is also possible to determine differences of the mentioned optical parameters obtained with two consecutive measurements performed with different wavelengths.
- a first image of the interior of the turbid medium is calculated from the first table K x (i) and the second table K y (j) by means of back projection.
- This technique is known for example from computer tomography and described in inter alia "Fundamentals of Image Processing" by A.K. Jain, Prentice Hall, 1989, pp 439-441.
- the first image is then described by an M x N matrix.
- the first image may be displayed on the monitor 126.
- the determined attenuation coefficients of the table K x (i) and table K y (j) serve as a starting point for determining the first image.
- the light path distribution function ⁇ (r) between a detector in position d owing to a point-shaped absorbing particle in location r between a light source and the detector in the turbid medium is then given by wherein r is the distance from a random position of an object to an origin of a system of polar coordinates, r s the distance from the light source to the origin of the system of coordinates, r d the distance from the detector to the origin of the system of coordinates, and K is the attenuation coefficient.
- K is the attenuation coefficient.
- ⁇ a is the absorption coefficient and ⁇ s ' the scattering coefficient
- L a is the diffuse light penetration depth
- D the diffusion coefficient of the turbid medium.
- This expression represents the widening of a light path distribution function between a light source and a detector point, given a fixed distance between the light source and the detector, and gives the shape of the convolution function with which the object, i.e. the second image, was convoluted.
- An example of a banana-shaped light path distribution function is shown in Fig. 2.
- Fig. 2 shows the contours of a light path distribution function for the value P(0.5) in a homogeneously turbid medium with a value 0.05 mm -1 for the attenuation coefficient and a value of 100 mm for the source detector distance.
- the value P(0.5) indicated that half of the total number photons injected in the turbid medium by the source S will propagate through the turbid medium along a path that will lie in the enclosed area of the banana shape curve. For a turbid medium with a higher attenuation coefficient this banana shape will have a narrower shape and for turbid medium with a smaller attenuation coefficient this banana shape will have a broader shape.
- the applied attenuation coefficient of the banana-shaped intensity function (3) is subsequently estimated from the determined attenuation coefficients K x (i) and K y (j) through a calculation of the average value of all elements K(i) and K(j), thus:
- the maximum value of the attenuation coefficients K x (i) and K y (j) is used.
- Highly non linear object are objects with an attenuation coefficient that is approximately 50 times the attenuation coefficient of the turbid medium, in which the object is immersed.
- the first spatially varying convolution function is estimated after the first image is back-projected from the attenuation values.
- the centre of gravity of a recognizable object is estimated from the first image or otherwise available from a priori knowledge.
- This first convolution function is in principle dependent on the distances of the object to the light source and on the distance of the object to the detector. Therefore it is a spatially varying convolution function.
- the reconstruction of the second image may also be carried out in alternative manners, for example through deconvolution in the pseudo-time domain or space domain of the image with a convolution function.
- a rapid method of determining the first image is obtained, for example, in the case the area of interest is not too close to the light source or detector. In that case the following steps are carried out in the projection domain:
- a further improvement of the image according to the method of the invention can be achieved by means of a non linear coordinate transformation and a next deconvolution step by applying a priori knowledge, e.g. when the difference between the attenuation coefficient of an immersed object and the attenuation coefficient of the surrounding turbid medium is large, for example more then 50 times.
- the non-linear coordinate transform will be explained with reference to Fig. 8.
- a line 800 is shown that represents the attenuation values along a centre line of the image K 2 (i,j) of an object immersed in a turbid medium.
- This centre line 800 is directed into the direction of the first coordinate axis, for example the X-axis.
- the attenuation values along the centre line are represented by a function S(x).
- a second derivative S 2 (x) of this function S(x) to the x variable is obtained.
- the second derivative S 2 (x) is represented in Fig. 8 by he line 801.
- a non-linear coordinate transformation is performed on the first coordinate axis.
- the dotted line 802 represents the approximated function S 2 '(x).
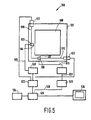
- FIG. 3 shows the measuring light source 303 which is fastened to a first ring 309, and a detector 306 which is placed on a second ring 310.
- the first ring 309 and the second ring 310 are rotatable relative to one another and are fastened to a platform 301.
- the measuring light source 303 on the first ring 309 and the detector on the second ring 310 are so fastened relative to one another that the output window 304 of the measuring light source and the input window 307 of the detector 306 lie substantially in one plane.
- the positions of the measuring light source 303 and of the detector 306 are independently adjustable by means of the motor unit 312.
- the motor unit 312 is mechanically coupled the first ring 309 and the second ring 310.
- the first ring 309 and the second ring 310 can be set for a number of measuring positions by means of the motor unit 312 which is coupled to a control unit 322.
- the number of measuring positions lies, for example, between 16 and 256.
- a measuring space 308 is present in the centre of the first ring 309 and the second ring 310. In this measuring space 308 it is possible to place, for example, a turbid medium containing an object or biological tissue.
- the diameter of the measuring space is, for example, 100 mm.
- the control unit 322 will generate a control signal for the light source 320, so that light is generated in the light source 320.
- the light of the light source is guided through the first optical waveguide 305 and the output window 304 into the turbid medium in the measuring space 308.
- the detector 306 receives a portion of the light transported through the turbid medium in the measuring space 108, and the received light is guided through the second optical waveguide 313 towards the optical detector 321.
- the optical detector 321 converts the light received into a detector signal.
- the detector signal is transported to an analog-digital converter 323 via an electrical conductor 327.
- the detector signal is converted into a digital value I in the analog-digital converter.
- the digital intensity value I is subsequently passed on to the reconstruction unit 325 through a data bus 328.
- Data processing takes place in the reconstruction unit 325.
- the result of the data processing is shown on a monitor 326 in the form of an image, or is stored in a data storage unit 324.
- the following steps are performed for imaging the object in the turbid medium by a second embodiment of the method according to the invention.
- the intensities of the light transported through the turbid medium or the biological tissue are measured consecutively for a first number of M positions of the measuring light source 303, with the detector 306 in a second number of N positions.
- the measuring light source 303 is first set in a chosen position by means of the first ring 309 and motor unit 312.
- the detector position is then rotated through an angle of 360/N° consecutively for each measurement by means of the control unit 322 and the second ring 310.
- the first ring 309 is rotated through 360/M degrees and again M measurement are carried out.
- the intensity values measured are stored in a table R m (i) by the reconstruction unit 325.
- M data tables R m of N elements each will be available.
- a first image K 1 (i,j) is determined from the attenuation tables R m (K i ) by means of a fan beam back projection.
- the fan beam back projection is known from inter alia "Fundamentals of Image Processing" by A.K. Jain, Prentice Hall, 1989, pp 464-465.
- a first convolution function is determined from the determined attenuation coefficient table R m (K i ), but since the distance between the measuring light source 303 and the detector 306 is different now for the various positions of the detector 306 relative to the measuring light source 303, the width of the banana-shaped light path distribution function may be different for each position of the measuring light source 303 and the detector 306.
- the first convolution function G 1 (i,j) is now calculated in that an element of the first convolution function G 1 (i,j) is calculated from the starting point that the attenuation coefficients belonging to the light paths L s,d between the M measuring light source positions and N detector positions for each element (i,j) multiplied with the probability that the light will pass a point i,j in an orthogonal two-dimensional space containing the source and detector positions, by means of the relation: wherein P q,r (i,j) is the light path distribution function between a measuring light source position S q and a detector position D I , which light path distribution function is influenced by a infinitesimal small absorbing particle at location i,j. Where P q,r (i,j) can be derived from equation (2). This calculation of the attenuation coefficient related to an element i,j is illustrated with reference to Fig 4.
- Fig. 4 shows two measuring light sources at locations S q1 and S q2 and two detectors at locations D r1 and D r2 , both detector and measuring light source locations are placed at a circle 400. Further an array of points P i,j , for example a 5x5 array 401, is located within the circle 400. Each point i,j of the array 401 corresponds with the element i,j of a convolution matrix I.
- the attenuation coefficient corresponding to the element i,j of the first convolution function is now given by the summation of the attenuation coefficients of the light path distributions between all the possible measuring light source and detector light paths multiplied by the probability that a light path will pass the point P i,j .
- K( i , j ) K q1,r1 P q1,r1 ( i,j )+K q2,r2 P q2,r2 ( i,j )+K q1,r2 P q1,r2 ( i,j )+K q2,r1 P q2,r1 ( i,j ) P q1,r1 ( i,j )+ P q2,r2 ( i,j )+ P q1,r2 ( i,j )+ P q2,r1 ( i,j ) wherein P q,r (i,j) is given by equation
- Fig. 5 shows a measuring device 500 comprising a first slide 509 for the measuring light source 503, a second slide 510 for a detector 506, the two slides enclosing an angle ⁇ with one another of, for example, 90°.
- the first slide 509 and the second slide 510 are also moveable relative to one another and are mounted at a platform 501.
- the measuring light source 503 and the detector 506 on the first slide 509 and the second slide 510 are so fastened relative to one another that the output window 504 of the measuring light source 503 and the input window 507 of the detector 506 lie substantially in one plane.
- the positions of the measuring light source 503 and of the detector 506 are independently adjustable by means of the motor unit 512.
- the first slide 509 and the second slide 510 can be set for a number of measuring positions by means of a motor unit 512 which is coupled to a control unit 522.
- the number of measuring positions lies, for example, between 16 and 256.
- a measuring space 508 is present between the first slide 509 and the second slide 510. In this measuring space 508 it is possible to place, for example, a turbid medium or biological tissue.
- the diameter of the measuring space is, for example, 100 mm.
- the control unit 522 will generate a control signal for the light source 520, so that light is generated in the light source 520.
- the light of the light source is guided through the first optical waveguide 505 and the output window 504 into the turbid medium in the measuring space 508.
- the detector 506 receives a portion of the light transported through the turbid medium in the measuring space 508, and the received light is guided through the second optical waveguide 513 towards the optical detector 521.
- the optical detector 521 converts the light received into a detector signal.
- the detector signal is transported to an analog-digital converter 523 via an electrical conductor 527.
- the detector signal is converted into a digital value I in the analog-digital converter.
- the digital intensity value I is subsequently passed on to the reconstruction unit 525 through a data bus 528.
- Data processing takes place in the reconstruction unit 525.
- the result of the data processing is shown on a monitor 526 in the form of an image, or is stored in a data storage unit 524.
- G 1 (i,j) is calculated again for each element (i,j) in an orthogonal two-dimensional space from the attenuation coefficients belonging to the light paths L s.d between the M measuring light source positions and the N detector positions by means of the summation (7).
- These attenuation coefficients directly determines the first convolution function G 1 (i,j), with which the second image was convoluted.
- a second image is reconstructed in that the following sub-steps are carried out in the frequency domain:
- measuring devices may alternatively be used which comprise one measuring light source and a plurality of detectors.
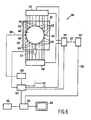
- Fig. 6 shows a measuring device 600 , comprising a measuring light source 603 and a number of detectors 606 placed at equal distances at a circle on a platform 601.
- the detectors 606 are, for example, PIN-photodiodes.
- the turbid medium in the measuring space 608 is placed at a table 602 located in the centre of the circle into the platform 601.
- the table 602 can be rotated in a number of angular positions with relation the light source 603 by means of a motor unit 612.
- the number of angular positions may vary between 16 and 256 positions, for example 32 positions.
- the motor unit 612 is controlled by a control unit 622. Further the control unit 622 selects one out of the N detectors 606 by controlling the selection devices 610 by the selection signals 611, wherein the number of detectors N has a value between 16 and 64, for example 32. As a result of this selection a intensity signal 613 that represents the value of the intensity on the selected detector 606 is supplied to the AD converter 623. For carrying out an intensity measurement the control unit 622 generates a control signal for the light source 620, so that light is generated in the light source 620.
- the light of the light source 620 is guided to a first optical wave guide 605 and the output window 604 into the turbid medium in the measuring space 608.
- the detectors 606 receive a portion of the light propagated through the turbid medium in the measuring space 608.
- the detectors 606 convert the received light into detector signals.
- the detector signal are passed to selection devices 610.
- the control unit 622 selects alternately one out of all the detector signals by means of the selection devices 610 by generating selection signals 611.
- the selected detector signal is passed to an AD-converter 623 by the electrical conductor 627. This AD-converter 623 converts the detector signal to a digital intensity value I.
- the digital intensity value I is subsequently passed on to the reconstruction unit 625 through a data bus 628.
- the measured intensities are then stored in an intensity table P m (i) in the reconstruction unit 625.
- P m (i) After measurement of all the intensities of the detectors in one position the table is rotated to a next angular position, which is rotated an angle 360/M towards the former angular position, wherein M is the number of angular positions of the table that are measured for a complete measurement of the turbid medium.
- M is the number of angular positions of the table that are measured for a complete measurement of the turbid medium.
- a table of MxN intensities is available for further processing and reconsuuction in the reconstruction unit 625.
- the further processing is similar with the processing steps as described in the description of Fig. 2.
- the image could be displayed on a monitor 626 or stored at storage unit 624.
- FIG. 7 shows a another measuring device 700, which measuring device comprises a plurality M of measuring light sources 703 and a plurality N of detectors 706 placed at equal distances at a circle on a platform 701 around an turbid medium place in a measuring space 708.
- the light sources 703 comprise, for example, a light emitting diode and the detectors comprise, for example, a PIN photodiode.
- the control unit 722 selects one measuring light source 703 out of the M measuring light sources 703 by means of light source selection devices 713 and one detector out of the N detectors by means of detector selection devices 710 by generating of a light source selection signal 712 and a detector selection signal 711.
- the selected detector signal is passed to an AD-converter 723 by the electrical conductor 727.
- This AD-convener 723 converts the detector signal to a digital intensity value I.
- the digital intensity value I is subsequently passed on to the reconstruction unit 725 through a data bus 728.
- the result of an intensity measurement of a selected measuring light source 703 by consecutive selected detectors 706 is stored in a table P m (i) of intensity values in the reconstruction unit 725.
- the complete measurements from all possible measuring light sources results in an array of P(i,j) intensity values.
- This intensity array P(i,j) is available for further processing in the reconstruction unit 725.
- After reconstruction an image can be displayed on the monitor 726 or stored in a storage unit 724.
- the method of processing is similar as the method as described in the description of Fig. 2
Description
One possibility to obtain a second image is to deconvolute the first image with the convolution function in the pseudo-time domain or space domain.
the light paths are formed between one light source at one position and the light is detector by a plurality of detectors at a plurality of positions. This method has the advantage that the number of light sources can be reduced. Mechanical means for positioning the turbid medium relative the light source and the detectors are necessary.
the light paths are formed between one selected light source out of a plurality of light sources at a plurality of locations and one detector at one position.


F{K1(i,j)} = F{K2(i,j)}.F{G1(i,j)} so that the Fourier-transformed second image is equal to:
F{K2(i,j)} = F{K1(i,j)}/F{G1(i,j)}. The reconstruction of the second image may also be carried out in alternative manners, for example through deconvolution in the pseudo-time domain or space domain of the image with a convolution function.
and the table Ky2(j).

This calculation of the attenuation coefficient related to an element i,j is illustrated with reference to Fig 4.
In a next step, after determination of the first convolution function, a first image is reconstructed in that the following sub-steps are carried out in the frequency domain:
followed by
Claims (6)
- A method of imaging an interior of a turbid medium, in which method the following steps are performed:a. consecutive irradiation of the turbid medium with light from a light source from a plurality of positions and detection of the light propagated along a plurality of light paths through the turbid medium,b. determination of an image of the interior of the turbid medium from the measured intensities,c. determination of optical parameters from the measured intensities,d. determination of a first image of the interior of the determined optical parameters by means of a back projection,
characterised in that the following sub-steps are carried out for determining the image of the object:e. determination of a first spatially varying convolution function from the optical parameters,the spatially varying convolution function representing a banana-shaped or tubular shaped light-path distribution in a homogeneous turbid medium,f. determination of a second improved image of the interior of the turbid medium by a deconvolution of the first image with the first spatially varying convolution function. - A method as claimed in Claim 1, characterised in that the following steps are carried out for obtaining an (n+1)th improved image in an iterative process, whereina. an (n+1)th spatially varying convolution function is determined from the n-th mage and its optical parameters, andb. an (n+1)th-image of the object is determined by a deconvolution of the nth image with the n-th spatially varying convolution function.
- A method as claimed in Claim 1, characterised in that the method includes a non-linear co-ordinate transformation that is applied to the first image.
- A method as claimed in Claim 1, characterised in that the optical parameters are attenuation coefficients, scatter coefficients or diffusing coefficients.
- A method as claimed in Claim 1, characterised in that the method includes a low-pass filter step for reducing high-frequency noise components in the first image.
- A device for imaging an interior of a turbid medium, which is provided withequipped for carrying out the substeps ofa light source for irradiating the turbid medium,a detector for measuring light intensities from light propagated through the turbid medium,the light source being arranged for consecutive irradiation of the turbid medium with light from a light source from a plurality of positions and detection of the light propagated along a plurality of light paths through the turbid medium,a reconstruction unit for determination of an image of the interior of the turbid medium from the measured intensities,characterised in that the reconstruction unit is equipped for carrying out the following additional substeps :i. determination of optical parameters from the measured intensities,ii. determination of a first image of the interior of the determined optical parameters by means of a back projection,iii. determination of a first spatially varying convolution function from the optical parameters,iv. the spatially varying convolution function representing a banana-shaped or tubular shaped light-path distribution in a homogeneous turbid medium,v. determination of a second improved image of the interior of the turbid medium by a deconvolution of the first image with the first spatially varying convolution function.
Priority Applications (1)
| Application Number | Priority Date | Filing Date | Title |
|---|---|---|---|
| EP96927152A EP0791207B1 (en) | 1995-09-11 | 1996-08-29 | Method and device for imaging the interior of a turbid medium |
Applications Claiming Priority (4)
| Application Number | Priority Date | Filing Date | Title |
|---|---|---|---|
| EP95202456 | 1995-09-11 | ||
| EP95202456 | 1995-09-11 | ||
| EP96927152A EP0791207B1 (en) | 1995-09-11 | 1996-08-29 | Method and device for imaging the interior of a turbid medium |
| PCT/IB1996/000870 WO1997010568A1 (en) | 1995-09-11 | 1996-08-29 | Method and device for imaging the interior of a turbid medium |
Publications (2)
| Publication Number | Publication Date |
|---|---|
| EP0791207A1 EP0791207A1 (en) | 1997-08-27 |
| EP0791207B1 true EP0791207B1 (en) | 2001-11-07 |
Family
ID=8220625
Family Applications (1)
| Application Number | Title | Priority Date | Filing Date |
|---|---|---|---|
| EP96927152A Expired - Lifetime EP0791207B1 (en) | 1995-09-11 | 1996-08-29 | Method and device for imaging the interior of a turbid medium |
Country Status (6)
| Country | Link |
|---|---|
| US (1) | US5719398A (en) |
| EP (1) | EP0791207B1 (en) |
| JP (1) | JP4376317B2 (en) |
| CN (1) | CN1096658C (en) |
| DE (1) | DE69616743T2 (en) |
| WO (1) | WO1997010568A1 (en) |
Families Citing this family (23)
| Publication number | Priority date | Publication date | Assignee | Title |
|---|---|---|---|---|
| WO1998007021A1 (en) * | 1996-08-14 | 1998-02-19 | Philips Electronics N.V. | Device for and method of forming an image of a turbid medium |
| US6100520A (en) * | 1996-11-29 | 2000-08-08 | Imaging Diagnostic Systems, Inc. | Detector array for use in a laser imaging apparatus |
| US6150649A (en) * | 1996-11-29 | 2000-11-21 | Imaging Diagnostic Systems, Inc. | Detector array with variable gain amplifiers for use in a laser imaging apparatus |
| ATE271829T1 (en) * | 1996-11-29 | 2004-08-15 | Imaging Diagnostic Systems Inc | METHOD FOR IMAGING A BODY BY SCANNING BY A LASER IMAGING DEVICE |
| EP1006866A1 (en) | 1996-11-29 | 2000-06-14 | Imaging Diagnostic Systems, Inc. | Detector array for use in a laser imaging apparatus |
| WO1998024361A2 (en) * | 1996-12-03 | 1998-06-11 | Koninklijke Philips Electronics N.V. | Method and apparatus for imaging an interior of a turbid medium |
| JP4166282B2 (en) * | 1997-05-09 | 2008-10-15 | コーニンクレッカ フィリップス エレクトロニクス エヌ ヴィ | Device for positioning an object in a turbid medium |
| EP1034417A4 (en) | 1997-11-26 | 2005-07-06 | Imaging Diagnostic Systems Inc | Time-resolved breast imaging device |
| EP1030591B1 (en) * | 1998-06-25 | 2008-10-22 | Koninklijke Philips Electronics N.V. | Method of localizing an object in a turbid medium |
| US6332093B1 (en) | 1998-08-06 | 2001-12-18 | Art Recherches Et Technologies Avancees Inc./Art Advanced Research Technologies, Inc. | Scanning module for imaging through scattering media |
| AU4058999A (en) * | 1999-06-03 | 2000-12-28 | Hamamatsu Photonics K.K. | Optical ct device and method of image reformation |
| ATE422325T1 (en) * | 2000-03-31 | 2009-02-15 | Koninkl Philips Electronics Nv | METHOD AND DEVICE FOR LOCALIZING A DIFFERENT AREA IN A TURBID MEDIUM |
| US6529770B1 (en) | 2000-11-17 | 2003-03-04 | Valentin Grimblatov | Method and apparatus for imaging cardiovascular surfaces through blood |
| US7806827B2 (en) * | 2003-03-11 | 2010-10-05 | General Electric Company | Ultrasound breast screening device |
| JP4595330B2 (en) * | 2004-01-19 | 2010-12-08 | ソニー株式会社 | Image processing apparatus and method, recording medium, and program |
| WO2007057806A2 (en) * | 2005-11-18 | 2007-05-24 | Koninklijke Philips Electronics N.V. | Device for imaging an interior of a turbid medium |
| CN101404925A (en) * | 2006-03-17 | 2009-04-08 | 皇家飞利浦电子股份有限公司 | A device for imaging a turbid medium |
| JP4821850B2 (en) * | 2006-03-31 | 2011-11-24 | 株式会社島津製作所 | Mammography equipment |
| JP4808584B2 (en) * | 2006-10-18 | 2011-11-02 | 浜松ホトニクス株式会社 | Mammography device |
| EP1943941A1 (en) * | 2006-12-21 | 2008-07-16 | Koninklijke Philips Electronics N.V. | Method for optically imaging an interior of a turbid medium, method for reconstructing an image of an interior of a turbid medium, device for imaging an interior of a turbid medium, medical image acquisition device and computer program products for use in said methods and devices |
| CN101902952B (en) * | 2007-12-17 | 2014-10-29 | 皇家飞利浦电子股份有限公司 | Method for detecting the presence of inhomogeneities in an interior of a turbid medium and device for imaging the interior of turbid media |
| CN103057261A (en) * | 2011-10-24 | 2013-04-24 | 致伸科技股份有限公司 | Control method and control device used for edge detection device |
| TWI605845B (en) * | 2016-12-21 | 2017-11-21 | 財團法人工業技術研究院 | Drug monitoring device for intravenous infusion and method thereof |
Family Cites Families (3)
| Publication number | Priority date | Publication date | Assignee | Title |
|---|---|---|---|---|
| US5079698A (en) * | 1989-05-03 | 1992-01-07 | Advanced Light Imaging Technologies Ltd. | Transillumination method apparatus for the diagnosis of breast tumors and other breast lesions by normalization of an electronic image of the breast |
| US5070455A (en) * | 1989-11-22 | 1991-12-03 | Singer Imaging, Inc. | Imaging system and method using scattered and diffused radiation |
| US5396285A (en) * | 1993-05-07 | 1995-03-07 | Acuson Corporation | Ultrasound imaging method and apparatus with dynamic non-linear filtering |
-
1996
- 1996-08-29 WO PCT/IB1996/000870 patent/WO1997010568A1/en active IP Right Grant
- 1996-08-29 CN CN96191327A patent/CN1096658C/en not_active Expired - Lifetime
- 1996-08-29 DE DE69616743T patent/DE69616743T2/en not_active Expired - Lifetime
- 1996-08-29 JP JP51178097A patent/JP4376317B2/en not_active Expired - Lifetime
- 1996-08-29 EP EP96927152A patent/EP0791207B1/en not_active Expired - Lifetime
- 1996-09-11 US US08/712,029 patent/US5719398A/en not_active Expired - Lifetime
Non-Patent Citations (1)
| Title |
|---|
| JAIN A. K.: "fundamentals of image processing", 1989, PRENTICE-HALL * |
Also Published As
| Publication number | Publication date |
|---|---|
| JPH10509243A (en) | 1998-09-08 |
| CN1096658C (en) | 2002-12-18 |
| DE69616743T2 (en) | 2002-07-25 |
| EP0791207A1 (en) | 1997-08-27 |
| DE69616743D1 (en) | 2001-12-13 |
| JP4376317B2 (en) | 2009-12-02 |
| WO1997010568A1 (en) | 1997-03-20 |
| CN1167537A (en) | 1997-12-10 |
| US5719398A (en) | 1998-02-17 |
Similar Documents
| Publication | Publication Date | Title |
|---|---|---|
| EP0791207B1 (en) | Method and device for imaging the interior of a turbid medium | |
| EP1593095B1 (en) | Method and system for free space optical tomography of diffuse media | |
| Eda et al. | Multichannel time-resolved optical tomographic imaging system | |
| Chaudhari et al. | Hyperspectral and multispectral bioluminescence optical tomography for small animal imaging | |
| Colak et al. | Tomographic image reconstruction from optical projections in light-diffusing media | |
| US6064073A (en) | Method of localizing an object in a turbid medium | |
| US5903357A (en) | Method and apparatus for imaging an interior of a turbid medium | |
| US5762607A (en) | Emission tomography system and method using direct reconstruction of scattered radiation | |
| JPH11514096A (en) | Apparatus and method for forming an image of a turbid medium | |
| US5832922A (en) | Diffusion Tomography system and method using direct reconstruction of scattered radiation | |
| US5747810A (en) | Simultaneous absorption and diffusion tomography system and method using direct reconstruction of scattered radiation | |
| Konovalov et al. | Reconstruction of fluorophore absorption and fluorescence lifetime using early photon mesoscopic fluorescence molecular tomography: a phantom study | |
| CN113331788B (en) | MFMT-XCT dual-mode system | |
| US5787888A (en) | Absorption tomography system and method using direct reconstruction of scattered radiation | |
| JP2001510361A (en) | Method and apparatus for imaging the interior of a turbid medium | |
| Ren et al. | High-resolution tomographic reconstruction of optical absorbance through scattering media using neural fields | |
| Yao et al. | Simultaneous reconstruction of absorption and scattering distributions in turbid media using a Born iterative method | |
| Matson | Diffraction tomography for turbid media | |
| WO2023007496A1 (en) | Method and system for high photon energies imaging | |
| Brukilacchio et al. | Characterization of the point spread function for diffuse optical tomographic imaging and the effect of noise on resolution | |
| Behrooz | Multiplexed fluorescence diffuse optical tomography | |
| Pogue et al. | Frequency-domain diffuse optical tomography of breast tissue: detector size and imaging geometry | |
| Granquist-Fraser | Monte Carlo estimation of spatial resolution of optical imaging in visual cortex and consequences for measurement of cortical functional architecture | |
| Schotland | Inversion formula for diffusion imaging in an absorbing medium | |
| EP0871862A1 (en) | Diffusion imaging using direct reconstruction of scattered radiation |
Legal Events
| Date | Code | Title | Description |
|---|---|---|---|
| PUAI | Public reference made under article 153(3) epc to a published international application that has entered the european phase |
Free format text: ORIGINAL CODE: 0009012 |
|
| AK | Designated contracting states |
Kind code of ref document: A1 Designated state(s): DE FR GB NL |
|
| 17P | Request for examination filed |
Effective date: 19970922 |
|
| 17Q | First examination report despatched |
Effective date: 20000724 |
|
| GRAG | Despatch of communication of intention to grant |
Free format text: ORIGINAL CODE: EPIDOS AGRA |
|
| GRAG | Despatch of communication of intention to grant |
Free format text: ORIGINAL CODE: EPIDOS AGRA |
|
| GRAH | Despatch of communication of intention to grant a patent |
Free format text: ORIGINAL CODE: EPIDOS IGRA |
|
| GRAH | Despatch of communication of intention to grant a patent |
Free format text: ORIGINAL CODE: EPIDOS IGRA |
|
| GRAA | (expected) grant |
Free format text: ORIGINAL CODE: 0009210 |
|
| AK | Designated contracting states |
Kind code of ref document: B1 Designated state(s): DE FR GB NL |
|
| PG25 | Lapsed in a contracting state [announced via postgrant information from national office to epo] |
Ref country code: NL Free format text: LAPSE BECAUSE OF FAILURE TO SUBMIT A TRANSLATION OF THE DESCRIPTION OR TO PAY THE FEE WITHIN THE PRESCRIBED TIME-LIMIT Effective date: 20011107 |
|
| REF | Corresponds to: |
Ref document number: 69616743 Country of ref document: DE Date of ref document: 20011213 |
|
| REG | Reference to a national code |
Ref country code: GB Ref legal event code: IF02 |
|
| ET | Fr: translation filed | ||
| NLV1 | Nl: lapsed or annulled due to failure to fulfill the requirements of art. 29p and 29m of the patents act | ||
| PLBE | No opposition filed within time limit |
Free format text: ORIGINAL CODE: 0009261 |
|
| STAA | Information on the status of an ep patent application or granted ep patent |
Free format text: STATUS: NO OPPOSITION FILED WITHIN TIME LIMIT |
|
| 26N | No opposition filed | ||
| REG | Reference to a national code |
Ref country code: GB Ref legal event code: 746 Effective date: 20030324 |
|
| REG | Reference to a national code |
Ref country code: FR Ref legal event code: D6 |
|
| REG | Reference to a national code |
Ref country code: DE Ref legal event code: R081 Ref document number: 69616743 Country of ref document: DE Owner name: KONINKLIJKE PHILIPS N.V., NL Free format text: FORMER OWNER: KONINKLIJKE PHILIPS ELECTRONICS N.V., EINDHOVEN, NL Effective date: 20140328 |
|
| REG | Reference to a national code |
Ref country code: FR Ref legal event code: CD Owner name: KONINKLIJKE PHILIPS N.V., NL Effective date: 20141126 Ref country code: FR Ref legal event code: CA Effective date: 20141126 |
|
| REG | Reference to a national code |
Ref country code: FR Ref legal event code: PLFP Year of fee payment: 20 |
|
| PGFP | Annual fee paid to national office [announced via postgrant information from national office to epo] |
Ref country code: GB Payment date: 20150901 Year of fee payment: 20 |
|
| PGFP | Annual fee paid to national office [announced via postgrant information from national office to epo] |
Ref country code: FR Payment date: 20150831 Year of fee payment: 20 |
|
| PGFP | Annual fee paid to national office [announced via postgrant information from national office to epo] |
Ref country code: DE Payment date: 20151029 Year of fee payment: 20 |
|
| REG | Reference to a national code |
Ref country code: DE Ref legal event code: R071 Ref document number: 69616743 Country of ref document: DE |
|
| REG | Reference to a national code |
Ref country code: GB Ref legal event code: PE20 Expiry date: 20160828 |
|
| PG25 | Lapsed in a contracting state [announced via postgrant information from national office to epo] |
Ref country code: GB Free format text: LAPSE BECAUSE OF EXPIRATION OF PROTECTION Effective date: 20160828 |