EP0816863A2 - A wide band video denoiser and method for denoising - Google Patents
A wide band video denoiser and method for denoising Download PDFInfo
- Publication number
- EP0816863A2 EP0816863A2 EP97304809A EP97304809A EP0816863A2 EP 0816863 A2 EP0816863 A2 EP 0816863A2 EP 97304809 A EP97304809 A EP 97304809A EP 97304809 A EP97304809 A EP 97304809A EP 0816863 A2 EP0816863 A2 EP 0816863A2
- Authority
- EP
- European Patent Office
- Prior art keywords
- level
- coefficients
- signal
- coefficient
- correlation coefficients
- Prior art date
- Legal status (The legal status is an assumption and is not a legal conclusion. Google has not performed a legal analysis and makes no representation as to the accuracy of the status listed.)
- Granted
Links
Images


Classifications
-
- G—PHYSICS
- G01—MEASURING; TESTING
- G01S—RADIO DIRECTION-FINDING; RADIO NAVIGATION; DETERMINING DISTANCE OR VELOCITY BY USE OF RADIO WAVES; LOCATING OR PRESENCE-DETECTING BY USE OF THE REFLECTION OR RERADIATION OF RADIO WAVES; ANALOGOUS ARRANGEMENTS USING OTHER WAVES
- G01S7/00—Details of systems according to groups G01S13/00, G01S15/00, G01S17/00
- G01S7/02—Details of systems according to groups G01S13/00, G01S15/00, G01S17/00 of systems according to group G01S13/00
- G01S7/021—Auxiliary means for detecting or identifying radar signals or the like, e.g. radar jamming signals
Definitions
- the present invention relates to the field of signal processing technology. More specifically, the present invention relates to the field of signal processing technology for efficient signal representation and reproduction using wavelet transformations.
- Radar warning receivers receive and process signal pulses found within an input wide band signal.
- the performance of RWRs, and other devices used for signal detection and feature extraction purposes, is often measured by charting Receiver Operating Characteristic curves (ROC curves) in which the system's performance in Probability of Detection (POD) vs. the False Alarm Rate (FAR) is plotted and compared.
- ROC curves Receiver Operating Characteristic curves
- An RWR system can have a higher probability of signal detection at a lower false alarm rate if the system's signal to noise ratio (SNR) at the detection point is improved (e.g., it has a higher operating sensitivity). Therefore, it is a great advantage for RWR systems to reduce the noise content of the incoming signal relative to the signal content of the detected pulses.
- SNR signal to noise ratio
- RWRs For RWRs, higher operating sensitivity translates into increased range of detection, improved accuracy and increased precision for time of arrival (TOA), angle of arrival (AOA), pulse width (PW) measurement, and peak amplitude measurements of the input signal.
- TOA time of arrival
- AOA angle of arrival
- PW pulse width
- An overall gain in RWR system operating sensitivity also translates into reduced vulnerability for the carrier which hosts the RWR; the above being the ultimate goal of such a system.
- the present invention RWR system offers a system for significantly reducing the noise content of an incoming RWR signal relative to the content of signal pulses desired for detection (e.g., operates with an increased signal to noise ratio).
- the present invention offers a significant increase of overall RWR system sensitivity and range of detection.
- the present invention offers a denoising system that can be retrofitted into existing RWR designs to allow effective denoising while not substantially altering other aspects of downstream processing performed by the RWR systems.
- a method and apparatus are described for high speed denoising of an input wide band signal received by a radar warning receiver (RWR) system.
- the system of the present invention digitizes the input signal into sample windows each having a number of sample data points (x).
- the present invention includes a signal transformation processor system which convolves Haar wavelet basis functions across individual time segments of the input signal to produce sets of correlation coefficients. Signal noise is poorly represented by the selected Haar wavelet basis functions while expected pulse signal characteristics are well represented by the basis functions.
- a plurality (n) of frequency resolution levels are simultaneously determined, each frequency resolution level having a fixed number of correlation coefficients (x) corresponding to the number of sample points in a sample window.
- Each coefficient also corresponds to a different basis function, or a same basis function applied to an individual time segment.
- Each level contains a different number of represented frequency bands and different number of time segments per frequency band. Therefore, each level provides different frequency/time resolution.
- the coefficients are sorted into a coefficient map by magnitude order.
- a thresholding processor determines each level's coefficients having magnitudes within a threshold range and discards the remaining coefficients (e.g., the "noise"). The processor then determines the coefficient map having the best correlation to the input signal sample by analyzing the drop-offs in coefficient magnitude across each of the coefficient maps.
- coefficients can be used to (1) reconstruct a denoised digital or analog signal using a re-transformation process or (2) to produce a digital report indicating vital pulse information including leading edge pulse position, pulse peek amplitude, pulse duration, etc.
- the input signal energy is efficiently repackaged in terms of wavelet basis functions with a reduced set of information (coefficients) representing the input signal.
- an embodiment of the present invention includes a method for denoising an input RWR digital signal, the method comprising the computer implemented steps of: a) sampling the input digital signal into sample windows, each sample window comprising x discrete sample points; b) convolving the sample window with selected wavelet basis functions across n frequency resolution levels to generate n sets of x correlation coefficients with each frequency resolution level generating x correlation coefficients; c) generating a set of n coefficient maps, one coefficient map per frequency resolution level of the n frequency resolution levels; d) determining a best coefficient map of the n coefficient maps that most efficiently packages the x discrete sample points of the sample window; and e) recording selected correlation coefficients of the best coefficient map for use in reconstruction of a denoised output digital signal.
- Embodiments also include an RWR system implemented in accordance with the above.
- FIG. 1 is an overall block diagram of two embodiments of a radar warning receiver (RWR) system in accordance with the present invention both including a denoising system using wavelet transformation.
- RWR radar warning receiver
- Figure 2 illustrates an embodiment of the denoising processor system of the present invention using a computer system.
- Figure 3 is a flow diagram illustrating initial steps of the present invention process for denoising an input signal using wavelet transformation.
- Figure 4 is a flow diagram illustrating parallel processing steps of the present invention process for wavelet transformation and coefficient thresholding for multiple frequency resolution levels (e.g., 1 to n).
- Figure 5A is a flow diagram illustrating discrete convolution and decimation steps of the wavelet transformation step of Figure 4 in accordance with the present invention.
- Figure 5B is a flow diagram illustrating the coefficient thresholding and recording step of Figure 4 in accordance with the present invention for each level.
- Figures 6A, 6B, and 6C represent exemplary coefficient maps produced by wavelet transformation processes for three exemplary frequency resolution levels in accordance with the present invention.
- Figure 7 is a flow diagram of steps of one exemplary embodiment of the present invention for using the denoising system of the present invention with a digital RWR analysis system.
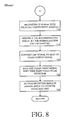
- Figure 8 is a flow diagram of steps of one exemplary embodiment of the present invention for reconstructing a denoised analog signal for application to a well known analog RWR pulse processor.
- Figure 9A, Figure 9B and Figure 9C are phase diagrams illustrating frequency bands of three frequency resolution levels of a wavelet transformation translated input signal.
- Figure 11A illustrates a discrete convolution procedure with decimation convolving the 2 wavelet basis functions of frequency resolution level 1 across two time segments of the input sample window to arrive at the 4 level 1 coefficients of the present invention.
- Figure llB illustrates a discrete convolution procedure with decimation convolving the 4 wavelet basis functions of frequency resolution level 2 with the input sample window to arrive at the 4 level 2 coefficients in accordance with the present invention.
- Figures 12A, 12B, 12C, and 12D illustrate reconstruction by discrete convolution procedures with interpolation to arrive at the denoised signal based on the frequency resolution level 1 coefficients in accordance with the present invention.
- Figures 13A, 13B, 13C, and 13D illustrate reconstruction by discrete convolution procedures with interpolation to arrive at the frequency resolution level 1 coefficients based on the frequency resolution level 2 coefficients in accordance with the present invention.
- Figure 29A illustrates a representation of an input digitized signal sampled over multiple points showing both noise and a signal pulse.
- Figure 29B illustrates a representation of a denoised digitized signal (as output by the present invention) of the input signal of Figure 29A.
- the present invention utilizes wavelet transformations to transform a digitized signal window into sets of correlation coefficients ("coefficients") that represent wavelet basis functions.
- One type of wavelet transformation performed by the present invention is the Haar wavelet transformation.
- the wavelet basis functions ("basis functions") employed by the present invention to perform the transformation are Haar wavelet packets and are specifically tailored for pulse signal representation while not well formulated to correlate with signal noise. This representation maximizes the utility of available a priori information about the input signals and also packages the signal energy efficiently into a reduced number of terms (e.g., coefficients) for fast signal denoising, detection, characterization and reconstruction.
- the wavelet transformations performed by the present invention are efficiently performed using multiple parallel processing units.
- Wavelet transformation outperforms classical Fourier transformation techniques in cases when the input signals are wide band transients, as is the case in RWR applications.
- This advantage stems from the fact that wavelets themselves are energy pulses having: 1) oscillations; 2) with a zero average over the wavelet; 3) with constant fidelity, e.g., df/f is constant; 4) with no DC terms, and 5) with finite support, e.g., most of the wavelet value is zero except for a small duration of non zero (1/-1) values.
- Wavelets are different from sinusoidals (that have infinite support) in that wavelet transformations allow a combined time-frequency representation of the signal, rather than a sole frequency representation as provided by Fourier analysis. Further, wavelet transformation offers constant frequency fidelity across all frequency resolution levels, unlike a Fourier transform. What follows is a description of an RWR system effectively employing a Haar wavelet transformation processor system for denoising of an input wide band signal carrying pulse signals with noise.
- FIG. 1 illustrates a block diagram of an RWR system 14 in accordance with the present invention, including a Haar wavelet transformation processor unit 112 ("processor unit 112").
- processor unit 112 wide band radio frequency
- Quad receiver 10 can be implemented in accordance with a number of well known designs and typically contains four fields of view.
- Quad receiver 10 outputs wide band video signals over line 15 which are supplied to an analog to digital converter (ADC) circuit 20, which is also well known.
- ADC analog to digital converter
- the signal over line 15 is an input analog signal and contains noise.
- ADC circuit 20 generates a digital representation of the input analog signal received by quad receiver 10.
- an exemplary ADC circuit 20 can operate at a sample frequency of 64 MHz with a sample resolution of 8-10 bits.
- Sampled digital signal points representative of the input analog signal 15 are supplied over bus 25 to the Haar wavelet transformation processor unit 112.
- the size of bus 25 depends on the resolution of the ADC circuit 20 and in one embodiment is between 8-10 bits wide.
- the digital signal points presented over bus 25 are sampled by processor unit 112 in sample windows of x signal points per window.
- x is a power of 2.
- processor system 112 is a high speed computer system implemented to perform parallel processing (e.g., having a single high speed central processing unit or having multiple parallel central processing units).
- the design of the processor system 112, as described herein to follow, can be implemented with a custom designed circuit having hardware parallel processors specially adapted to perform wavelet transformations.
- the design of the processor system 112 can be realized using a programmable data signal processing (DSP) chip (e.g., the TMS 320 C80 by Texas Instruments) or an application specific integrated circuit (ASIC), or a programmable logic device (PLD), or a field programmable gate array (FPGA) on a pulse processing board.
- DSP programmable data signal processing
- ASIC application specific integrated circuit
- PLD programmable logic device
- FPGA field programmable gate array
- Processor system 112 of Figure 1 receives the digitized representation of the input signal over bus 25 and selects sample windows, each having a determined number of sample points (e.g., x).
- Processor system 112 performs Haar wavelet transformations upon the sample points using multiple frequency resolution levels (e.g., n), each level having different frequency and time resolutions.
- processor system 112 convolves (with decimation) selected Haar wavelet basis functions across different time segments of the input sample window to generate x different correlation coefficients ("coefficients").
- coefficients Across all n levels, a total of n*x coefficients are computed by processor system 112 with coefficients of a same level determined in parallel with other levels.
- the processor system 112 of Figure 1 also generates a coefficient map ranking all of the x coefficients of that level by their respective magnitudes.
- Processor system 112 analyzes each coefficient map to determine which map of the n levels best packages or correlates to the input signal sample; a drop-off procedure can be used by processor unit 112 to perform this process with the coefficient map having the sharpest drop-off curve selected as the "best coefficient map.”
- the best coefficient map can also be selected by using two distinct methods from a complete multi-resolution signal decomposition tree diagram. The first method is a minimum entropy procedures. Shannon entropy of a function expansion is a classic measure of good fit or the "distance" between the basis function and the signal function.
- signal decomposition with minimum entropy indicates that the basis function in use provides the best fit or most efficient energy compaction.
- the second method is the sharpest coefficient drop off method. As discussed above, a search method can be used for a coefficient map that exhibits the highest efficiently in energy packaging, e.g., uses the least number of coefficients to represent a preset desired signal energy level. The second method is the preferred practical method.
- the processor system 112 selects the coefficients having the largest magnitude ("selected coefficients"); a thresholding procedure can be used here. Since noise signal characteristics and waveforms are not well represented by the Haar wavelet basis functions of the present invention, selection of the largest magnitude coefficients while eliminating the remainder coefficients effectively performs a denoising of the transformed input signal sample.
- RWR system 14 of the present invention generates one of two different outputs depending on the RWR implementation desired, both of which are shown in Figure 1.
- a digital pulse processor 45 is employed and is coupled to receive a digital pulse report 40 stored in computer memory.
- Processor system 112 generates the digital pulse report 40, which is stored within unit 35, based on the selected coefficients of the best coefficient map.
- the pulse report 40 contains vital information regarding a detected pulse within the input sample including whether a pulse was detected at all, the pulse leading edge position, the pulse peak amplitude and the pulse width or duration. This information is supplied to a digital pulse processor 45 for pulse and signal recognition and other well known threat characterization processing.
- the output of the digital pulse processor 45 is supplied to an output display unit 70 and/or a countermeasures unit 70, both of which are well known in the art.
- the processor system 112 of Figure 1 contains a reconstruction (e.g., re-transformation) processor which inputs the selected coefficients of the best coefficient map. Based on these selected coefficients, the re-transformation processor performs a re-transformation to reconstruct a digital signal representing a denoised version of the input digital signal at 25. This digital signal is normalized and then output over bus 30 to a digital to analog converter (DAC) circuit 55 of a well known design.
- Unit 50 contains both the DAC circuit 55 and a wide band video pulse processor 65 of a well known design which detects and analyzes pulses for threat characterization.
- the DAC circuit 55 generates a denoised analog signal ("clean video signal") over line 60 which is supplied to the wide band video pulse processor 65 for processing.
- a denoised analog signal ("clean video signal"
- an otherwise conventional RWR system can be retrofitted using the present invention processor system 112 in combination with the ADC circuit 20 and the DAC circuit 55.
- the present invention denoising system of this embodiment receives a "video in” 15 and generates a "clean video out” 30 (video-in/video-out) used by conventional downstream processors (e.g., processor 65).
- the output of the wide band video pulse processor 65 is supplied to an output display unit 70 and/or a countermeasures unit 70, both of which are well known in the art.
- FIG. 2 illustrates one embodiment of processor system 112 as a computer system.
- the wavelet transformation processes (e.g., process 300/ Figure 3) of the present invention can be realized utilizing parallel processing.
- Processor 101 can be a high speed processor capable of executing simultaneous processing tasks or, alternatively, processor 101 can be implemented as a number of individual parallel executing processors 101 (e.g., n processors), one for each of the n frequency resolution levels analyzed within the present invention wavelet transformation processes.
- processor system 112 comprises an address/data bus 100 for communicating information, the central processor(s) 101 coupled with the bus 100 for processing information and instructions, one or more computer readable volatile memories (e.g., random access memory) 102 coupled with bus 100 for storing information and instructions for the central processor(s) 101, one or more computer readable non-volatile memories (e.g., read only memory) 103 coupled with bus 100 for storing static information and instructions for the processor(s) 101, a signal communication device 108 coupled to the bus 100 for providing communication between processor system 112 and external units, and an optional data storage device 104 such as a magnetic or optical disk and disk drive coupled with bus 100 for storing information and instructions.
- processor system 112 comprises an address/data bus 100 for communicating information, the central processor(s) 101 coupled with the bus 100 for processing information and instructions, one or more computer readable volatile memories (e.g., random access memory) 102 coupled with bus 100 for storing information and instructions for the central processor(s) 101, one or more computer readable non-volatile
- Optionally coupled to system 112 can be an optional display device 105 coupled to bus 100 for displaying information to the computer user, an optional alphanumeric input device 106 coupled to bus 100 for communicating information and command selections to the central processor(s) 101, and an optional cursor control device 107 coupled to bus 100 for communicating user input information and command selections to the central processor(s) 101.
- an optional display device 105 coupled to bus 100 for displaying information to the computer user
- an optional alphanumeric input device 106 coupled to bus 100 for communicating information and command selections to the central processor(s) 101
- an optional cursor control device 107 coupled to bus 100 for communicating user input information and command selections to the central processor(s) 101.
- FIG. 3 illustrates steps of process flow 300 performed by the present invention to perform signal denoising.
- radio frequency (RF) signals are received over antenna 5 by quad receiver 10 which generates a noisy analog video signal (the input signal) over line 15.
- Step 305 can be performed using well known components and techniques.
- the noisy analog video signal is digitized by ADC circuit 20 which samples the noisy video signal over sample windows, each sample window having a number (x) of discrete digital sample points.
- the digital signal output over bus 25 is the input digitized signal.
- Step 310 can be performed using well known components and techniques.
- the ADC circuit 20 is preprogrammed to sample at a predetermined frequency (e.g., 64 MHz) and the number of sample points within a sample window is programmable (e.g., x sample points).
- a predetermined frequency e.g. 64 MHz
- the number of sample points within a sample window is programmable (e.g., x sample points).
- the time between input signal sample points is approximately 15.63 nanoseconds.
- the processor system 112 of the present invention performs high speed real-time wavelet transformation to transform the digital sample points of bus 25.
- Step 315 performs wavelet transformations on a sample window by sample window basis.
- a programmable number e.g., n
- levels frequency resolution levels
- each level generating at least x coefficients corresponding to the current input sample window.
- the discrete sample points of the input sample window are discretely convolved (using decimation) with certain wavelet basis functions (frequency bands) to produce the x coefficients for each level. For each frequency band within each level, convolution is performed across select number of time segments of the input sample window.
- the magnitude of the coefficient dictates how well the corresponding wavelet basis function correlates to the input signal within the input sample window.
- x coefficients are generated based on the above convolution process.
- a coefficient map is produced by step 315 which ranks the coefficients by magnitude.
- the level having the coefficient map which best correlates to the input digital sample window (e.g., the "best coefficient map") is determined by the processor system 112 at step 315.
- the highest magnitude coefficients of the best coefficient map (e.g., the "selected coefficients”) are then output by step 315 and stored into a memory unit (e.g., 102, 103, or 104 of Figure 2).
- the present invention transformation at step 315 is particularly advantageous because convolution is performed by addition and subtraction instructions, rather than with process intensive multiplication instructions, due to the fact that the mother wavelet basis functions are represented by "1" and "-1.” Since multiplication is not utilized during step 315, the present invention convolutions operate a high speed and are well suited for real-time applications.
- step 320 of Figure 3 the present invention performs scalar and/or vector quantization to encode the selected coefficients into a form having a certain number of bits (e.g., y) that depends on the desired resolution of the RWR system 14. Step 320 is performed so that peak amplitude and leading edge position information is properly interpreted by the downstream processors. In some cases, step 320 is not required.
- step 325 the present invention performs sorting of levels provided pulse-on-pulse processing is requested. During pulse-on-pulse processing, different levels processed at step 315 can individually represent a second detected pulse within the input sample window. As is well known with pulse on pulse conditions, the second detected pulse is typically congruent in time with the primary pulse.
- these pulse-on-pulse conditions can be determined and isolated since both the primary and the secondary pulse survive the thresholding processes of the present invention.
- optional step 325 can be used to select an other best coefficient map of the coefficient maps generated in step 315; the other best coefficient map being used to represent the pulse-on-pulse condition.
- Wavelet transformations offers advantageous detection capability for pulse-on-pulse conditions due to the multiple resolution strategy offered by their multiple different frequency resolution levels.
- process 300 continues using different steps (a first embodiment is shown starting at Figure 7 with a second embodiment being shown starting at Figure 8). These embodiments are described in more detail further below.
- Figure 4 is a flow diagram illustrating steps of process 315 of Figure 3 in more detail.
- the steps of Figure 4 can be realized by individual hardware processor units, or alternatively, can be realized by software code executed by processor 101 within processor system 112 and stored in computer readable memories 102, 103 and/or 104.
- the wavelet transformation process 315 of the present invention is distributed across different frequency resolution levels (e.g., level 1 to level n) simultaneously via steps 410a through 410n which each step processing a different frequency resolution level. Steps 410a through 410n are performed simultaneously by parallel processors.
- Each frequency resolution level offers a different frequency and time resolution convolution with the input sample window. The larger the wavelet basis function, the better its frequency resolution is and the smaller the wavelet basis function, the better its time resolution is.
- each frequency resolution level wavelet basis functions of the same frequency resolution are used.
- the steps of an example process 410a are shown in more detail in Figure 5A, however, each step of 410a-410n utilizes the same subprocesses.
- the discrete sample points (e.g., x sample points) of an input signal window are convolved using discrete convolution and decimation with selected wavelet basis functions so that x coefficients are generated for each of the n levels.
- Each level contains 2n different wavelet basis functions, each wavelet basis function corresponds to an individual frequency band within its level.
- each frequency band within a level r contains x / (2r) coefficients; therefore, each frequency band contains x / (2r) time segments for a level r. Therefore, for a wavelet basis function that is k times smaller than the input sample window, the wavelet is convolved across k equally spaced time segments of the input signal window. As the coefficients are determined, they are time stamped with the time segment of the sample window to which they correspond.
- coefficients corresponding to a given frequency band (e.g., SSS1-SSS4) of a given level n can be determined simultaneously with coefficients corresponding to a different frequency band (e.g., SDS1-SDS4) of same level n.
- the present invention then ranks the coefficients by order of magnitude for each of the n levels which generates a coefficient map for each of the n levels.
- Figure 6A, Figure 6B and Figure 6C illustrate three exemplary coefficient maps 610, 640 and 660 respectively. As shown, the coefficients are ranked from the left to right by order of their respective magnitudes.
- the coefficient magnitude is shown along the vertical axis 612, 642 and 662, for Figure 6A, Figure 6B and Figure 6C, respectively, and the coefficient sort order is shown along the vertical axis 614, 644 and 664, respectively.
- Steps 420a through 420n of Figure 4 for each of the n levels, the present invention also performs a thresholding process to select the coefficients of each level having magnitudes larger than a determined threshold value that is computed for each level.
- Steps 420a through 420n are processed simultaneously by parallel processors and receive the outputs generated by steps 410a to 410n, respectively.
- the threshold value is determined as shown by step 530 of Figure 5B.
- Figure 6A, Figure 6B and Figure 6C illustrates that step 420a through 420n select coefficients within the threshold ranges 620, 650 and 670, respectively, with CT being the coefficient located at the threshold position.
- the thresholding performed at steps 410a through 410n can be performed based on a fixed magnitude value or, preferably, is based on a relative coefficient magnitude based on the maximum magnitude of the coefficient map for that level.
- M is approximately between 10 and 30 percent, but is a programmable value depending on the expected characteristics of the input signal to be transformed.
- step 535 of Figure 5B once a threshold coefficient CT is selected, all coefficients of that coefficient map within the threshold are recorded into computer readable memory (e.g., 102, 103 or 104) while the remaining coefficients are excluded. In this case, the coefficients falling outside of the threshold range (e.g., 620, 650, and 670) most probably correspond to signal noise which does not correlate well to the wavelet basis functions of the present invention and therefore will not be well represented by coefficient magnitudes.
- the present invention (for each individual level) generates a set of coefficients that effectively packages the signal energy represented by the sample points of the input signal window based on the basis functions for each level.
- the present invention selects the frequency resolution level having the best correlated coefficient map to the input signal window, this is the best coefficient map.
- the thresholded coefficients of the best coefficient map most effectively package the signal energy of the input signal window of all frequency resolution levels.
- Step 430 can be performed by analyzing the coefficient maps generated by steps 410a through 410n for the coefficient map having the sharpest drop-off of ranked coefficients (e.g., having the largest derivative of coefficient magnitudes over the sort order).
- the drop-off point to be analyzed by step 430 is close to the threshold coefficient (CT) determined by steps 420a-420n.
- CT threshold coefficient
- the best coefficient map determined by step 430 illustrates that the wavelet basis functions of the corresponding level efficiently correlate to the input signal window by packaging the sample points using only a relatively small number of basis functions.
- coefficient map 610 offers the sharpest drop-off near the threshold coefficient (CT), therefore, step 430 selects coefficient map 610 as the best coefficient map. It is appreciated that a number of well known techniques and processes can be used at step 430 for selecting the coefficient map having the sharpest drop-off value near the threshold coefficient.
- the present invention then records those coefficients that are within the previously determined threshold range for the best coefficient map and zeros all remaining coefficients of that level.
- step 430 can be performed in advance of steps 420a through 420n.
- thresholding needs only to be performed once on the coefficient map selected by step 430.
- step 430 does not have the advantage of searching for a sharp drop-off near the threshold coefficient (CT) because the threshold coefficients (determined at steps 420a-420n) have not yet been determined.
- CT threshold coefficient
- the present invention analyzes the coefficient map selected by step 430 to determine if a pulse has been detected at all. In certain cases where the sharpest drop-off of the coefficient map is rather minimal (e.g., the selected coefficient map is flat), the present invention determines that no pulse is recognized and the input sample window contains all noise. This case is shown in Figure 6B where the coefficient map 640 is flat. If no pulse is detected at step 435, the present invention at step 440 reports that no pulse is detected within the current sample window and process 315 returns.
- step 435 if a pulse is detected (e.g., the drop-off value of the selected coefficient map is significantly sharp), then at step 445 the present invention reports the coefficients (and their magnitudes) within the threshold range (e.g., range 620) of the best coefficient map selected by step 430 and process 315 returns.
- a pulse e.g., the drop-off value of the selected coefficient map is significantly sharp
- FIG. 10A illustrates a sample signal window 330 containing X0, X1, X2, and X3 sample points, as well as a first wavelet basis function 335 located at a first time segment for high frequency band of level 1 and a second wavelet basis function 340 located at the first time segment for low frequency band of level 1.
- Figure 10B illustrates the wavelet basis function 335 located at a second time segment along the sample window 330 and the wavelet basis function 340 located at the second time segment along the sample window 330.
- wavelet basis functions 335 and 340 are convolved with the sample points of window 330 at the two time positions shown in Figure 10A and Figure 10B to generate a set of four coefficients.
- Figure 10C illustrates the wavelet basis functions for level 2 for the present embodiment.
- the wavelet basis functions are 345, 350, 355, and 360, which when convolved with the input sample window 330, produce level 2 coefficients of DD1, SD1, DS1, and SS1, respectively.
- the high frequency band of level 1 is divided into two bands using wavelet basis functions 345 and 350 while the low frequency band of level 1 is divided into bands using two wavelet basis functions 355 and 360.
- Level 2 therefore provides better frequency resolution over level 1, however, offers reduced time resolution because the four wavelet basis functions span the entire input sample window 330.
- Basis functions 345, 350, 355, and 360 contain either a "1" value or a "-1" value.
- FIG. 11A and Figure 11B illustrate the convolution and decimation processes performed by step 410a of Figure 4 for level 1 with an input sample window having 4 sample points (ignoring normalization factors).
- S1 and S2 represent two different time segments of the low frequency band of level 1.
- D1 and D2 represent two different time segments of the high frequency band of level 1.
- S1 and D1 are time stamped to correspond to the first time segment (e.g., the time position of X0 and X1 of Figure 10A) while S2 and D2 are time stamped to correspond to the second time segment (e.g., the time position of X2 and X3 of Figure 10B).
- the coefficients S1, S2, D1 and D2 are determined within the present invention based on the above relationships. Since the values involved are each binary, addition and subtraction instructions are executed and multiplication instructions are avoided.
- FIG 11B illustrates the convolution processes performed by step 410b of Figure 4 for level 2 with an input sample window having 4 sample points (ignoring normalization factors).
- each of the above four coefficients for level 1 and each of the above four coefficients for level 2 are simultaneously computed by the present invention at steps 410a and 410b of Figure 4.
- the present invention After computing the above 4 coefficients for level 1 and the 4 coefficients for level 2, the present invention at steps 420a and 420b ( Figure 4) computes a coefficient map for level 1 and for level 2, respectively.
- the present invention determines the coefficients of level 1 having the magnitudes within the threshold.
- the present invention determines the coefficients of level 2 having the magnitudes within the threshold.
- the present invention determines which coefficient map of level 1 or level 2 has a coefficient order with a sharper drop-off of coefficient magnitude.
- the determined coefficients having the largest magnitude of the best coefficient map are recorded into computer readable memory.
- Figure 14 illustrates the high 335 and low 340 frequency band wavelet basis functions of the first level according to the above transformation example.
- basis function 340 is shifted by two data points across the 32 data point sample window 830 (e.g., over 16 time segments).
- the wavelet basis function 340 is multiplied by 2 sample points of sample window 830 to arrive at each coefficient of S1-S16 of the low frequency band of level 1.
- S11 X20+X21; the other 15 coefficients are computed analogously.
- Figure 19B illustrates convolution/decimation procedure 845 performed by step 410a for level 1 where the 16 coefficients D1-D16 of the high frequency band of level 1 are computed based on shifting high frequency wavelet basis function 335 across the 16 time segments of input sample window 830 in manner analogous to Figure 19A.
- D11 X20-X21; the other 15 coefficients are computed analogously.
- Level 1 of this example yields a time resolution of 16 time segments, each two sample points in duration.
- the above convolution procedures 840 and 845 generate 32 coefficients for level 1 with a time resolution of 16 time segments for each of the two frequency bands.
- Figure 15 illustrates the frequency band wavelet basis functions 345, 350, 355, and 360 (from highest to lowest frequency) for level 2 of the above transformation example.
- High band functions are 345 and 350 and low band functions are 355 and 360.
- basis function 360 is shifted by four data points across the 32 data point sample window 830 (e.g., over 8 time segments).
- step 410b of the present invention basis functions 355, 350, and 345 are individually shifted along individual 4 data point time segments and at each segment is convolved with 8 data points of sample window 830 to produce the remaining frequency band coefficients DS1-DS8, SD1-SD8, and DD1-DD8, respectively, of Table II using discrete convolution and decimation.
- the above convolution procedures 850, 855, 860, and 865 generate 32 coefficients for level 2.
- level 1 offers twice the frequency resolution over level 1
- level 1 offers twice the time resolution over level 2 (e.g., level 1 has 16 time segments while level 2 has only 8 time segments for each frequency band; and level 2 has four frequency bands while level 1 has two frequency bands).
- Figure 16 illustrates the eight frequency band wavelet basis functions 464, 462, 460, 458, 456, 454, 452, and 450 (from highest to lowest frequency) for level 3 of the above transformation example.
- High band functions are 464, 462, 460, and 458 and low band functions are 456, 454, 452, and 450. Therefore, level 3 contains eight frequency bands, each band having four coefficients and four time segments.
- step 410c of the present invention is analogous to step 410b but applicable to level 3 convolution
- basis function 450 is shifted along the 4 time segments and at each time segment is convolved with an 8 data points of sample window 830 to produce the 4 lowest frequency band coefficients SSS1-SSS4 of Table II using discrete convolution and decimation.
- SSS3 X16+X17+X18+X19+X20+X21+X22+X23. This provides four time segments per frequency band.
- basis function 464 is shifted along 4 time segments and at each time segment is convolved with 8 data points of sample window 830 to produce the highest frequency band coefficients DDD1-DDD4 of Table II using discrete convolution and decimation.
- the above convolution procedures 870 and 875 produce the first four and the last four coefficients for level 3. It is appreciated that under analogous convolution procedures, the remaining 24 coefficients SDD1-SDD4, DSD1-DSD4, SSD1-SSD4, DDS1-DDS4, SDS1-SDS4, and DSS1-DSS4 are produced by convolving wavelet basis functions 462, 460, 458, 456, 454, and 452, respectively, across the sample window 830 while shifting across the four time segments as shown in Figure 21A or Figure 21B to produce each coefficient.
- level 3 offers twice the frequency resolution over level 2
- level 2 offers twice the time resolution over level 3 (e.g., level 2 has 8 time segments while level 3 has only 4 time segments for each frequency band; and level 3 has eight frequency bands while level 2 has four frequency bands).
- Figure 17 illustrates the sixteen frequency band wavelet basis functions (from highest to lowest frequency) starting with low band functions 499, 498, 496, 494, 492, 490, 488, and 486 and high band functions 484, 482, 480, 478, 476, 474, 472, and 470 for level 4 of the above transformation example. Therefore, level 4 contains sixteen frequency bands, each band having two coefficients.
- step 410d of the present invention is analogous to step 410b but applicable to level 4 convolution
- basis function 470 is shifted along 2 time segments and at each time segment is convolved with 16 data points of sample window 830 to produce the 2 lowest frequency band coefficients SSSS1-SSSS2 of Table II using discrete convolution and decimation.
- SSSS1 X0+X1+X2+X3+X4+ X5+X6+X7+ X8+X9+X10+X11 +X12+X13+X14+X15. This provides two time segments per frequency band.
- step 410d of the present invention basis function 499 is shifted across the two time segments and at each time segment is convolved with 16 data points of sample window 830 to produce the highest frequency band coefficients DDDD1-DDDD2 of Table II using discrete convolution and decimation.
- the above convolution procedures 880 and 885 produce the first two low frequency and the last two high frequency coefficients for level 4. It is appreciated that under analogous convolution procedures, the remaining 28 coefficients SDDD1-SDDD2, DSDD1-DSDD2, SSDD1-SSDD2, DDSD1-DDSD2, SDSD1-SDSD2, DSSD1-DSSD2, SSSD1-SSSD2, DDDS1-DDDS2, SDDS1-SDDS2, DSDS1-DSDS2, SSDS1-SSDS2, DDSS1-DDSS2, SDSS1-SDSS2, DSSS1-DSSS2, are produced by convolving wavelet basis functions 498, 496, 494, 492, 490, 488, 486, 484, 482, 480, 478, 476, 474, and 472, respectively, across the sample window 830 while shifting by sixteen sample points as shown in Figure 22A or Figure 22B to produce each coefficient.
- level 4 offers twice the frequency resolution over level 3
- level 3 offers twice the time resolution over level 4 (e.g., level 3 has 4 time segments while level 4 has only 2 time segments for each frequency band; and level 4 has sixteen frequency bands while level 3 has eight frequency bands).
- Figure 18A and Figure 18B illustrate the thirty-two frequency band wavelet basis functions (from highest to lowest frequency) of level 5 with high band functions being 555a, 554a, 553a, 552a, 551a, 550a, 549a, 548a, 547a, 546a, 545a, 544a, 543a, 542a, 541a, and 540a, and low band functions being 555b, 554b, 553b, 552b, 551b, 550b, 549b, 548b, 547b, 546b, 545b, 544b, 543b, 542b, 541b, and 540b of the above transformation example. Therefore, level 5 contains thirty-two frequency bands, each band having one coefficient.
- step 410n of the present invention (step 410n is analogous to step 410b but applicable to level 5 convolution), basis function 540b is convolved with the 32 data point sample window 830 to produce the lowest frequency band coefficient SSSSS1 of Table II using discrete convolution.
- SSSSS1 X0+ . . .+X31. This provides one time segment per frequency band.
- basis function 555a is convolved with the 32 data point sample window 830 to produce the highest frequency band coefficient DDDDD1of Table II using discrete convolution.
- level 5 offers twice the frequency resolution over level 4
- level 4 offers twice the time resolution over level 5 (e.g., level 4 has 2 time segments while level 5 has only 1 time segment for each frequency band; and level 5 has 32 frequency bands while level 4 has 16 frequency bands).
- the present invention transformation process 315 computes the above 32 coefficients for each of the 5 levels simultaneously and stores this information into a computer readable memory unit (102, 103 and/or 104) of system 112. Subsequently, the coefficients for each of the 5 levels are sorted into 5 different coefficient maps (by level) and stored at step 520 ( Figure 5A). At step 430 ( Figure 4), the best coefficient map of the 5 levels is selected and the best map's coefficients having the largest magnitude (e.g., as determined by step 535 ( Figure 5B)) are stored in computer readable memory to represent the transformed representation of the input signal window.
- frequency resolution increases and from level 1 to level 3 while time resolution decreases in this same direction.
- Frequency resolution increases as the level number increases because more frequency bands are introduced, e.g., level 3 910c offers eight frequency bands while level 1 910a offers only two.
- the size of the wavelet basis functions increase as the level number increases (e.g., see Figures 14, 15 and 16).
- the time resolution decreases proportionately, e.g., the wavelet basis functions of level 3 910c are four times larger in time size compared to the basis functions of level 1 910a and therefore the wavelet basis functions of level 3 can be shifted fewer times over the input sample window.
- the length of each time segment increases in direct proportion to the length of a wavelet basis function, meaning the resultant time resolution decreases. If higher resolution in time is desired, a non-decimated decomposition procedure can be used within the present invention.
- level 1 offers two frequency bands (Low/High) and offers four coefficients per band (see also Figure 14).
- the time segments within each band are therefore twice the data sample rate (e.g., 2x15.6 ns @64 MHz ADC circuit 20).
- Level 2 910b of Figure 9B offers two frequency bands within the low band and offers two frequency bands within the high band for a total four frequency bands, each frequency band having two coefficients per band (see also Figure 15).
- the time segments within each band are therefore four times the data sample rate (e.g., 4x15.6 ns @64 MHz ADC circuit 20).
- level 3 910c of Figure 9C offers four frequency bands within the low band and offers four frequency bands within the high band for a total eight frequency bands, each frequency band having 1 coefficient per band (see also Figure 16).
- the time segment within each band is therefore eight times the data sample rate (e.g., 8x15.6 ns @64 MHz ADC circuit 20).
- each level n offers a different frequency and time resolution combination within diagrams 910a-910c.
- those "tiles" with corresponding coefficients having large magnitudes are shaded depending on their magnitude.
- tile 936 of frequency resolution level 3 910c corresponds to a particular frequency band (e.g., wavelet basis function) whose coefficient has a large magnitude.
- the input sample window contains significant energy in specific frequency bands indicated by tiles 932, 934 and 936.
- the basis functions representing these three frequency bands efficiently correlate to the signal data of input sample window. It is appreciated that the area of each of the shaded tiles 932, 934, and 936 is the same. This illustrates that the time/frequency resolution ratio for each level is the same.
- the transformation information of the present invention offers both effective time and frequency information. This is quite unlike a classical Fourier transformation where time information is lost because the transformation sinusoidal signal contains infinite support, whereas the support for a wavelet basis function is finite.
- the expected input signal for an RWR application is a pulse
- its signal format is non-stationary (e.g., the major or statistical characteristics of the signal are changing as a function of time).
- Classic Fourier transformations while effective for stationary signals are not effective for non-stationary signals where wavelet transformations, such as the present invention, offer more information within the transformation domain.
- the embodiments that follow describe two systems that make use of the denoised transformed signal in a larger RWR system for feature extraction (e.g., pulse detection within a denoised reconstructed signal).
- the coefficients selected by step 430 are used directly to compute the digital pulse report 40 of Figure 1 which is supplied to a digital pulse processor 45 which performs downstream processing for signal characterization and recognition. In this embodiment, re-transformation is not required and therefore is optionally performed.
- Figure 7 illustrates steps performed by this embodiment of the present invention and is a continuation of process 300 ( Figure 3).
- the digital report 40 is generated and stored in memory.
- the present invention determines the time of the pulse's leading edge, the pulse duration and peek amplitude.
- the signal can be re-constructed (e.g., re-transformed) digitally using the selected coefficients of step 430; this process is described in detail with respect to the second embodiment of the present invention (step 710/ Figure 8).
- the digital pulse processor 45 Figure 1
- the results of step 820 are output either for display (e.g., on an azimuth display unit) and/or forwarded to an electronic counter-measures unit.
- the denoising system is placed within an existing RWR system to provide a clean (e.g., denoised) video signal (over line 60/ Figure 1) representing the input signal.
- a clean (e.g., denoised) video signal over line 60/ Figure 1 representing the input signal.
- reconstruction of the selected coefficients (stored at step 430) back into the signal domain is required. This process is described with reference to Figure 8.
- the present invention processor system 112 performs a re-transformation of coefficients selected at step 430 to produce a denoised reconstructed digital signal which is supplied over bus 30 ( Figure 1).
- Re-transformation is performed by the present invention at step 710 by performing a convolution of the coefficients against Haar wavelet basis function 340 and the inverse of wavelet basis function 335 (referred to as 335') using interpolation in lieu of decimation.
- the present invention convolves the low band wavelet basis function with interpolated low band coefficients and convolves the inverse of the high band wavelet basis function with interpolated high band coefficients.
- Figures 12A, 12B, 12C and 12D illustrate the re-transformation process from the level 1 coefficients back to the reconstructed denoised signal (X0, X1, X2 and X3).
- header 362 and footer 364 represent the level 1 coefficients used to reconstruct X0 and zeros are placed between for interpolation.
- Each of the reconstruction processes shown in Figures 12A, 12B, 12C and 12D can be performed simultaneously given the input coefficients for level 1 in order to rapidly generate the reconstructed denoised signal X0, X1, X2 and X3.
- step 710 It is appreciated that the above processes are performed by the present invention for a particular input sample window only if step 430 indicated that level 1 contained the best coefficient map, otherwise the level 1 coefficients are zeroed.
- X0 SS1+DS1+SD1+DD1
- X1 SS1+DS1-SD1-DD1
- X2 SS1-DS1+SD1-DD1
- X3 SS1-DS1-SD1+DD1
- the above relationships for level 2 are performed simultaneously at step 710 given the input coefficients for level 2 to rapidly generate the reconstructed denoised signal X0, X1, X2 and X3. It is appreciated that the above processes are performed by the present invention for a particular input sample window only if step 430 indicated that level 2 contained the best coefficient map. If so, only the selected level 2 coefficients (e.g., with magnitudes within the threshold value determined at step 420a) are used to perform the reconstruction at step 710.
- Figures 24A and 24B illustrate the re-transformation process 942 which translates from the 32 level 1 coefficients back to the reconstructed denoised signal (X0, . . . , X31).
- wavelet basis functions 340 and 335' are individually shifted along the header 940a and the footer 940b and at each position convolved with the level 1 coefficients to produce the signal data points (X0, . . . , X31).
- the header 940a contains the low frequency resolution level 1 coefficients (S1, . . .
- each sample point (X0, . . . , X31) can be computed based on the 32 coefficients of level 1.
- X14 S8+D8. It is appreciated that process 942 is performed at step 710 only if step 410 selected the level 1 coefficient map with respect to the particular input sample window.
- Figures 25A and 25B illustrate re-transformation processes 952 and 957 that can be used by the present invention to determine the 32 level 1 coefficients based on the 32 level 2 coefficients. Therefore, from the level 2 coefficients, the denoised signal (X0, . . . , X31) can be computed by relying on the level 1 coefficients, or alternatively the denoised signal can be directly computed by the level 2 coefficients.
- Figure 25A utilizes header 950a having SS1 . . . SS8 interpolated coefficients with footer 950b having DS1 . . . DS8 interpolated coefficients which are convolved with wavelets 340 and 335' to derive the low frequency resolution level 1 coefficients S1 .
- Figure 25B utilizes header 955a having SD1 . . . SD8 interpolated coefficients with footer 955b having DD1 . . . DD8 interpolated coefficients which are convolved with wavelets 340 and 335' to derive the high frequency resolution level 1 coefficients D1 . . . D16. From the output of processes 952 and 957 and the above processes of Figures 24A and 24B, relationships expressing the denoised signal (X0, . . . , X31) in terms of the level 2 coefficients can readily be determined.
- the present invention computes the denoised signal based on the selected level 2 coefficients (e.g., those coefficients having magnitudes within the threshold determined at step 420b).
- Figures 26A, 26B, 26C and 26D illustrate re-transformation processes 962, 966, 969, and 972 that are used by the present invention to determine the 32 level 2 coefficients based on the 32 level 3 coefficients.
- the denoised signal (X0, . . . , X31) can be computed by computing the level 2 coefficients first (see above), or can alternatively the denoised signal can be directly computed based on the level 3 coefficients.
- Procedure 962 of Figure 26A utilizes header 960a having SSS1 . . . SSS4 interpolated coefficients with footer 960b having DSS1 . . .
- DSS4 interpolated coefficients which are convolved with wavelets 340 and 335' to derive the low frequency resolution level 2 coefficients SS1 . . . SS8.
- Procedure 966 of Figure 26B utilizes header 964a having SDS1 . . . SDS4 interpolated coefficients with footer 964b having DDS1 . . . DDS4 interpolated coefficients which are convolved with wavelets 340 and 335' to derive the level 2 coefficients DS1 . . . DS8.
- Procedure 969 of Figure 26C utilizes header 968a having SSD1 . . . SSD4 interpolated coefficients with footer 968b having DSD1 . . .
- DSD4 interpolated coefficients which are convolved with wavelets 340 and 335' to derive the level 2 coefficients SD1 . . . SD8.
- Procedure 972 of Figure 26D utilizes header 970a having SDD1 . . . SDD4 interpolated coefficients with footer 970b having DDD1 . . . DDD4 interpolated coefficients which are convolved with wavelets 340 and 335' to derive the level 2 coefficients DD1 . . . DD8. From the output of processes 962, 966, 969, and 972 and the above processes of Figures 25A and 25B, relationships expressing the denoised signal (X0, . . .
- the present invention computes the denoised signal based on the selected level 3 coefficients (e.g., those coefficients having magnitudes within the threshold determined at step 420c).
- Figures 27A-27H illustrate re-transformation processes 982, 986, 987, 991, 993, 995, 997, and 999 that can be used by the present invention to determine the 32 level 3 coefficients based on the 32 level 4 coefficients.
- the denoised signal (X0, . . . , X31) can be computed relying on the level 3 coefficients (see above) or can be directly computed based on the level 4 coefficients.
- Procedure 982 of Figure 27A utilizes header 980a having SSSS1 . . . SSSS2 interpolated coefficients with footer 980b having DSSS1 . . .
- DSSS2 interpolated coefficients which are convolved with wavelets 340 and 335' to derive the low frequency resolution level 3 coefficients SSS1 . . . SSS4.
- procedures 986, 987, 991 of Figures 27B, 27C, and 27D utilize respective headers 984a, 988a, and 990a having SDSS1 . . . SDSS2, SSDS1 . . . SSDS2, and SDDS1 . . . SDDS2 as respective interpolated coefficients and utilize respective footers 984b, 988b, and 990b having DDSS1 . . . DDSS2, DSDS1 . . . DSDS2, and DDDS1 . . .
- DDDS2 as respective interpolated coefficients which are convolved with wavelets 340 and 335' to derive the level 3 coefficients DSS1 . . . DSS4, SDS1 . . . SDS4, and DDS1 . . . DDS4, respectively.
- convolution procedures 993, 995, 997, and 999 of Figures 27E, 27F, 27G and 27H are utilized to generate level 3 coefficients SSD1 . . . SSD4, DSD1 . . . DSD4, SDD1 . . .SDD4, and DDD1 . . . DDD4, respectively.
- processes 982, 986, 987, 991, 993, 995, 997, and 999 and the above processes of Figures 26A, 26B, 26C, and 26D relationships expressing the denoised signal (X0, . . . , X31) in terms of the level 4 coefficients can readily be determined.
- the present invention computes the denoised signal based on the selected level 4 coefficients (e.g., those coefficients having magnitudes within the threshold determined at step 420d).
- Figures 28A-28P illustrate re-transformation processes 1010, 1012, 1014, 1016, 1018, 1020, 1022, 1024, 1030, 1032, 1034, 1036, 1038, 1040, 1042, and 1044 that can be used by the present invention to determine the 32 level 4 coefficients based on the 32 level 5 coefficients. Therefore, based on the level 5 coefficients, the denoised signal (X0, . . . , X31) can be computed relying on the level 4 coefficients or the denoised signal can be directly computed based on the level 5 coefficients.
- Procedure 1010 of Figure 28A utilizes header 1009a having SSSSS1 interpolated coefficient with footer 1009b having DSSSS1 interpolated coefficient which are convolved with wavelets 340 and 335' to derive the low frequency resolution level 4 coefficients SSSS1 . . . SSSS2.
- convolution procedures 1012, 1014, 1016, 1018, 1020, 1022, 1024, 1030, 1032, 1034, 1036, 1038, 1040, 1042, and 1044 of Figures 28B-28P, respectively are utilized to generate level 4 coefficients DSSS1 . . . DSSS2, SDSS1 . . . SDSS2, DDSS1 . . . DDSS2, SSDS1 .
- the present invention computes the denoised signal based on the selected level 5 coefficients (e.g., those coefficients having magnitudes within the threshold determined at step 420n).
- a digitally reconstructed denoised signal is supplied to step 715.
- different normalization factors are multiplied by the signal data points (e.g., X0, X1, etc.) at step 715 so that conservation of energy is maintained through the transformation process.
- the normalization factors are computed such that the squares of all the coefficients equal each other for each level and also equal the squares of each of the signal data points. Based on principles of conservation of energy and the above description, these normalization factors can readily be determined for any level n.
- step 715 the output of step 715 is supplied over bus 30 ( Figure 1).
- the present invention DAC circuit 55 converts the denoised and normalized digital signal supplied over bus 30 into a denoised analog signal supplied over line 60.
- the present invention received a noisy video signal over line 15 and produced a clean (denoised) video signal as output over line 60.
- the present invention supplies the denoised video signal 60 to a well known wide band video pulse processor 65 which perform signal analysis and threat characterization.
- the present invention then outputs the results of wide band video pulse processor 65 to a threat display system (e.g., azimuth display) or a counter-measures unit.
- Figures 29A and 29B illustrate an example signal denoising produced by the present invention.
- Figure 29A illustrates a sample input digital signal 1055 (e.g., received over bus 25 of Figure 1) having a large number of sample points.
- Signal 1050 contains mostly noise with a pulse 1055 located near the center of the signal 1050.
- Figure 29B illustrates the resulting digital denoised signal 1060 output over bus 60 with pulse 1055 isolated and the noise eliminated.
- Embodiments of the present invention denoising system provide between 6 to 10 (not a theoretical limit) dB increase in overall RWR system sensitivity and dynamic detection range by reducing noise in the wide band input signal.
Abstract
Description
| Time | |||
| | Segments Coefficients | ||
| 1 | 2 | D1-D2, S1- | |
| 2 | 1 | DD1, SD1, DS1, SS1 |
| Time | ||||
| | Segs Coefficients | |||
| 1 | 16 | D1-D16, S1- | ||
| 2 | 8 | DD1-DD8, SD1-SD8, DS1-DS8, SS1- | ||
| 3 | 4 | DDD1-DDD4, SDD1-SDD4, DSD1-DSD4, SSD1-SSD4 DDS1-DDS4, SDS1-SDS4, DSS1-DSS4, SSS1-SSS4 | ||
| 4 | (HIGH) (BANDS) | 2 | DDDD1-DDDD2, SDDD1-SDDD2, DSDD1-DSDD2, SSDD1-SSDD2, DDSD1-DDSD2, SDSD1-SDSD2, DSSD1-DSSD2, SSSD1-SSSD2 | |
| 4 | (LOW) (BANDS) | 2 | DDDS1-DDDS2, SDDS1-SDDS2, DSDS1-DSDS2, SSDS1-SSDS2, DDSS1-DDSS2, SDSS1-SDSS2, DSSS1-DSSS2, SSSS1-SSSS2 | |
| 5 | (HIGH) (BANDS) | 1 | DDDDD1, SDDD1, DSDDD1, SSDDD1, DDSDD1, SDSDD1, DSSDD1, SSSDD1, DDDSD1, SDDSD1 DSDSD1, SSDSD1, DDSSD1, SDSSD1, DSSSD1 SSSSD1 | |
| 5 | (LOW) (BANDS) | 1 | DDDDS1, SDDDS1, DSDDS1, SSDDS1, DDSDS1, SDSDS1, DSSDS1, SSSDS1, DDDSS1, SDDSS1 DSDSS1, SSDSS1, DDSSS1, SDSSS1, DSSSS1, SSSSS1 |
Claims (17)
- In a radar warning receiver, a method for denoising an input wide band video signal window, said method comprising the steps of:a) selecting a plurality of wavelet basis functions that represent expected signal waveforms of said input wide band video signal window, each of said plurality of wavelet basis functions composed of values of either "1" or "-1";b) performing high speed real-time convolution of said input wide band video signal window against said plurality of wavelet basis functions to generate a plurality of correlation coefficients wherein groups of correlation coefficients share a common frequency resolution level, said step b) of performing high speed convolution being performed without multiplication functions to determine said plurality of correlation coefficients;c) thresholding said plurality of correlation coefficient to select those correlation coefficients that most efficiently package the energy of the input wide band video signal window;d) discarding correlation coefficients not thresholded by step c); ande) generating a denoised version of said input wide band video signal window by performing a high speed real-time wavelet reconstruction based on correlation coefficients thresholded by step c).
- A method as described in Claim 1 wherein said plurality of wavelet basis functions are Haar wavelet basis functions and wherein said high speed real-time convolution step b) operates based on an input wide band video signal window signal rate of 64 MHz.
- In a radar warning receiver (RWR), a method for denoising an input analog signal, said method comprising the steps of:a) converting said input analog signal into an input digital signal, said input digital signal having sample windows, each sample window comprising x discrete sample points;b) convolving said sample window with selected wavelet basis functions across n frequency resolution levels to generate n sets of x correlation coefficients, each frequency resolution level generating x correlation coefficients;c) generating a set of n coefficient maps, one coefficient map for each frequency resolution level of said n frequency resolution levels;d) determining a best coefficient map of said n coefficient maps that most efficiently represents said x discrete sample points of said sample window and determining selected correlation coefficients of said best coefficient map;e) performing a retransformation of solely said selected correlation coefficients of said best coefficient map to reconstruct an output denoised digital signal; andf) converting said output denoised digital signal into an output denoised analog signal.
- A method as described in Claim 3 further comprising the step of applying said output denoised analog signal to an RWR video pulse processor for threat characterization.
- A method as described in Claim 3 where said step f) comprises the steps of:normalizing said output denoised digital signal to produce a normalized output denoised digital signal; andusing a digital to analog converter circuit to convert said normalized output denoised digital signal into said output denoised analog signal.
- A radar warning receiver (RWR) system comprising:a wide band receiver for receiving an analog signal;an analog to digital converter circuit for converting said analog signal into an input digital signal;a processor system coupled to receive said input digital signal in sample windows, each sample window comprising x discrete sample points, said processor system for performing the steps of:a) convolving said sample window with selected wavelet basis functions across n frequency resolution levels to generate n sets of x correlation coefficients, each frequency resolution level generating x correlation coefficients;b) generating a set of n coefficient maps, one coefficient map for each frequency resolution level of said n frequency resolution levels;c) determining a best coefficient map of said n coefficient maps that most efficiently represents said x discrete sample points of said sample window and determining selected correlation coefficients of said best coefficient map;d) performing a retransformation of solely said selected correlation coefficients of said best coefficient map to reconstruct an output denoised digital signal; ande. a digital to analog converter coupled to said processor system for converting said output denoised digital signal into an output denoised analog signal.
- An RWR system as described in Claim 6 further comprising an RWR pulse processor coupled to receive said output denoised analog signal, said RWR pulse processor for performing threat characterization.
- An RWR system as described in Claim 6 where said step d) comprises the step of normalizing said output denoised digital signal.
- A method for denoising an input digital signal, said method comprising the computer implemented steps a) through e) set forth below or a system for denoising an input digital signal, said system comprising a processor coupled to a bus and a computer readable memory unit coupled to said bus, said computer readable memory unit containing a program for causing said processor to perform the steps a) through e) set forth below:a) sampling said input digital signal into sample windows, each sample window comprising x discrete sample points;b) convolving said sample window with selected wavelet basis functions across n frequency resolution levels to generate n sets of x correlation coefficients, each frequency resolution level generating x correlation coefficients;c) generating a set of n coefficient maps, one coefficient map for each frequency resolution level of said n frequency resolution levels;d) determining a best coefficient map of said n coefficient maps that most efficiently represents said x discrete sample points of said sample window; ande) recording selected correlation coefficients of said best coefficient map.
- The method or system as described in Claim 9 wherein said processor further performs the step of performing a retransformation of said selected correlation coefficients of said best coefficient map to reconstruct an output denoised digital signal.
- The method or system as described in Claim 10 wherein said processor further performs the step of normalizing said output denoised digital signal to produce a normalized output denoised digital signal; and further comprising
a digital to analog converter circuit for converting said normalized output denoised digital signal into an output denoised analog signal. - The method or system as described in Claim 9 wherein said processor further performs the step of generating a digital report based on said selected correlation coefficients, said digital report including a leading edge pulse time and a pulse peak amplitude.
- The method or system as described in Claims 3, 6, or 9 wherein each frequency resolution level, r, comprises 2r separate frequency bands, each frequency band associated with a wavelet basis function and wherein said step b) in claims 3 or 9 or step a) in claim 6 further comprises the step of performing n separate frequency resolution level convolution processes, each convolution process of a level, r, convolving 2r wavelet basis functions with discrete sample points of said sample window to generate a set of x correlation coefficients of said level, r.
- The method or system as described in Claim 13 wherein each frequency resolution level convolution process of a level, r, convolves said 2r wavelet basis functions across x/2r time segments of said sample window to generate said set of x correlation coefficients of said level, r.
- The method or system as described in Claim 9 wherein said step c) comprises or the system of claim 6 wherein the said step b) comprises the steps of:ranking said set of x correlation coefficients for each frequency resolution level in order of magnitude to produce said set of n coefficient maps; andfor each coefficient map of said n coefficient maps, determining correlation coefficients that fall within a determined threshold, wherein said selected coefficients are selected by said above step of determining correlation coefficients that fall within said determined threshold.
- The method or system as described in Claim 9 wherein said step d) comprises or the system of claim 6 wherein said step c) comprises the steps of:determining a drop-off value of coefficient magnitude for each of said n coefficient maps; andselecting said best coefficient map as that coefficient map of said n coefficient maps having a sharpest drop-off value.
- The method or system as described in Claim 9 wherein x is equal to or less than 32 and n is equal to or less than 5.
Applications Claiming Priority (2)
| Application Number | Priority Date | Filing Date | Title |
|---|---|---|---|
| US675682 | 1984-11-28 | ||
| US08/675,682 US5781144A (en) | 1996-07-03 | 1996-07-03 | Wide band video signal denoiser and method for denoising |
Publications (3)
| Publication Number | Publication Date |
|---|---|
| EP0816863A2 true EP0816863A2 (en) | 1998-01-07 |
| EP0816863A3 EP0816863A3 (en) | 1999-04-14 |
| EP0816863B1 EP0816863B1 (en) | 2004-06-02 |
Family
ID=24711547
Family Applications (1)
| Application Number | Title | Priority Date | Filing Date |
|---|---|---|---|
| EP97304809A Expired - Lifetime EP0816863B1 (en) | 1996-07-03 | 1997-07-02 | A wide band video denoiser and method for denoising |
Country Status (5)
| Country | Link |
|---|---|
| US (1) | US5781144A (en) |
| EP (1) | EP0816863B1 (en) |
| CA (1) | CA2209453C (en) |
| DE (1) | DE69729349T2 (en) |
| SG (1) | SG66377A1 (en) |
Cited By (3)
| Publication number | Priority date | Publication date | Assignee | Title |
|---|---|---|---|---|
| EP0987882A2 (en) * | 1998-09-18 | 2000-03-22 | Techno Link Co., Ltd. | Interlace noise filter |
| WO2000077675A1 (en) * | 1999-06-10 | 2000-12-21 | Koninklijke Philips Electronics N.V. | Interference suppression for measuring signals with periodic wanted signal |
| RU2474842C1 (en) * | 2011-08-03 | 2013-02-10 | Федеральное государственное военное образовательное учреждение высшего профессионального образования "Военный авиационный инженерный университет" (г. Воронеж) Министерства обороны Российской Федерации | Simple impulse signal receiver |
Families Citing this family (16)
| Publication number | Priority date | Publication date | Assignee | Title |
|---|---|---|---|---|
| US7054453B2 (en) * | 2002-03-29 | 2006-05-30 | Everest Biomedical Instruments Co. | Fast estimation of weak bio-signals using novel algorithms for generating multiple additional data frames |
| US7054454B2 (en) | 2002-03-29 | 2006-05-30 | Everest Biomedical Instruments Company | Fast wavelet estimation of weak bio-signals using novel algorithms for generating multiple additional data frames |
| US7424463B1 (en) * | 2004-04-16 | 2008-09-09 | George Mason Intellectual Properties, Inc. | Denoising mechanism for speech signals using embedded thresholds and an analysis dictionary |
| US7653255B2 (en) | 2004-06-02 | 2010-01-26 | Adobe Systems Incorporated | Image region of interest encoding |
| US7548853B2 (en) * | 2005-06-17 | 2009-06-16 | Shmunk Dmitry V | Scalable compressed audio bit stream and codec using a hierarchical filterbank and multichannel joint coding |
| US7336219B1 (en) * | 2005-12-30 | 2008-02-26 | Valeo Raytheon Systems, Inc. | System and method for generating a radar detection threshold |
| US8831111B2 (en) * | 2006-05-19 | 2014-09-09 | The Hong Kong University Of Science And Technology | Decoding with embedded denoising |
| US8369417B2 (en) | 2006-05-19 | 2013-02-05 | The Hong Kong University Of Science And Technology | Optimal denoising for video coding |
| PL2208085T3 (en) * | 2007-09-20 | 2013-08-30 | Grieshaber Vega Kg | Detailfunction based measurement |
| US8050414B2 (en) * | 2008-10-16 | 2011-11-01 | Gas Technology Institute | Robust pipe-strike pulse detector |
| DE102009025541B3 (en) * | 2009-06-19 | 2011-02-10 | Plath Gmbh | Device for removal and reduction of broadband noise, during signal reprocessing of spectrum of broad band detector, has determination device determining significance of spectral line based on comparison of power values with parameter |
| US9279883B2 (en) | 2013-02-19 | 2016-03-08 | Infineon Technologies Ag | Method and device for radar applications |
| CN110882378A (en) * | 2018-09-10 | 2020-03-17 | 上海清流生物医药科技有限公司 | Application of protein in preparing medicament for preventing and treating atherosclerosis and complications |
| CN109669182B (en) * | 2018-12-05 | 2022-05-17 | 南京邮电大学 | Passive bistatic SAR moving/static target joint sparse imaging method |
| WO2021108729A1 (en) * | 2019-11-27 | 2021-06-03 | Flir Commercial Systems, Inc. | Radar data denoising systems and methods |
| CN113747488B (en) * | 2021-07-29 | 2024-01-30 | 电信科学技术第五研究所有限公司 | Method and system for detecting and counting broadband spectrum signals in real time based on environmental noise |
Citations (2)
| Publication number | Priority date | Publication date | Assignee | Title |
|---|---|---|---|---|
| US5124930A (en) * | 1989-03-03 | 1992-06-23 | Thomson-Csf | Method for analyzing a signal by wavelets |
| US5179542A (en) * | 1991-12-31 | 1993-01-12 | Raytheon Company | Signal processor |
Family Cites Families (4)
| Publication number | Priority date | Publication date | Assignee | Title |
|---|---|---|---|---|
| IL74887A (en) * | 1985-04-14 | 1989-06-30 | Dan Manor | Radar warning receiver |
| US5619998A (en) * | 1994-09-23 | 1997-04-15 | General Electric Company | Enhanced method for reducing ultrasound speckle noise using wavelet transform |
| US5497777A (en) * | 1994-09-23 | 1996-03-12 | General Electric Company | Speckle noise filtering in ultrasound imaging |
| US5699068A (en) * | 1996-05-28 | 1997-12-16 | The United States Of America As Represented By The Secretary Of The Navy | Doppler video signal conditioning circuit |
-
1996
- 1996-07-03 US US08/675,682 patent/US5781144A/en not_active Expired - Fee Related
-
1997
- 1997-07-02 DE DE69729349T patent/DE69729349T2/en not_active Expired - Lifetime
- 1997-07-02 CA CA002209453A patent/CA2209453C/en not_active Expired - Fee Related
- 1997-07-02 EP EP97304809A patent/EP0816863B1/en not_active Expired - Lifetime
- 1997-07-03 SG SG1997002357A patent/SG66377A1/en unknown
Patent Citations (2)
| Publication number | Priority date | Publication date | Assignee | Title |
|---|---|---|---|---|
| US5124930A (en) * | 1989-03-03 | 1992-06-23 | Thomson-Csf | Method for analyzing a signal by wavelets |
| US5179542A (en) * | 1991-12-31 | 1993-01-12 | Raytheon Company | Signal processor |
Non-Patent Citations (1)
| Title |
|---|
| NAOKI EHARA ET AL: "WEAK RADAR SIGNAL DETECTION BASED ON WAVELET TRANFORM" ELECTRONICS & COMMUNICATIONS IN JAPAN, PART III - FUNDAMENTAL ELECTRONIC SCIENCE, vol. 77, no. 8, 1 August 1994, pages 105-114, XP000503757 * |
Cited By (5)
| Publication number | Priority date | Publication date | Assignee | Title |
|---|---|---|---|---|
| EP0987882A2 (en) * | 1998-09-18 | 2000-03-22 | Techno Link Co., Ltd. | Interlace noise filter |
| EP0987882A3 (en) * | 1998-09-18 | 2003-05-28 | Techno Link Co., Ltd. | Interlace noise filter |
| WO2000077675A1 (en) * | 1999-06-10 | 2000-12-21 | Koninklijke Philips Electronics N.V. | Interference suppression for measuring signals with periodic wanted signal |
| US6654623B1 (en) * | 1999-06-10 | 2003-11-25 | Koninklijke Philips Electronics N.V. | Interference suppression for measuring signals with periodic wanted signals |
| RU2474842C1 (en) * | 2011-08-03 | 2013-02-10 | Федеральное государственное военное образовательное учреждение высшего профессионального образования "Военный авиационный инженерный университет" (г. Воронеж) Министерства обороны Российской Федерации | Simple impulse signal receiver |
Also Published As
| Publication number | Publication date |
|---|---|
| DE69729349T2 (en) | 2005-06-02 |
| AU2844197A (en) | 1998-01-15 |
| EP0816863B1 (en) | 2004-06-02 |
| EP0816863A3 (en) | 1999-04-14 |
| CA2209453A1 (en) | 1998-01-03 |
| SG66377A1 (en) | 1999-07-20 |
| CA2209453C (en) | 2005-01-11 |
| DE69729349D1 (en) | 2004-07-08 |
| AU727117B2 (en) | 2000-11-30 |
| US5781144A (en) | 1998-07-14 |
Similar Documents
| Publication | Publication Date | Title |
|---|---|---|
| EP0816863B1 (en) | A wide band video denoiser and method for denoising | |
| EP2390679B1 (en) | Automotive radar with radio-frequency interference avoidance | |
| US9729363B2 (en) | Frequency discriminator | |
| US9660772B2 (en) | Detecting and processing weak signals using an array of antennas | |
| JP2007529000A (en) | Direction detection | |
| RU2614038C1 (en) | Method and device for detecting search objects comprising metal contacts in nonlinear short-range radars | |
| AU2003282636A1 (en) | A method for detecting the presence of radar signal emitters, an electronic support measures unit and a system for determining the position and identity of said emitters | |
| EP1652052A2 (en) | Detection and identification of stable pri patterns using multiple parallel hypothesis correlation algorithms | |
| ES2729281T3 (en) | Processor for a radio receiver | |
| US7184493B1 (en) | Pulse sorting apparatus for frequency histogramming in a radar receiver system | |
| WO2006033676A2 (en) | Digital broadband frequency measurement | |
| US20160241253A1 (en) | Two-stage digital down-conversion of rf pulses | |
| US20050122256A1 (en) | Signal analysis | |
| Singh et al. | Digital receiver-based electronic intelligence system configuration for the detection and identification of intrapulse modulated radar signals | |
| AU2305601A (en) | A wide band video signal denoiser and method for denoising | |
| US9983317B2 (en) | Signal processing device and radiation measurement device | |
| US7206707B1 (en) | Wideband digital IFM receiver | |
| US6700537B2 (en) | Method for calibrating a wideband direction finding system | |
| US20220317276A1 (en) | Radar signal processing device, radar system, and signal processing method | |
| WO2018207444A1 (en) | Target detection device and target detection method | |
| US10680669B2 (en) | Frequency discriminator | |
| Shaw et al. | Angle of arrival detection using compressive sensing | |
| EP1172935A1 (en) | Method and apparatus for performing analog-to-digital conversion using previous signal sample(s) | |
| JP2007047112A (en) | Radar system | |
| US20090240434A1 (en) | Lightning detection |
Legal Events
| Date | Code | Title | Description |
|---|---|---|---|
| PUAI | Public reference made under article 153(3) epc to a published international application that has entered the european phase |
Free format text: ORIGINAL CODE: 0009012 |
|
| AK | Designated contracting states |
Kind code of ref document: A2 Designated state(s): DE FR GB |
|
| PUAL | Search report despatched |
Free format text: ORIGINAL CODE: 0009013 |
|
| AK | Designated contracting states |
Kind code of ref document: A3 Designated state(s): AT BE CH DE DK ES FI FR GB GR IE IT LI LU MC NL PT SE |
|
| 17P | Request for examination filed |
Effective date: 19991006 |
|
| AKX | Designation fees paid |
Free format text: DE FR GB |
|
| 17Q | First examination report despatched |
Effective date: 20020719 |
|
| GRAP | Despatch of communication of intention to grant a patent |
Free format text: ORIGINAL CODE: EPIDOSNIGR1 |
|
| GRAS | Grant fee paid |
Free format text: ORIGINAL CODE: EPIDOSNIGR3 |
|
| GRAA | (expected) grant |
Free format text: ORIGINAL CODE: 0009210 |
|
| AK | Designated contracting states |
Kind code of ref document: B1 Designated state(s): DE FR GB |
|
| REG | Reference to a national code |
Ref country code: GB Ref legal event code: FG4D |
|
| REF | Corresponds to: |
Ref document number: 69729349 Country of ref document: DE Date of ref document: 20040708 Kind code of ref document: P |
|
| ET | Fr: translation filed | ||
| PLBE | No opposition filed within time limit |
Free format text: ORIGINAL CODE: 0009261 |
|
| STAA | Information on the status of an ep patent application or granted ep patent |
Free format text: STATUS: NO OPPOSITION FILED WITHIN TIME LIMIT |
|
| 26N | No opposition filed |
Effective date: 20050303 |
|
| PGFP | Annual fee paid to national office [announced via postgrant information from national office to epo] |
Ref country code: FR Payment date: 20100805 Year of fee payment: 14 Ref country code: DE Payment date: 20100723 Year of fee payment: 14 |
|
| PGFP | Annual fee paid to national office [announced via postgrant information from national office to epo] |
Ref country code: GB Payment date: 20100722 Year of fee payment: 14 |
|
| GBPC | Gb: european patent ceased through non-payment of renewal fee |
Effective date: 20110702 |
|
| REG | Reference to a national code |
Ref country code: FR Ref legal event code: ST Effective date: 20120330 |
|
| PG25 | Lapsed in a contracting state [announced via postgrant information from national office to epo] |
Ref country code: DE Free format text: LAPSE BECAUSE OF NON-PAYMENT OF DUE FEES Effective date: 20120201 Ref country code: FR Free format text: LAPSE BECAUSE OF NON-PAYMENT OF DUE FEES Effective date: 20110801 |
|
| REG | Reference to a national code |
Ref country code: DE Ref legal event code: R119 Ref document number: 69729349 Country of ref document: DE Effective date: 20120201 |
|
| PG25 | Lapsed in a contracting state [announced via postgrant information from national office to epo] |
Ref country code: GB Free format text: LAPSE BECAUSE OF NON-PAYMENT OF DUE FEES Effective date: 20110702 |