EP1350470B1 - Image processing device and ultrasonic diagnostic device - Google Patents
Image processing device and ultrasonic diagnostic device Download PDFInfo
- Publication number
- EP1350470B1 EP1350470B1 EP03006727A EP03006727A EP1350470B1 EP 1350470 B1 EP1350470 B1 EP 1350470B1 EP 03006727 A EP03006727 A EP 03006727A EP 03006727 A EP03006727 A EP 03006727A EP 1350470 B1 EP1350470 B1 EP 1350470B1
- Authority
- EP
- European Patent Office
- Prior art keywords
- image
- image data
- synchronization signal
- unit
- information
- Prior art date
- Legal status (The legal status is an assumption and is not a legal conclusion. Google has not performed a legal analysis and makes no representation as to the accuracy of the status listed.)
- Expired - Fee Related
Links
Images


Classifications
-
- G—PHYSICS
- G06—COMPUTING; CALCULATING OR COUNTING
- G06T—IMAGE DATA PROCESSING OR GENERATION, IN GENERAL
- G06T7/00—Image analysis
- G06T7/20—Analysis of motion
-
- A—HUMAN NECESSITIES
- A61—MEDICAL OR VETERINARY SCIENCE; HYGIENE
- A61B—DIAGNOSIS; SURGERY; IDENTIFICATION
- A61B8/00—Diagnosis using ultrasonic, sonic or infrasonic waves
-
- A—HUMAN NECESSITIES
- A61—MEDICAL OR VETERINARY SCIENCE; HYGIENE
- A61B—DIAGNOSIS; SURGERY; IDENTIFICATION
- A61B6/00—Apparatus for radiation diagnosis, e.g. combined with radiation therapy equipment
- A61B6/54—Control of apparatus or devices for radiation diagnosis
- A61B6/541—Control of apparatus or devices for radiation diagnosis involving acquisition triggered by a physiological signal
-
- Y—GENERAL TAGGING OF NEW TECHNOLOGICAL DEVELOPMENTS; GENERAL TAGGING OF CROSS-SECTIONAL TECHNOLOGIES SPANNING OVER SEVERAL SECTIONS OF THE IPC; TECHNICAL SUBJECTS COVERED BY FORMER USPC CROSS-REFERENCE ART COLLECTIONS [XRACs] AND DIGESTS
- Y10—TECHNICAL SUBJECTS COVERED BY FORMER USPC
- Y10S—TECHNICAL SUBJECTS COVERED BY FORMER USPC CROSS-REFERENCE ART COLLECTIONS [XRACs] AND DIGESTS
- Y10S128/00—Surgery
- Y10S128/916—Ultrasound 3-D imaging
Definitions
- the present invention relates to image display devices such as a ultrasonic diagnostic device and CT (Computerized Tomography) and particularly to image processing technology to a tomographic image obtained by irradiating an examined object with ultrasound, X rays and the like.
- image display devices such as a ultrasonic diagnostic device and CT (Computerized Tomography) and particularly to image processing technology to a tomographic image obtained by irradiating an examined object with ultrasound, X rays and the like.
- a image display device irradiates an anatomy (a test subject) with a diagnostic signal (hereafter called “signal”) such as the ultrasound and the X rays, receives a signal reflected from the anatomy or a signal passing through the anatomy and executes imaging of the inside of the anatomy based on the received signal.
- a diagnostic signal such as the ultrasound and the X rays
- the image display device is widely used in an industry field and a clinical medicine field.
- Representative examples of such devices are an ultrasonic diagnostic device using a reflected signal and a CT device using a signal that passes through.
- These image display devices can measure the anatomy and execute the imaging in real time with the performance of a calculating machine, especially the processing speed, improving. Especially, in the clinical medicine field that needs high time resolution starting from circulatory organs, since a tomographic image of the anatomy is provided in real time, it is possible to diagnose an affected part and the like actively.
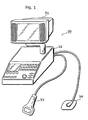
- Fig. 1 is an outside view of a conventional ultrasonic diagnostic device 50.
- the ultrasonic diagnostic device 50 is made up of a display device 51, a main unit 52, a probe 53 and an electrode for electrocardiogram (ECG) 54.
- ECG electrocardiogram
- the display device 51 is a display device with a liquid crystal, CRT (cathode-ray tube) or the like to display a tomographic image obtained by echography or the like and necessary information. It has a touch panel and the like to accept an input from an operator.
- CTR cathode-ray tube
- the main unit 52 includes a send/receive circuit that controls transmission/reception of the ultrasound through the probe 53, a signal/image processing circuit made up of a DSP (Digital Signal Processor), RAM (Random Access Memory) and the like and a liquid crystal display that has a group of switches, a mouse and a touch panel to accept the input from the operator. Additionally, the main unit 52 receives an ECG signal through the electrode for ECG 54.
- a send/receive circuit that controls transmission/reception of the ultrasound through the probe 53
- a signal/image processing circuit made up of a DSP (Digital Signal Processor), RAM (Random Access Memory) and the like and a liquid crystal display that has a group of switches, a mouse and a touch panel to accept the input from the operator. Additionally, the main unit 52 receives an ECG signal through the electrode for ECG 54.
- DSP Digital Signal Processor
- RAM Random Access Memory
- the probe 53 is a search unit made up of an ultrasound vibrator, an acoustic lens and the like to send/receive the ultrasound.
- the conventional ultrasonic diagnostic device 50 acquires the ECG signal as a synchronization signal from the test object through the electrode for ECG 54.
- the ultrasonic diagnostic device since the above-mentioned synchronization signal is inputted into the ultrasonic diagnostic device through the special-purpose electrode for ECG 54, the ultrasonic diagnostic device needs a special-purpose circuit and a special-purpose cable and therefore the cost for diagnosis becomes high and at the same time space to set up an external device is necessary.
- the European patent application EP 1 061 474 discloses a computer tomograph which is able to reconstruct images of an object retrospectively based on recorded spiral scanning data of this object and which can calculate information about the object movement contours and phases from the measured data without additional information such as ECG signal.
- the movement phase-correlated reconstruction of the images is carried on by analyzing a kymogram function from the spiral data or by using volume reconstruction including phase correlation.
- the first object of the present invention to provide an image processing device or an ultrasonic diagnostic device that makes an examination using a synchronization signal possible without inputting a synchronization signal from outside. Further, it is the second object of the present invention to provide a display method for making it easy to understand the correspondence between an extracted synchronization signal and a displayed tomographic image.
- a synchronization signal is generated from the acquired tomographic image (a synchronization signal is obtained without inputting an electrocardiogram (ECG) signal and the like from outside), it becomes possible to execute a diagnosis and a display to an examined object that acts cyclically focusing on a synchronous tomographic image.
- ECG electrocardiogram
- the image processing device further comprises: a synchronization information addition unit operable to discriminate a phase timing by which individual image data is sampled in the sequence of image data based on the generated synchronization signal and add synchronization information that indicates phase timings are same in plural image data.
- a synchronization information addition unit operable to discriminate a phase timing by which individual image data is sampled in the sequence of image data based on the generated synchronization signal and add synchronization information that indicates phase timings are same in plural image data.
- the image processing device further comprises: a bloodstream information calculation unit operable to generate bloodstream information that represents physical characteristics of bloodstream based on sampled data by a timing that has a predetermined relationship with sampling timing in the image acquisition unit; a bloodstream image generation unit operable to generate image data of a bloodstream image based on the generated bloodstream information; and a correspondence unit operable to associate image data of the tomographic image to which the synchronization information is added with image data of the bloodstream image based on the synchronization signal.
- a bloodstream information calculation unit operable to generate bloodstream information that represents physical characteristics of bloodstream based on sampled data by a timing that has a predetermined relationship with sampling timing in the image acquisition unit
- a bloodstream image generation unit operable to generate image data of a bloodstream image based on the generated bloodstream information
- a correspondence unit operable to associate image data of the tomographic image to which the synchronization information is added with image data of the bloodstream image based on the synchronization signal.
- a synchronization signal is generated form the acquired tomographic image and a color Doppler image such as blood stream is displayed based on this synchronization signal, it becomes possible to associate an ordinary tomographic image with a color Doppler image that have a temporally determined relationship and to display the associated images.
- the ultrasonic diagnostic device is an ultrasonic diagnostic device that generates and displays a tomographic image of an object that acts cyclically comprising: an image acquisition unit operable to acquire a sequence of image data of a tomographic image by sampling at a constant rate during a predetermined time that is one cycle or more; a characteristic value extraction unit operable to extract in sequence characteristic values that change with a passage of time based on the acquired sequence of image data; a synchronization signal generation unit operable to generate a synchronization signal that indicates a timing of the same phase in the cyclical action based on the extracted characteristic values; a synchronization information addition unit operable to discriminate a phase timing by which individual image data is sampled in the sequence of image data based on the generated synchronization signal and add synchronization information that indicates phase timings are same in plural image data; and a display unit operable to display a tomographic image based on the synchronous image data to which the synchronization information is added.
- a synchronization signal is generated from the acquired tomographic image (a synchronization signal is obtained without inputting an ECG signal and the like from outside), it becomes possible to execute a diagnosis and a display to an examined object that acts cyclically focusing on a synchronous tomographic image.
- a synchronization signal that is conventionally generated by an external device, an ultrasonic diagnosis device that can execute a simpler diagnosis at a lower cost can be realized.
- the present invention can be realized as an image processing method having the characteristic units of the above-mentioned image processing device and the ultrasonic diagnostic device as steps and the present invention can be realized as a program including all of these steps.
- the program not only can be stored in ROM and the like that the image processing device and the ultrasonic diagnostic device include but also can be distributed through a recording medium such as CD-ROM or transmission medium such as communication network.
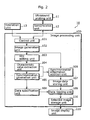
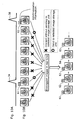
- Fig. 3 is a block diagram that shows a functional configuration of an ultrasonic diagnostic device 10 according to the first embodiment.
- the present device 10 is an ultrasonic diagnostic device that has a function that generates a synchronization signal from an acquired tomographic image and includes an ultrasonic search unit 11, a send/receive unit 12, an operation unit 13, an image processing unit 100 and an image display unit 111.
- the ultrasonic search unit 11 is generally called a probe and for example a probe that performs electronic scan based on the phased array method.
- the ultrasonic search unit 11 emits ultrasound (e.g., ultrasonic pulse) based on a control signal received from the send/receive unit 12. Further, the search unit 11 also receives ultrasound (hereafter called "ultrasonic echo") reflected from inside the living body of the test object (hereafter, also called “patient”), converts the ultrasonic echo into an electric signal, and sends the electric signal to the send/receive unit 12.
- ultrasound hereafter called "ultrasonic echo”
- the send/receive unit 12 is made up of a sender/beam former that has the ultrasonic search unit 11 generate ultrasound and a receiver/beam former that receives an electric signal from the search unit 11 that has detected an ultrasonic echo.
- the send/receive unit 12 processes the electric signal received from the ultrasonic search unit 11 such as by amplifying it, and sends the processed electric signal to the image processing unit 100.
- the operation unit 13 is equipped with a switch, a touch panel and the like, receives an input from the operator to them and sends a control signal corresponding to the received input to the image processing unit 100.
- the image processing unit 100 Based on the electric signal from the send/receive unit 12, the image processing unit 100 generates image data of a tomographic image. Further, based on a change of characteristic value (such as a volume and a cross section area of the left ventricle of the heart), the image processing unit 100 generates the synchronization signal.
- the "image data” refers to data such as two-dimensional brightness data. The image data are generated each time the ultrasonic search unit 11 executes one scan, and are displayed in B mode.
- This image processing unit 100 is made up of a control unit 101, an image generation unit 102, an ROI (Region of Interest) setting unit 103, a characteristic value extraction unit 104, a synchronization generation unit 105, a synchronization information addition unit 106, an image data storage unit 107, a data specification unit 108, a data reading unit 109 and an selected image storage unit 110.
- the control unit 101 is, for example, a microcomputer equipped with ROM (Read-Only Memory), RAM (Random Access Memory) and the like, instructs each unit in the image processing unit 100 to execute its own processing, and controls timing of the processing.
- the control unit 101 controls the send/receive unit 12 that sends an ultrasound and receives an ultra sound echo, and receives and decrypts a control signal and the like sent by the operation unit 13. Further, the control unit 101 sends an electric signal converted from an ultrasound echo that the control unit 101 has received from the send/receive unit 12 to the image generation unit 102.
- the image generation unit 102 first receives an electric signal from the send/receive unit 12 through the control unit 101. The image generation unit 102 then executes an amplified calculation, analog-to-digital (A/D) conversion and an interpolation calculation on the received electric signal to generate image data of a tomographic image.
- A/D analog-to-digital
- the ROI (Region of Interest) setting unit 103 sets a Region of Interest (ROI) that is a calculation object of the characteristic value to the generated tomographic image and further extracts a contour of the object in this ROI.
- ROI Region of Interest
- plural tomographic images are acquired in chronological order and the ROIs are set for these tomographic images individually.
- Fig. 3 is a diagram that shows an example of a method for setting an ROI in a tomographic image by the ROI setting unit 103.
- a tomographic image of a heart is projected and the left ventricle is set as an ROI.
- an area surrounded by a square 21 is the outer frame of an observational monitor in the image display unit 111 that will be explained later; the fan-shaped part shown by oblique lines inside the outer frame is a whole tomographic image projected by the ultrasonic diagnostic device 10; curves 23 and 24 projected by black thin lines are the contour of the heart; and the inner part surrounded by a black thick curve 25 is the ROI (here, the left ventricle of the heart).
- the characteristic value extraction unit 104 extracts or calculates characteristic values (such as a volume and a cross-section of the left ventricle of the heart) of the ROI of the tomographic image specified by the ROI setting unit 103.
- characteristic values such as a volume and a cross-section of the left ventricle of the heart
- the radius of the object is calculated from the tomographic image and the left ventricular volume (LVV) of the heart is calculated by substituting the calculated radius into an approximate expression such as the single plane area length method and the Modified Simpson method.
- the synchronization generation unit 105 generates a synchronization signal (e.g. a waveform like an R wave in ECG waveform) based on the extracted characteristic value. For example, there is a method for generating the synchronization signal at the time when the LVV becomes the smallest or a method for generating the synchronization signal that coincides with the change of the LVV (e.g. the R wave of pseudo ECG waveform).
- a synchronization signal e.g. a waveform like an R wave in ECG waveform
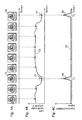
- Fig. 4A ⁇ Fig. 4C are diagrams that show an example of a method for generating the synchronization signal based on the characteristic value extracted by the characteristic value extraction unit 104.
- Fig. 4A is a diagram that lines up the acquired tomographic image examples in chronological order. Based on each tomographic image in Fig. 4A, the LVV of the heart V, an example of the characteristic value, is calculated (and represented by ⁇ ).
- Fig. 4B is a graph that represents this by a curve (hereafter called a "left ventricular volume (LVV) curve"). In Fig. 4B, the vertical axis represents the left ventricular volume V and the horizontal axis represents time t.
- LVV left ventricular volume
- spline interpolation or polynomial expression interpolation (the interpolation curve in this case is represented by (the number of the points -1) degree of polynomial expression) is executed to the calculated LVV of the heart V to generate the LVV curve 33.
- Fig. 4C is a diagram that shows an example of the generated synchronization signal based on the LVV curve 33.
- the extreme value of the LVV curve 33 is detected (in this case, the minimum values 32 and 37)
- the synchronization pulses 34, 38 e.g. triangular wave pulse
- the example using the LVV of the heart as the characteristic value is shown but it is possible to use, for example, the movement of the beating blood vessel wall without modification or the change in the diameter of the blood vessel as the characteristic value.
- the synchronization generation unit 105 it is acceptable to construct the synchronization generation unit 105 to generate an ECG waveform that is closer to the real ECG waveform artificially.
- the synchronization signal that corresponds to the ECG waveform is generated based on the activity of the left ventricle of the heart.
- the ECG waveform shows change of active potential of cardiac muscles in action.
- Medical Electronic Measurement written by Mr. Hiroshi Yagi and published by Sangyo Tosho Publishing Co., Ltd.
- the constriction of a heart is produced by electric conduction of nerve or neuroid muscle fiber as a trigger.
- the activity of a heart has a close link with the ECG waveform; by monitoring the activity of the heart, it is possible to estimate the ECG waveform and to generate the ECG waveform artificially.
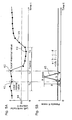
- Fig. 5A and Fig. 5B are diagrams that explain a method for generating a synchronization signal corresponding to an ECG waveform artificially.
- Fig. 5A is an example of the LVV curve.
- Fig. 5B is an example of a pseudo R wave that is generated based on the activity of the left ventricle of the heart (the LVV curve) and that corresponds to the R wave in the ECG waveform.
- the timing when the R wave appears is about 0.05 second before the left ventricle starts the constriction and this is exactly the halfway the time that represents the local minimal value 41 and the local maximal value 42 (the time is T3 and T4, respectively) just before the left ventricle of the heart enters the systole in the LVV curve 33. Consequently, from the LVV curve 33, the minimum value 43 and its time T5 are specified; the local maximal value 42 just before the minimum value 43 and its time T4 are specified; and further the local minimal value 41 just before the local maximal value 42 and its time T3 are specified.
- Fig. 5B is a concrete example for the shape of the pseudo R wave generated by the synchronization generation unit 105.
- One is the method for generating the pseudo R wave non-real time after the tomographic images are acquired for a predetermined time (e.g. about 10 seconds) in advance.
- a predetermined time e.g. about 10 seconds
- the ROI is set; the contour is extracted; and the LVV curve 33 is obtained by the extracted contour and the plural tomographic images.
- the time T3 and T4 are specified from this LVV curve 33 with the above-mentioned procedures and the pseudo R wave is generated in the middle of these two times.
- the other is the method for generating the pseudo R wave in real time.
- the pseudo R wave is generated by making the predetermined frames (e.g. 10 frames) one set.
- the LVV curve 33 is partially obtained by setting the ROI and extracting the contour.
- the times T3 and T4 are specified by going back from the time.
- the pseudo R wave is generated in the middle of these two times. Going about the case of 30 [fps], for example, it takes at least 330[ms] to generate a pulse of the pseudo R wave and therefore there is a delay but since there is the time of 33 [ms] between the frames, it is possible to follow the actual activity of the heart.
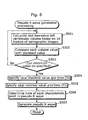
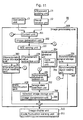
- Fig. 6 is a flowchart that shows "the process to generate the pseudo R wave" in the case of generating the pseudo R wave in real time.
- the image generation unit 102 For a start, the image generation unit 102 generates 10 frames of the tomographic image. Based on them, the characteristic value extraction unit 104 calculates the LVV and memorizes it temporarily (S501). Next, the synchronization generation unit 105 compares each volume value with the standard value (Vs) that is set in advance (S502) and judges whether the minimum value is specified or not (S503). When the synchronization generation unit 105 can specify the minimum value (S503: Yes), it specifies the local maximal value, the local minimal value and each time (T4 and T3) (S504 and S505).
- the image generation unit 102 generates the next 10 frames of the tomographic image and the same process as the above is executed to them.
- the synchronization information addition unit 106 associates the generated characteristic value and synchronization signal information with the timing when the image data is generated and stores the associated image data in the image data storage unit 107.
- the image data storage unit 107 is, for example, a memory unit made up of RAM and the like and has a capacity of several dozen to several hundred M bites.
- the image data storage unit 107 stores the image data associated with and added to the characteristic value (e.g. the volume of the left ventricle of the heart) and the synchronization information by the synchronization information addition unit 106.
- the data specification unit 108 specifies the information to select the image data that exist in the particular phase in the sequence of image data that changes cyclically or with certain regularity and send the information to the data reading unit 109.
- the data reading unit 109 reads the applicable image data from the image data storage unit 107 and sends the image data to the selected image storage unit 110.
- the selected image storage unit 110 is frame memory or the like for the observational monitor of the image display unit 111 and stores the image data read by the data reading unit 109.
- the image display unit 111 reads the image data stored in the selected image storage unit 110 and displays the tomographic image in B mode or the like on a liquid crystal display or the like that is the observational monitor.
- the image display unit 111 has graphic accelerator, DSC (Digital Scan Converter) and the like.
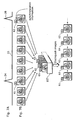
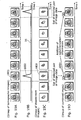
- Fig. 7A and Fig. 7B are diagrams that explain a functional overview of the ultrasonic diagnostic device 10 according to the first embodiment.
- Fig. 7A is a diagram that shows an example of the generated synchronization signal.
- Fig. 7B shows how the image data to which the synchronization information is added are stored and how only the image data to which the synchronization information is added are read in the ultrasonic diagnostic device 10 in schematic form.
- the synchronization information "R" is added to the image data by the synchronization information addition unit 106; the image data are stored in the image data storage unit 107; the data reading unit 109 reads only the image data to which the synchronization information "R" is added from the data storage unit 107.
- the synchronization information "R” is added to the tomographic image that causes to generate the synchronization pulse but it is acceptable only if this synchronization information can be uniquely specified. Additionally, it is acceptable to add the image data other than the image data to which the synchronization information "R” is added to other synchronization information such as "P" or "Q” and to add one piece of the image data to plural synchronization information. Further, it is also acceptable to add the characteristic value itself to each image data.
- the data reading unit 109 reads only the image data to which the synchronization information "R" (61 ⁇ 65 and the like) is added in sequence form the image data storage unit 107.
- the method for specifying the image data it is acceptable that the operator designates the synchronization information itself or it is acceptable to designate the image data n frames before or n frames after the image data to which the "R” is added. It is also acceptable to designate plural synchronization information such as the "R” and the "Q”, to read the image data to which the synchronization information is added in each cycle and to have the image display unit 111 display them at the same time.
- the timing to update the display it is acceptable to read automatically from the image data storage unit 107 at an appropriate time interval (e.g. an interval of one second) or to update the display manually when the operation unit 13 has a track ball and a keyboard (not illustrated).
- the ultrasonic diagnostic device 10 since the ultrasonic diagnostic device 10 according to the first embodiment generates the synchronization information from the acquired tomographic image, it is possible to extract the synchronous tomographic image and to diagnose the examined object based on the synchronous tomographic image without inputting the synchronization signal from the outside.
- the configuration that generates the pseudo R wave is explained in the first embodiment, it is acceptable to configure so as to generate the ECG waveform other than the R wave such as the P wave and the Q wave. Additionally, in the present embodiment, a practical example in which 10 frames' ultrasound images are acquired and the LLV is calculated based on them is explained, but it is needless to say that the number is not limited to 10.
- the control unit 101 applies X-rays and controls a X-rays detector.
- CT Computerized Tomography
- MRI Magnetic Resonance Imaging
- the control unit 101 controls the magnetic field and the pulse column of the measurement area and the detector.
- the object of the ROI is not limited to the left ventricle of the heart and its shape is also arbitrary.
- the method for setting the ROI is not limited to the above-mentioned method; it is acceptable to set the ROI by a method other than the above-mentioned method.
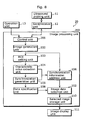
- Fig. 8 is a block diagram that shows the functional configuration of an ultrasonic diagnostic device 20 according to the second embodiment. While the ultrasonic diagnostic device 10 according to the first embodiment stores the tomographic image to which the synchronization information is added temporarily in the image data storage unit 107 and displays the synchronous tomographic image, the present device 20 displays the synchronous tomographic image more rapidly without storing the tomographic image to which the synchronization information is added temporarily.
- the configuration different from the first embodiment is explained placing the full weight; the common configuration is given the same numbers and the explanation is omitted.
- the ultrasonic diagnostic device 20 differs from the ultrasonic diagnostic device 10 in that the former newly includes an image data selection unit 202 in place of the image data storage unit 107 and the data reading unit 109.
- a control unit 201 controls the image data selection unit 202 newly in place of controlling the image data storage unit 107 and the data reading unit 109 in the first embodiment.
- the image data selection unit 202 selects the image data to which the synchronization information is added and that are designated by the data specification unit 108 and discards the image data other than that.
- the selected image data are sent to the selected image storage unit 110. For this reason, an observer can observe only the tomographic image in the arbitrary phase based on the synchronization signal real time similarly to the case of inputting the synchronization signal from the outside.
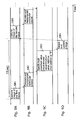
- Fig. 9 is a time chart that shows the flow of processing of each unit in the ultrasonic diagnostic device 20.
- Fig. 9A is a diagram that shows the contents of the processing in the image generation unit 102;
- Fig. 9B is a diagram that shows the contents of the processing in the characteristic value extraction unit 104;
- Fig. 9C is a diagram that shows the contents of the processing in the synchronization generation unit 105 and the synchronization information addition unit 106;
- Fig. 9D is a diagram that shows the contents of the processing in the image display unit 111.
- the image generation unit 102 generates the image data of the tomographic image based on an electric signal received through the send/receive unit 12 and the control unit 201 (S81).
- the characteristic value extraction unit 104 calculates and memorizes the characteristic value (e.g. the LVV of the heart and the like) based on the generated tomographic image (S82). Further, the synchronization generation unit 105 specifies the local maximum value, the local minimal value and the minimum value based on the extracted characteristic value and based on theses values, the synchronization information addition unit 106 executes the addition/non-addition of the synchronization information (e.g. the "R") (-). At this point, to specify the minimum value, it is necessary to compare the value of the LVV for a predetermined period (e.g. one cycle's period).
- a predetermined period e.g. one cycle's period
- the image display unit 111 selects only the image data to which the synchronization information is added and updates the display of the tomographic image based on the selected image data (S84).
- the similar processing is executed to the second frame and the following.
- Fig. 10A and Fig. 10B explain a functional overview of the ultrasonic diagnostic device 20 according to the second embodiment.
- Fig. 10A is a diagram that shows an example of the generated synchronization signal.
- Fig. 10B shows how only the image data to which the synchronization information is added are selected and the tomographic images are displayed in the ultrasonic diagnostic device 20 in schematic form.
- the ultrasonic diagnostic device 20 since the ultrasonic diagnostic device 20 according to the second embodiment is configured in order that the synchronization information is added to image data based on the generated synchronization signal and only the synchronous image data can be selected, it is possible to display the synchronous tomographic image without inputting the synchronization signal from the outside, reducing the capacity of memory.
- Fig. 11 is a block diagram that shows the functional configuration of an ultrasonic diagnostic device 30 according to the third embodiment.
- the present ultrasonic diagnostic device 30 executes a reduced display and a scroll display of the tomographic image and a warning notification when an abnormality about the characteristic value occurs. Further, the present device 30 displays the extracted characteristic value, the generated synchronization signal and the tomographic image at the same time in one screen.
- the ultrasonic diagnostic device 30 differs from the ultrasonic diagnostic device 10 in that the former newly includes a characteristic value storage unit 302, a characteristic value reading unit 303, a synchronization signal storage unit 306 and the synchronization signal reading unit 307 and has a cycle estimate unit 305 in the synchronization generation unit 304, an image compression unit 309 in the selected image storage unit 308 and a cycle fluctuation warning unit 311 in the image display unit 310.
- the control unit 301 has the same function as the control unit 201 of the second embodiment. In addition to this function, the control unit 301 instructs each unit to execute each processing and controls timings of the processing in order to execute the reduced display and the scroll display of the tomographic image and the warning notification when an abnormality about the characteristic value occurs. Additionally, the control unit 301 controls "image display processing" that is described later. Further, the control unit 301 accepts information that represents a reading start point and a reading finish point through the operation unit 13 and sends the information to the characteristic value reading unit 303 and the synchronization signal reading unit 307.
- the characteristic value storage unit 302 receives the characteristic value generated by the characteristic value extraction unit 104 and stores the characteristic value in sequence.
- the characteristic value reading unit 303 reads information of the characteristic value between the reading start point and the reading finish point stored in the characteristic value storage unit 302 and send the information to the image display unit 310.
- the synchronization generation unit 304 is newly equipped with the cycle estimate unit 305 in addition to the function of the synchronization generation unit 105 of the first embodiment.
- the cycle estimate unit 305 estimates the cycle of the synchronization signal by seeking an average value of the cycle of the generated synchronization signal and by executing statistical processing.
- the synchronization signal storage unit 306 stores the synchronization signal information generated by the synchronization generation unit 304.
- the synchronization signal reading unit 307 reads the synchronization signal information between the reading start point and the reading finish point stored in the synchronization signal storage unit 306 and send the synchronization signal information to the image display unit 310.
- the selected image storage unit 308 is newly equipped with the image compression unit 309 in addition to the same function as the selected image storage unit 110 of the first embodiment.
- the contents of the frame memory are updated every time the image data are sent from the image data selection unit 202; the new image data are overwritten in sequence; and it is possible to display always the latest tomographic images (in the case of Fig. 12B, 6 pieces).
- the image compression unit 309 captures the image data that the image data selection unit 202 sends to the selection image storage unit 308 temporarily, converts the image data to reduce the display size (e.g. pixel skipping) and stores again plural image data in the frame memory for one screen to display on the observational monitor of the selected image storage unit 110.
- reduce the display size e.g. pixel skipping
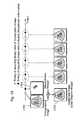
- Fig. 12A and Fig. 12B are diagrams that represent how the image data of the tomographic image are compressed by the image compression unit 309 in schematic form.
- Fig. 12A is a display example of the tomographic image when the image data are not compressed.
- Fig. 12B is an example that displays six tomographic images in one screen by compressing the image data to one sixth.
- the image compression unit 309 decides the data compression ratio by the screen size that the observational monitor 1100 in the image display unit 310 can display, the data size of the tomographic image and the number of the tomographic images to be displayed (namely m and n). Further, the image compression unit 309 makes it possible to display the plural pieces of the tomographic images that are acquired in succession by performing an interpolative calculation following the generally used sampling technique, seeking the coordinates of the pixels on the tomographic images after the compression and storing the image data in the frame memory that corresponds to the position the operator wants to display.
- the image display unit 310 is newly includes the cycle fluctuation warning unit 311 in addition to the function of the image display unit 111 of the first embodiment. Further, the image display unit 310 executes highlight processing and like to the tomographic image when it displays the latest tomographic image and thus makes it possible to tell easily which the latest tomographic image is.
- the cycle fluctuation warning unit 311 detects the abnormality by executing statistical processing such as an analysis using regular probability distribution and notifies the abnormality to the operator.
- statistical processing such as an analysis using regular probability distribution
- methods of notification there are a method for giving a beep as a warning signal and a method for displaying an abnormal area on the screen with a different color.
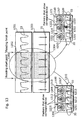
- Fig. 13 is an example that shows how the characteristic value and the synchronization signal are displayed by scrolling.
- the memory method of data in the characteristic value storage unit 302 and the synchronization signal storage unit 306 is a ring buffer or the similar structure; every time the characteristic value and the synchronization signal are generated coming up with the generation of the image data of the tomographic image, the characteristic value and the synchronization signal are overwritten and stored in sequence; in the case of finishing the storage up to the aftermost storage area, new information is written overwriting old information from the beginning of the storage area.
- the information of characteristic value and the synchronization signal of the image data within the area between "the reading start point” and “the reading finish point” received from the operator is written in the frame memory in the selected image storage unit 308. It is possible to change the positions of the reading start point and the reading finish point; the characteristic value and the synchronization signal are displayed to be scrolled with time. It is possible to display markers that enable the operator to tell at which timing the displayed characteristic value or the displayed synchronization signal is acquired.
- the observational monitor 1100 in Fig. 13 are displayed three pieces of tomographic images 1205 ⁇ 1207, the characteristic value (the LVV of the heart) curve 33 and the synchronization signal waveform 35 at the same time. Further, on this observational monitor 1100 are indicated the markers 1211 ⁇ 1213 that represents corresponding relationship between each synchronous tomographic image 1205 ⁇ 1207 in a different cycle and the characteristic value curve 33 as well as the synchronization signal waveform 35. On the observational monitor 1101 are indicated the markers 1221 ⁇ 1223 that represents corresponding relationship between each tomographic image 1215 ⁇ 1217 in a different phase in the same cycle and the characteristic value curve 33 as well as the synchronization signal waveform 35. In this case, with the marker 1222 at the center, the three consecutive tomographic images 1215 ⁇ 1217 in the different phase in the same cycle are indicated.
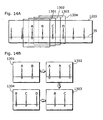
- Fig. 14A and Fig. 14B shows how the display area of the characteristic value storage unit 302 and the synchronization signal storage unit 306 is changing with time.
- the synchronization signal is explained.
- the explanation of the characteristic value is exactly alike.
- Fig. 14A is a diagram that shows an example of the processing method in the case of changing with time the display object of the synchronization signal and displaying the display object.
- Fig. 14B is a diagram that shows how the actual synchronization signals displayed by the method shown in Fig. 14A change.
- Fig. 14A shows how the reading position of the synchronization signal information stored in the synchronization signal storage unit 306 switches with time from Image 1 through Image 4 in numerical order.
- the synchronization signals displayed on the observational monitor of the image display unit 310 change as shown in Fig. 14B.
- the synchronization signals are displayed like a stream from right to left on the screen.
- Fig. 15 is a flowchart that shows "image display processing" in the control unit 301 of the ultrasonic diagnostic device 30.
- the display mode that is the control object
- the Display mode 1 is the mode for displaying the reduced tomographic image as shown in Fig. 12B.
- the Display mode 2 is the mode for displaying (1) the plural synchronous tomographic images in the different cycle, the characteristic value curve and the synchronization signal waveform or (2) the plural tomographic images of the different phase in the same cycle, the characteristic value curve and the synchronization signal waveform.
- the control unit 301 receives the type of the display mode from the operator.
- the control unit 301 instructs the data specification unit 108 to display six pieces of the tomographic images to which the synchronization information "R" is added.
- the image data selection unit 202 selects six frames (namely, n•m frames: n and m are natural numbers) of image data to which "R" is added and send them to the selected image storage unit 308 (S1402).
- the image compression unit 309 compresses the received image data to (1/n ⁇ m) and stores the compressed image data to the frame memory (S1403).
- the image display unit 310 displays the tomographic images based on the image data stored in the frame memory on the observational monitor (S1404).
- Fig. 16A and Fig. 16B show how the cycle estimate unit 305 monitors the cycle fluctuation based on the cycle estimated to the generated synchronization signal and notifies the warning when the abnormality is observed by the cycle fluctuation warning unit 311 in schematic form.
- Fig. 16A is a diagram that shows the generated normal synchronization signal waveform 35.
- Fig. 16B is a diagram that shows in schematic form how the cycle estimate unit 305 monitors the cycle fluctuation based on the cycle estimated to the generated synchronization signal and notifies the warning when the abnormality is observed.
- the cycle fluctuation warning unit 311 calculates the average value Tm of the generated synchronization signals; when the synchronization signal becomes shorter than this Tm by X% or longer than this Tm by X%, the cycle fluctuation warning unit 311 notifies the observer by a warning sound, changing the color of display or the like.
- the ultrasonic diagnostic device 30 is configured to comprise the cycle fluctuation warning unit 311 and to execute a warning notification when the cycle of the synchronization signals fluctuates; it is acceptable that the ultrasonic diagnostic device 30 is configured to comprise a characteristic value fluctuation warning unit and to execute a warning notification when the characteristic value fluctuates abnormally.
- the object whose fluctuation is detected is not the cycle; the maximum value, the minimum value and the difference between the maximum value and the minimum value of the LVV of the heart described above are the objects; using the average value of these values or the like, the characteristic value fluctuation warning unit monitors the ever-changing characteristic value and notifies by sounding a warning or the like when an abnormal value is detected.
- the ultrasonic diagnostic device 30 makes it possible to execute the reduced display and the scroll display of the tomographic image and the warning notification when the abnormality in the characteristic value occurs.
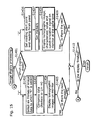
- Fig. 17 is a block diagram that shows the functional configuration of an ultrasonic diagnostic device 40 according to the fourth embodiment.
- the ultrasonic diagnostic device 40 differs from the ultrasonic diagnostic device 10 in that the former newly includes a bloodstream information calculation unit 402 that generates an image including the bloodstream information.
- the image including the bloodstream information hereafter called the bloodstream image
- the color Doppler is a bloodstream image that uses the Doppler effect of the ultrasound by a moving reflection (a group of red blood cells in the case of bloodstream), overlaps two-dimensional distribution such as bloodstream information of a heart or a blood vessel on the tomographic image of the tissue, and displays the overlapped image in colors in real time.
- this color Doppler it is possible to grasp the bloodstream information in the body part visually by representing the components of velocity that are coming to and going away from the ultrasound probing unit 11 with the images of different colors, overlapping the components of velocity on the tomographic images of the tissue, and displaying the overlapped images.
- the control unit 401 has the function of the control unit 101 of the first embodiment and controls the send/receive unit 12 to send/receive the ultrasound to acquire the tomographic image and the ultrasound to acquire the bloodstream information based on the rule set in advance (e.g. to acquire alternatively) to acquire the image data of the bloodstream image while acquiring the image data of the tomographic image. Further, the control unit 401 sends the two kinds of electric signals received from the send/receive unit 12 separately to the image generation unit 102 and the bloodstream information calculation unit 402 following the above-mentioned rule.
- the bloodstream information calculation unit 402 generates the bloodstream information that shows physical characteristics (such as bloodstream velocity, velocity dispersion and the direction of bloodstream) collected by the sampling rate regulated in advance and generates the image data of the bloodstream image based on this bloodstream information.
- the synchronization information addition unit 403 adds the image data of the tomographic image to the image data of the bloodstream image as one set of data, adds the same synchronization information to the added image data and stores the added image data in the image data storage unit 107.
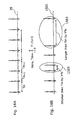
- Fig. 18 is a diagram that shows the relationship of mutual acquisition timing in the case of acquiring the image data of the tomographic image and the image data of the bloodstream image.
- the control unit 401 collects data for bloodstream information during the interim. Consequently, when the color Doppler image is displayed by the ultrasonic diagnostic device, the frame rate drops (generally, about 10 [fps]).
- the synchronization information addition unit 403 overlaps the tomographic image 1701 of gray scale on the bloodstream image 1702 that represents the bloodstream speed with warm color/cold color and generates the combined image 1703.
- the synchronization information addition unit 403 associates the tomographic image 1701 with the bloodstream image 1702 acquired immediately after as one set of data, adds the same synchronization information to the associated image and stores the associated image in the image data storage unit 107.
- Fig. 19A ⁇ Fig. 19C are diagrams that show how the processing to relate the bloodstream image to the generated synchronization signal is executed.
- Fig. 19A is an example of the acquired plural tomographic images.
- Fig. 19B is an example of the generated synchronization signal waveform.
- Fig. 19C is an example of the acquired plural bloodstream images and a diagram that shows how the processing for relating the generated synchronization signal with the bloodstream image is executed.
- Fig. 19D is an example of the combined plural images that combine the tomographic images and the bloodstream images. As shown in Fig. 19A ⁇ Fig.
- the synchronization information addition unit 403 associates the synchronization signal 1802 generated based on the tomographic image 1801 with the bloodstream image 1803 as one set of data, adds the same synchronization information "R" to the associated image and stores the associated image in the image data storage unit 107. Further, the synchronization information addition unit 403 generates the color Doppler image 1804 by combining the tomographic image 1801 and the bloodstream image 1803 that are associated.
- the ultrasonic diagnostic device 40 since the ultrasonic diagnostic device 40 according to the fourth embodiment generates the synchronization signal from the acquired tomographic image and displays a color Doppler image of bloodstream and the like based on this synchronization signal, it is possible to associate an ordinary tomographic image with the color Doppler image that have a temporally constant relationship without inputting the synchronization signal from the outside.
Description
- The present invention relates to image display devices such as a ultrasonic diagnostic device and CT (Computerized Tomography) and particularly to image processing technology to a tomographic image obtained by irradiating an examined object with ultrasound, X rays and the like.
- A image display device irradiates an anatomy (a test subject) with a diagnostic signal (hereafter called "signal") such as the ultrasound and the X rays, receives a signal reflected from the anatomy or a signal passing through the anatomy and executes imaging of the inside of the anatomy based on the received signal. In recent years, the image display device is widely used in an industry field and a clinical medicine field. Representative examples of such devices are an ultrasonic diagnostic device using a reflected signal and a CT device using a signal that passes through.
- These image display devices can measure the anatomy and execute the imaging in real time with the performance of a calculating machine, especially the processing speed, improving. Especially, in the clinical medicine field that needs high time resolution starting from circulatory organs, since a tomographic image of the anatomy is provided in real time, it is possible to diagnose an affected part and the like actively.
- By the way, in a real-time diagnosis, when an operator wants to measure a function, volume and the like of an examined object that operates cyclically, it is necessary to acquire synchronization signal by some kind of method or another.
- Fig. 1 is an outside view of a conventional ultrasonic
diagnostic device 50. As shown in Fig. 1, the ultrasonicdiagnostic device 50 is made up of adisplay device 51, amain unit 52, aprobe 53 and an electrode for electrocardiogram (ECG) 54. - The
display device 51 is a display device with a liquid crystal, CRT (cathode-ray tube) or the like to display a tomographic image obtained by echography or the like and necessary information. It has a touch panel and the like to accept an input from an operator. - The
main unit 52 includes a send/receive circuit that controls transmission/reception of the ultrasound through theprobe 53, a signal/image processing circuit made up of a DSP (Digital Signal Processor), RAM (Random Access Memory) and the like and a liquid crystal display that has a group of switches, a mouse and a touch panel to accept the input from the operator. Additionally, themain unit 52 receives an ECG signal through the electrode forECG 54. - The
probe 53 is a search unit made up of an ultrasound vibrator, an acoustic lens and the like to send/receive the ultrasound. - As just described, the conventional ultrasonic
diagnostic device 50 acquires the ECG signal as a synchronization signal from the test object through the electrode forECG 54. - However, in the case of the conventional ultrasonic diagnostic device, since the above-mentioned synchronization signal is inputted into the ultrasonic diagnostic device through the special-purpose electrode for
ECG 54, the ultrasonic diagnostic device needs a special-purpose circuit and a special-purpose cable and therefore the cost for diagnosis becomes high and at the same time space to set up an external device is necessary. - In addition, in the case of thinking about the use in the clinical medicine field, since it is necessary for a patient who is a subject for measurement to wear a measuring instrument to measure or extract the synchronization signal, it is a burden for the patient in both of mind and body.
- As just described, in the case of making a diagnosis using the synchronization signal, generally the external device is necessary and the subject for measurement also needs to wear the measuring instrument and therefore there is a drawback that it is complicated and the measurement cost is high.
- The European
patent application EP 1 061 474 discloses a computer tomograph which is able to reconstruct images of an object retrospectively based on recorded spiral scanning data of this object and which can calculate information about the object movement contours and phases from the measured data without additional information such as ECG signal. The movement phase-correlated reconstruction of the images is carried on by analyzing a kymogram function from the spiral data or by using volume reconstruction including phase correlation. - The European
patent application EP 1 061 474 discloses a computer tomograph which is able to reconstruct images of an object retrospectively based on recorded spiral scanning data of this object and which can calculate information about the object movement contours and phases from the measured data without additional information such as ECG signal. The movement phase-correlated reconstruction of the images is carried on by analyzing a kymogram function from the spiral data or by using volume reconstruction including phase correlation. - In view of the foregoing, it is the first object of the present invention to provide an image processing device or an ultrasonic diagnostic device that makes an examination using a synchronization signal possible without inputting a synchronization signal from outside. Further, it is the second object of the present invention to provide a display method for making it easy to understand the correspondence between an extracted synchronization signal and a displayed tomographic image.
- To achieve the above-mentioned objects, there is provided an image processing device according to
claim 1. - Herewith, since a synchronization signal is generated from the acquired tomographic image (a synchronization signal is obtained without inputting an electrocardiogram (ECG) signal and the like from outside), it becomes possible to execute a diagnosis and a display to an examined object that acts cyclically focusing on a synchronous tomographic image. As a result, since it becomes unnecessary to input a synchronization signal that is conventionally generated by an external device, there is an effect that a simpler diagnosis at a lower cost becomes possible.
- Additionally, the image processing device further comprises: a synchronization information addition unit operable to discriminate a phase timing by which individual image data is sampled in the sequence of image data based on the generated synchronization signal and add synchronization information that indicates phase timings are same in plural image data.
- Herewith, since it is possible to add synchronization information based on the generated synchronization signal and to select only the synchronous data, it becomes possible to display a synchronous tomographic image without inputting a synchronization signal from outside, reducing memory capacity.
- Further, the image processing device further comprises: a bloodstream information calculation unit operable to generate bloodstream information that represents physical characteristics of bloodstream based on sampled data by a timing that has a predetermined relationship with sampling timing in the image acquisition unit; a bloodstream image generation unit operable to generate image data of a bloodstream image based on the generated bloodstream information; and a correspondence unit operable to associate image data of the tomographic image to which the synchronization information is added with image data of the bloodstream image based on the synchronization signal.
- Herewith, since a synchronization signal is generated form the acquired tomographic image and a color Doppler image such as blood stream is displayed based on this synchronization signal, it becomes possible to associate an ordinary tomographic image with a color Doppler image that have a temporally determined relationship and to display the associated images.
- Furthermore, to achieve the above-mentioned objects, the ultrasonic diagnostic device is an ultrasonic diagnostic device that generates and displays a tomographic image of an object that acts cyclically comprising: an image acquisition unit operable to acquire a sequence of image data of a tomographic image by sampling at a constant rate during a predetermined time that is one cycle or more; a characteristic value extraction unit operable to extract in sequence characteristic values that change with a passage of time based on the acquired sequence of image data; a synchronization signal generation unit operable to generate a synchronization signal that indicates a timing of the same phase in the cyclical action based on the extracted characteristic values; a synchronization information addition unit operable to discriminate a phase timing by which individual image data is sampled in the sequence of image data based on the generated synchronization signal and add synchronization information that indicates phase timings are same in plural image data; and a display unit operable to display a tomographic image based on the synchronous image data to which the synchronization information is added.
- Herewith, since a synchronization signal is generated from the acquired tomographic image (a synchronization signal is obtained without inputting an ECG signal and the like from outside), it becomes possible to execute a diagnosis and a display to an examined object that acts cyclically focusing on a synchronous tomographic image. As a result, since it becomes unnecessary to input a synchronization signal that is conventionally generated by an external device, an ultrasonic diagnosis device that can execute a simpler diagnosis at a lower cost can be realized.
- By the way, to achieve the above-mentioned objects, the present invention can be realized as an image processing method having the characteristic units of the above-mentioned image processing device and the ultrasonic diagnostic device as steps and the present invention can be realized as a program including all of these steps. Then, the program not only can be stored in ROM and the like that the image processing device and the ultrasonic diagnostic device include but also can be distributed through a recording medium such as CD-ROM or transmission medium such as communication network.
- These and other objects, advantages and features of the invention will become apparent from the following description thereof taken in conjunction with the accompanying drawings that illustrate a specific embodiment of the invention. In the Drawings:
- Fig. 1 is an outside view of a conventional ultrasonic diagnostic device.
- Fig. 2 is a block diagram that shows a functional configuration of an ultrasonic diagnostic device according to the first embodiment.
- Fig. 3 is a diagram that shows an example of a method for setting an ROI (Region of Intesest) in a tomographic image by the ROI setting unit.
- Fig. 4A is a diagram that lines up the acquired tomographic image examples in chronological order.
- Fig. 4B is an example of a graph that represents the left ventricular volume (LVV), one of the characteristic values, calculated based on the individual tomographic images in Fig. 3A by a curve (a LVV curve).
- Fig. 4C is a diagram that shows the generated synchronization signal based on the calculated LVV curve.
- Fig. 5A is an example of an LVV curve.
- Fig. 5B is an example of a pseudo R wave that is generated based on the activity of the left ventricle of the heart (the LVV curve) and that corresponds to the R wave in the ECG waveform.
- Fig. 6 is a flowchart that shows "the process to generate the pseudo R wave" in the case of generating the pseudo R wave in real time.
- Fig. 7A is a diagram that shows an example of the generated synchronization signal.
- Fig. 7B shows how the image data to which the synchronization information is added are stored and how only the image data to which the synchronization information is added are read in the ultrasonic diagnostic device according to the first embodiment in schematic form.
- Fig. 8 is a block diagram that shows the functional configuration of an ultrasonic diagnostic device according to the second embodiment.
- Fig. 9A is a diagram that shows the contents of the processing in the image generation unit.
- Fig. 9B is a diagram that shows the contents of the processing in the characteristic value extraction unit.
- Fig. 9C is a diagram that shows the contents of the processing in the synchronization generation unit and the synchronization information addition unit.
- Fig. 9D is a diagram that shows the contents of the processing in the image display unit.
- Fig. 10A is a diagram that shows an example of the generated synchronization signal.
- Fig. 10B shows how only the image data to which the synchronization information is added are selected in the ultrasonic diagnostic device according to the second embodiment in schematic form.
- Fig. 11 is a block diagram that shows the functional configuration of an ultrasonic diagnostic device according to the third embodiment.
- Fig. 12A is a display example of the tomographic image when the image data are not compressed.
- Fig. 12B is a diagram that shows in schematic form a case of displaying six tomographic images at the same time by compressing the image data to one sixth and making the display size smaller.
- Fig. 13 is an example that shows how the characteristic value and the synchronization signal are displayed by scrolling.
- Fig. 14A is a diagram that shows an example of the processing method in the case of changing with time the display object of the synchronization signal and displaying the display object.
- Fig. 14B is a diagram that shows how the actual synchronization signals displayed by the method shown in Fig. 13A change.
- Fig. 15 is a flowchart that shows "image display processing" in the control unit.
- Fig. 16A is a diagram that shows the generated normal synchronization signal waveform.
- Fig. 16B is a diagram that shows in schematic form how the cycle estimate unit monitors the cycle fluctuation based on the cycle estimated to the generated synchronization signal and notifies the warning when the abnormality is observed.
- Fig. 17 is a block diagram that shows the functional configuration of an ultrasonic diagnostic device according to the fourth embodiment.
- Fig. 18 is a diagram that shows the relationship of mutual acquisition timing in the case of acquiring the image data of the tomographic image and the image data of an image including bloodstream information.
- Fig. 19A is an example of the acquired plural tomographic images.
- Fig. 19B is an example of the generated synchronization signal waveform.
- Fig. 19C is an example of the acquired plural bloodstream images and a diagram that shows how the processing for relating the generated synchronization signal with the bloodstream image is executed.
- Fig. 19D is an example of the combined plural images that combine the tomographic images and the bloodstream images.
-
- The embodiment according to the present invention will be explained below with reference to the figures. Note that in the embodiments below, an ultrasonic diagnostic device is taken up as an example of the above-mentioned image processing device and the ultrasonic diagnostic device will be explained.
- Fig. 3 is a block diagram that shows a functional configuration of an ultrasonic
diagnostic device 10 according to the first embodiment. Thepresent device 10 is an ultrasonic diagnostic device that has a function that generates a synchronization signal from an acquired tomographic image and includes anultrasonic search unit 11, a send/receiveunit 12, anoperation unit 13, animage processing unit 100 and animage display unit 111. - The
ultrasonic search unit 11 is generally called a probe and for example a probe that performs electronic scan based on the phased array method. Theultrasonic search unit 11 emits ultrasound (e.g., ultrasonic pulse) based on a control signal received from the send/receiveunit 12. Further, thesearch unit 11 also receives ultrasound (hereafter called "ultrasonic echo") reflected from inside the living body of the test object (hereafter, also called "patient"), converts the ultrasonic echo into an electric signal, and sends the electric signal to the send/receiveunit 12. - The send/receive
unit 12 is made up of a sender/beam former that has theultrasonic search unit 11 generate ultrasound and a receiver/beam former that receives an electric signal from thesearch unit 11 that has detected an ultrasonic echo. The send/receiveunit 12 processes the electric signal received from theultrasonic search unit 11 such as by amplifying it, and sends the processed electric signal to theimage processing unit 100. - The
operation unit 13 is equipped with a switch, a touch panel and the like, receives an input from the operator to them and sends a control signal corresponding to the received input to theimage processing unit 100. - Based on the electric signal from the send/receive
unit 12, theimage processing unit 100 generates image data of a tomographic image. Further, based on a change of characteristic value (such as a volume and a cross section area of the left ventricle of the heart), theimage processing unit 100 generates the synchronization signal. Here, the "image data" refers to data such as two-dimensional brightness data. The image data are generated each time theultrasonic search unit 11 executes one scan, and are displayed in B mode. - This
image processing unit 100 is made up of acontrol unit 101, animage generation unit 102, an ROI (Region of Interest)setting unit 103, a characteristicvalue extraction unit 104, asynchronization generation unit 105, a synchronizationinformation addition unit 106, an imagedata storage unit 107, adata specification unit 108, adata reading unit 109 and an selectedimage storage unit 110. - The
control unit 101 is, for example, a microcomputer equipped with ROM (Read-Only Memory), RAM (Random Access Memory) and the like, instructs each unit in theimage processing unit 100 to execute its own processing, and controls timing of the processing. To be more specific, thecontrol unit 101 controls the send/receiveunit 12 that sends an ultrasound and receives an ultra sound echo, and receives and decrypts a control signal and the like sent by theoperation unit 13. Further, thecontrol unit 101 sends an electric signal converted from an ultrasound echo that thecontrol unit 101 has received from the send/receiveunit 12 to theimage generation unit 102. - The
image generation unit 102 first receives an electric signal from the send/receiveunit 12 through thecontrol unit 101. Theimage generation unit 102 then executes an amplified calculation, analog-to-digital (A/D) conversion and an interpolation calculation on the received electric signal to generate image data of a tomographic image. - The ROI (Region of Interest)
setting unit 103 sets a Region of Interest (ROI) that is a calculation object of the characteristic value to the generated tomographic image and further extracts a contour of the object in this ROI. Generally, plural tomographic images are acquired in chronological order and the ROIs are set for these tomographic images individually. - As for extracting the contour of the object, it is acceptable to accept the contour manually from the operator through the
operation unit 13 or to acquire the contour of the ROI by an "automatic contour extraction method" disclosed by Japanese Laid-Open Patent Application No. 2002-224116. This automatic contour extraction method first uses techniques of "digitalization" and "degeneracy" to the tomographic image of the object to extract a rough initial contour and then seek a fine contour finally applying a active contour model (SNAKES) to this initial contour and making a convergence calculation. - Fig. 3 is a diagram that shows an example of a method for setting an ROI in a tomographic image by the
ROI setting unit 103. In Fig. 3 is shown a case in which a tomographic image of a heart is projected and the left ventricle is set as an ROI. In Fig. 3, an area surrounded by a square 21 is the outer frame of an observational monitor in theimage display unit 111 that will be explained later; the fan-shaped part shown by oblique lines inside the outer frame is a whole tomographic image projected by the ultrasonicdiagnostic device 10;curves thick curve 25 is the ROI (here, the left ventricle of the heart). - The characteristic
value extraction unit 104 extracts or calculates characteristic values (such as a volume and a cross-section of the left ventricle of the heart) of the ROI of the tomographic image specified by theROI setting unit 103. For example, the radius of the object is calculated from the tomographic image and the left ventricular volume (LVV) of the heart is calculated by substituting the calculated radius into an approximate expression such as the single plane area length method and the Modified Simpson method. - The
synchronization generation unit 105 generates a synchronization signal (e.g. a waveform like an R wave in ECG waveform) based on the extracted characteristic value. For example, there is a method for generating the synchronization signal at the time when the LVV becomes the smallest or a method for generating the synchronization signal that coincides with the change of the LVV (e.g. the R wave of pseudo ECG waveform). - Fig. 4A∼Fig. 4C are diagrams that show an example of a method for generating the synchronization signal based on the characteristic value extracted by the characteristic
value extraction unit 104. Fig. 4A is a diagram that lines up the acquired tomographic image examples in chronological order. Based on each tomographic image in Fig. 4A, the LVV of the heart V, an example of the characteristic value, is calculated (and represented by ). Fig. 4B is a graph that represents this by a curve (hereafter called a "left ventricular volume (LVV) curve"). In Fig. 4B, the vertical axis represents the left ventricular volume V and the horizontal axis represents time t. Here, spline interpolation or polynomial expression interpolation (the interpolation curve in this case is represented by (the number of the points -1) degree of polynomial expression) is executed to the calculated LVV of the heart V to generate theLVV curve 33. Fig. 4C is a diagram that shows an example of the generated synchronization signal based on theLVV curve 33. When the extreme value of theLVV curve 33 is detected (in this case, the minimum values 32 and 37), thesynchronization pulses 34, 38 (e.g. triangular wave pulse) are generated to coincide with the time when these minimum values are detected. Fig. 4C shows how this is done. - By the way, here, the example using the LVV of the heart as the characteristic value is shown but it is possible to use, for example, the movement of the beating blood vessel wall without modification or the change in the diameter of the blood vessel as the characteristic value.
- In addition, it is acceptable to construct the
synchronization generation unit 105 to generate an ECG waveform that is closer to the real ECG waveform artificially. In this case, the synchronization signal that corresponds to the ECG waveform is generated based on the activity of the left ventricle of the heart. The ECG waveform shows change of active potential of cardiac muscles in action. According to Medical Electronic Measurement (written by Mr. Hiroshi Yagi and published by Sangyo Tosho Publishing Co., Ltd.), the constriction of a heart is produced by electric conduction of nerve or neuroid muscle fiber as a trigger. In other words, the activity of a heart has a close link with the ECG waveform; by monitoring the activity of the heart, it is possible to estimate the ECG waveform and to generate the ECG waveform artificially. - As for a waveform displayed in ECG, there are P wave, Q wave, R wave, S wave, T wave and U wave according to the active phases of the heart but in the case of measuring the function of the circulatory organs starting from the heart, it is the common practice to use the "R wave". Since the R wave appears when the left ventricle of the heart starts the constriction and its amplitude is large, it is often used as a trigger signal when the function of the heart is diagnosed.
- Fig. 5A and Fig. 5B are diagrams that explain a method for generating a synchronization signal corresponding to an ECG waveform artificially. Fig. 5A is an example of the LVV curve. Furthermore, Fig. 5B is an example of a pseudo R wave that is generated based on the activity of the left ventricle of the heart (the LVV curve) and that corresponds to the R wave in the ECG waveform.
- Generally, the timing when the R wave appears is about 0.05 second before the left ventricle starts the constriction and this is exactly the halfway the time that represents the local
minimal value 41 and the local maximal value 42 (the time is T3 and T4, respectively) just before the left ventricle of the heart enters the systole in theLVV curve 33. Consequently, from theLVV curve 33, theminimum value 43 and its time T5 are specified; the localmaximal value 42 just before theminimum value 43 and its time T4 are specified; and further the localminimal value 41 just before the localmaximal value 42 and its time T3 are specified. Fig. 5B is a concrete example for the shape of the pseudo R wave generated by thesynchronization generation unit 105. The R wave in this case has a shape that combines a large isosceles triangle and two small isosceles triangles; as in Fig. 4B, when a∼d are defined, "a:b:c:d = 10:5:2:1. - There are two methods to generate the pseudo R wave.
- One is the method for generating the pseudo R wave non-real time after the tomographic images are acquired for a predetermined time (e.g. about 10 seconds) in advance. In this case also, first, the ROI is set; the contour is extracted; and the
LVV curve 33 is obtained by the extracted contour and the plural tomographic images. The time T3 and T4 are specified from thisLVV curve 33 with the above-mentioned procedures and the pseudo R wave is generated in the middle of these two times. - The other is the method for generating the pseudo R wave in real time. In this case, the pseudo R wave is generated by making the predetermined frames (e.g. 10 frames) one set. In this case also, the
LVV curve 33 is partially obtained by setting the ROI and extracting the contour. When the minimum value can be specified in the obtainedpartial LVV curve 33, the times T3 and T4 are specified by going back from the time. Similarly to the above, the pseudo R wave is generated in the middle of these two times. Thinking about the case of 30 [fps], for example, it takes at least 330[ms] to generate a pulse of the pseudo R wave and therefore there is a delay but since there is the time of 33 [ms] between the frames, it is possible to follow the actual activity of the heart. - Fig. 6 is a flowchart that shows "the process to generate the pseudo R wave" in the case of generating the pseudo R wave in real time.
- For a start, the
image generation unit 102 generates 10 frames of the tomographic image. Based on them, the characteristicvalue extraction unit 104 calculates the LVV and memorizes it temporarily (S501). Next, thesynchronization generation unit 105 compares each volume value with the standard value (Vs) that is set in advance (S502) and judges whether the minimum value is specified or not (S503). When thesynchronization generation unit 105 can specify the minimum value (S503: Yes), it specifies the local maximal value, the local minimal value and each time (T4 and T3) (S504 and S505). - Next, since T4 and T3 are specified, the time of each characteristic point in the pseudo R wave is determined and therefore it is possible to generate the pseudo R wave (S507). By the way, when the minimum value cannot be specified (S503: No), the
image generation unit 102 generates the next 10 frames of the tomographic image and the same process as the above is executed to them. - The synchronization
information addition unit 106 associates the generated characteristic value and synchronization signal information with the timing when the image data is generated and stores the associated image data in the imagedata storage unit 107. - The image
data storage unit 107 is, for example, a memory unit made up of RAM and the like and has a capacity of several dozen to several hundred M bites. The imagedata storage unit 107 stores the image data associated with and added to the characteristic value (e.g. the volume of the left ventricle of the heart) and the synchronization information by the synchronizationinformation addition unit 106. - By specifying the characteristic value or the synchronization signal information, the
data specification unit 108 specifies the information to select the image data that exist in the particular phase in the sequence of image data that changes cyclically or with certain regularity and send the information to thedata reading unit 109. - Based on the information received from the
data specification unit 108, thedata reading unit 109 reads the applicable image data from the imagedata storage unit 107 and sends the image data to the selectedimage storage unit 110. - The selected
image storage unit 110 is frame memory or the like for the observational monitor of theimage display unit 111 and stores the image data read by thedata reading unit 109. - The
image display unit 111 reads the image data stored in the selectedimage storage unit 110 and displays the tomographic image in B mode or the like on a liquid crystal display or the like that is the observational monitor. In addition, theimage display unit 111 has graphic accelerator, DSC (Digital Scan Converter) and the like. - Fig. 7A and Fig. 7B are diagrams that explain a functional overview of the ultrasonic
diagnostic device 10 according to the first embodiment. Fig. 7A is a diagram that shows an example of the generated synchronization signal. Fig. 7B shows how the image data to which the synchronization information is added are stored and how only the image data to which the synchronization information is added are read in the ultrasonicdiagnostic device 10 in schematic form. - As shown in Fig. 7B, the synchronization information "R" is added to the image data by the synchronization
information addition unit 106; the image data are stored in the imagedata storage unit 107; thedata reading unit 109 reads only the image data to which the synchronization information "R" is added from thedata storage unit 107. - Here, the synchronization information "R" is added to the tomographic image that causes to generate the synchronization pulse but it is acceptable only if this synchronization information can be uniquely specified. Additionally, it is acceptable to add the image data other than the image data to which the synchronization information "R" is added to other synchronization information such as "P" or "Q" and to add one piece of the image data to plural synchronization information. Further, it is also acceptable to add the characteristic value itself to each image data.
- Further, when the synchronization information "R" is designated by the
data specification unit 108, thedata reading unit 109 reads only the image data to which the synchronization information "R" (61∼65 and the like) is added in sequence form the imagedata storage unit 107. As for the method for specifying the image data, it is acceptable that the operator designates the synchronization information itself or it is acceptable to designate the image data n frames before or n frames after the image data to which the "R" is added. It is also acceptable to designate plural synchronization information such as the "R" and the "Q", to read the image data to which the synchronization information is added in each cycle and to have theimage display unit 111 display them at the same time. As for the timing to update the display, it is acceptable to read automatically from the imagedata storage unit 107 at an appropriate time interval (e.g. an interval of one second) or to update the display manually when theoperation unit 13 has a track ball and a keyboard (not illustrated). - As is described above, since the ultrasonic
diagnostic device 10 according to the first embodiment generates the synchronization information from the acquired tomographic image, it is possible to extract the synchronous tomographic image and to diagnose the examined object based on the synchronous tomographic image without inputting the synchronization signal from the outside. - Note that the configuration that generates the pseudo R wave is explained in the first embodiment, it is acceptable to configure so as to generate the ECG waveform other than the R wave such as the P wave and the Q wave. Additionally, in the present embodiment, a practical example in which 10 frames' ultrasound images are acquired and the LLV is calculated based on them is explained, but it is needless to say that the number is not limited to 10.
- Further, when the image display device is CT (Computerized Tomography) device of X-rays, the
control unit 101 applies X-rays and controls a X-rays detector. When the image display device is MRI (Magnetic Resonance Imaging), thecontrol unit 101 controls the magnetic field and the pulse column of the measurement area and the detector. - Furthermore, in the first embodiment, the example in which attention is focused on the left ventricle of the heart as the ROI is shown, but the object of the ROI is not limited to the left ventricle of the heart and its shape is also arbitrary. Moreover, the method for setting the ROI is not limited to the above-mentioned method; it is acceptable to set the ROI by a method other than the above-mentioned method.
- Fig. 8 is a block diagram that shows the functional configuration of an ultrasonic
diagnostic device 20 according to the second embodiment. While the ultrasonicdiagnostic device 10 according to the first embodiment stores the tomographic image to which the synchronization information is added temporarily in the imagedata storage unit 107 and displays the synchronous tomographic image, thepresent device 20 displays the synchronous tomographic image more rapidly without storing the tomographic image to which the synchronization information is added temporarily. By the way, in the following description, the configuration different from the first embodiment is explained placing the full weight; the common configuration is given the same numbers and the explanation is omitted. - The ultrasonic
diagnostic device 20 differs from the ultrasonicdiagnostic device 10 in that the former newly includes an imagedata selection unit 202 in place of the imagedata storage unit 107 and thedata reading unit 109. - A
control unit 201 controls the imagedata selection unit 202 newly in place of controlling the imagedata storage unit 107 and thedata reading unit 109 in the first embodiment. - The image
data selection unit 202 selects the image data to which the synchronization information is added and that are designated by thedata specification unit 108 and discards the image data other than that. The selected image data are sent to the selectedimage storage unit 110. For this reason, an observer can observe only the tomographic image in the arbitrary phase based on the synchronization signal real time similarly to the case of inputting the synchronization signal from the outside. - Fig. 9 is a time chart that shows the flow of processing of each unit in the ultrasonic
diagnostic device 20. Fig. 9A is a diagram that shows the contents of the processing in theimage generation unit 102; Fig. 9B is a diagram that shows the contents of the processing in the characteristicvalue extraction unit 104; Fig. 9C is a diagram that shows the contents of the processing in thesynchronization generation unit 105 and the synchronizationinformation addition unit 106; and Fig. 9D is a diagram that shows the contents of the processing in theimage display unit 111. - As shown in Fig. 9A, for a start, the
image generation unit 102 generates the image data of the tomographic image based on an electric signal received through the send/receiveunit 12 and the control unit 201 (S81). - Next, the characteristic
value extraction unit 104 calculates and memorizes the characteristic value (e.g. the LVV of the heart and the like) based on the generated tomographic image (S82). Further, thesynchronization generation unit 105 specifies the local maximum value, the local minimal value and the minimum value based on the extracted characteristic value and based on theses values, the synchronizationinformation addition unit 106 executes the addition/non-addition of the synchronization information (e.g. the "R") (-). At this point, to specify the minimum value, it is necessary to compare the value of the LVV for a predetermined period (e.g. one cycle's period). - At the last, the
image display unit 111 selects only the image data to which the synchronization information is added and updates the display of the tomographic image based on the selected image data (S84). Hereafter, the similar processing is executed to the second frame and the following. - Fig. 10A and Fig. 10B explain a functional overview of the ultrasonic
diagnostic device 20 according to the second embodiment. Fig. 10A is a diagram that shows an example of the generated synchronization signal. Fig. 10B shows how only the image data to which the synchronization information is added are selected and the tomographic images are displayed in the ultrasonicdiagnostic device 20 in schematic form. - As shown in Fig. 10B, since the synchronization information "R" is added to the image data by the synchronization
information addition unit 106 and thedata specification unit 108 instructs the imagedata selection unit 202 to select only the synchronization information "R", only the image data to which the synchronization information is added (61∼65) are selected and become the object of the display. - As is described above, since the ultrasonic
diagnostic device 20 according to the second embodiment is configured in order that the synchronization information is added to image data based on the generated synchronization signal and only the synchronous image data can be selected, it is possible to display the synchronous tomographic image without inputting the synchronization signal from the outside, reducing the capacity of memory. - In addition, similarly to the first embodiment, it is acceptable to configure in order that the
synchronization generation unit 105 generates an ECG waveform artificially. - Fig. 11 is a block diagram that shows the functional configuration of an ultrasonic
diagnostic device 30 according to the third embodiment. The present ultrasonicdiagnostic device 30 executes a reduced display and a scroll display of the tomographic image and a warning notification when an abnormality about the characteristic value occurs. Further, thepresent device 30 displays the extracted characteristic value, the generated synchronization signal and the tomographic image at the same time in one screen. - Note that in the following description, similarly to the second embodiment, the configuration different from the first and second embodiments is explained placing the full weight; the common configuration is given the same numbers and the explanation is omitted.
- The ultrasonic
diagnostic device 30 differs from the ultrasonicdiagnostic device 10 in that the former newly includes a characteristicvalue storage unit 302, a characteristicvalue reading unit 303, a synchronizationsignal storage unit 306 and the synchronizationsignal reading unit 307 and has acycle estimate unit 305 in thesynchronization generation unit 304, animage compression unit 309 in the selectedimage storage unit 308 and a cyclefluctuation warning unit 311 in theimage display unit 310. - The
control unit 301 has the same function as thecontrol unit 201 of the second embodiment. In addition to this function, thecontrol unit 301 instructs each unit to execute each processing and controls timings of the processing in order to execute the reduced display and the scroll display of the tomographic image and the warning notification when an abnormality about the characteristic value occurs. Additionally, thecontrol unit 301 controls "image display processing" that is described later. Further, thecontrol unit 301 accepts information that represents a reading start point and a reading finish point through theoperation unit 13 and sends the information to the characteristicvalue reading unit 303 and the synchronizationsignal reading unit 307. - The characteristic
value storage unit 302 receives the characteristic value generated by the characteristicvalue extraction unit 104 and stores the characteristic value in sequence. - Based on the information received from the
control unit 301, the characteristicvalue reading unit 303 reads information of the characteristic value between the reading start point and the reading finish point stored in the characteristicvalue storage unit 302 and send the information to theimage display unit 310. - The
synchronization generation unit 304 is newly equipped with thecycle estimate unit 305 in addition to the function of thesynchronization generation unit 105 of the first embodiment. - The
cycle estimate unit 305 estimates the cycle of the synchronization signal by seeking an average value of the cycle of the generated synchronization signal and by executing statistical processing. - The synchronization
signal storage unit 306 stores the synchronization signal information generated by thesynchronization generation unit 304. - Based on the information received from the
control unit 301, the synchronizationsignal reading unit 307 reads the synchronization signal information between the reading start point and the reading finish point stored in the synchronizationsignal storage unit 306 and send the synchronization signal information to theimage display unit 310. - The selected
image storage unit 308 is newly equipped with theimage compression unit 309 in addition to the same function as the selectedimage storage unit 110 of the first embodiment. Here, the contents of the frame memory are updated every time the image data are sent from the imagedata selection unit 202; the new image data are overwritten in sequence; and it is possible to display always the latest tomographic images (in the case of Fig. 12B, 6 pieces). - The
image compression unit 309 captures the image data that the imagedata selection unit 202 sends to the selectionimage storage unit 308 temporarily, converts the image data to reduce the display size (e.g. pixel skipping) and stores again plural image data in the frame memory for one screen to display on the observational monitor of the selectedimage storage unit 110. - Fig. 12A and Fig. 12B are diagrams that represent how the image data of the tomographic image are compressed by the
image compression unit 309 in schematic form. Fig. 12A is a display example of the tomographic image when the image data are not compressed. Fig. 12B is an example that displays six tomographic images in one screen by compressing the image data to one sixth. Fig. 12B is an example of the case to display "n × m (n≧1, m≧1)" pieces of the tomographic images and in this case six pieces (n=3, m=2) of the tomographic images are displayed. - The
image compression unit 309 decides the data compression ratio by the screen size that theobservational monitor 1100 in theimage display unit 310 can display, the data size of the tomographic image and the number of the tomographic images to be displayed (namely m and n). Further, theimage compression unit 309 makes it possible to display the plural pieces of the tomographic images that are acquired in succession by performing an interpolative calculation following the generally used sampling technique, seeking the coordinates of the pixels on the tomographic images after the compression and storing the image data in the frame memory that corresponds to the position the operator wants to display. - The
image display unit 310 is newly includes the cyclefluctuation warning unit 311 in addition to the function of theimage display unit 111 of the first embodiment. Further, theimage display unit 310 executes highlight processing and like to the tomographic image when it displays the latest tomographic image and thus makes it possible to tell easily which the latest tomographic image is. - When abnormality in the cycle of the synchronization signal generated by the synchronization generation unit occurs, the cycle
fluctuation warning unit 311 detects the abnormality by executing statistical processing such as an analysis using regular probability distribution and notifies the abnormality to the operator. As for methods of notification, there are a method for giving a beep as a warning signal and a method for displaying an abnormal area on the screen with a different color. - Fig. 13 is an example that shows how the characteristic value and the synchronization signal are displayed by scrolling. In this case, the memory method of data in the characteristic
value storage unit 302 and the synchronizationsignal storage unit 306 is a ring buffer or the similar structure; every time the characteristic value and the synchronization signal are generated coming up with the generation of the image data of the tomographic image, the characteristic value and the synchronization signal are overwritten and stored in sequence; in the case of finishing the storage up to the aftermost storage area, new information is written overwriting old information from the beginning of the storage area. - In the case of displaying the information on the
image display unit 310, the information of characteristic value and the synchronization signal of the image data within the area between "the reading start point" and "the reading finish point" received from the operator is written in the frame memory in the selectedimage storage unit 308. It is possible to change the positions of the reading start point and the reading finish point; the characteristic value and the synchronization signal are displayed to be scrolled with time. It is possible to display markers that enable the operator to tell at which timing the displayed characteristic value or the displayed synchronization signal is acquired. - On the
observational monitor 1100 in Fig. 13 are displayed three pieces oftomographic images 1205∼1207, the characteristic value (the LVV of the heart)curve 33 and thesynchronization signal waveform 35 at the same time. Further, on thisobservational monitor 1100 are indicated themarkers 1211∼1213 that represents corresponding relationship between eachsynchronous tomographic image 1205∼1207 in a different cycle and thecharacteristic value curve 33 as well as thesynchronization signal waveform 35. On theobservational monitor 1101 are indicated themarkers 1221∼1223 that represents corresponding relationship between eachtomographic image 1215∼1217 in a different phase in the same cycle and thecharacteristic value curve 33 as well as thesynchronization signal waveform 35. In this case, with themarker 1222 at the center, the three consecutivetomographic images 1215∼1217 in the different phase in the same cycle are indicated. - Fig. 14A and Fig. 14B shows how the display area of the characteristic
value storage unit 302 and the synchronizationsignal storage unit 306 is changing with time. Here, the synchronization signal is explained. The explanation of the characteristic value is exactly alike. Fig. 14A is a diagram that shows an example of the processing method in the case of changing with time the display object of the synchronization signal and displaying the display object. Furthermore, Fig. 14B is a diagram that shows how the actual synchronization signals displayed by the method shown in Fig. 14A change. - Fig. 14A shows how the reading position of the synchronization signal information stored in the synchronization
signal storage unit 306 switches with time fromImage 1 through Image 4 in numerical order. Coming up with this, the synchronization signals displayed on the observational monitor of theimage display unit 310 change as shown in Fig. 14B. The synchronization signals are displayed like a stream from right to left on the screen. - Fig. 15 is a flowchart that shows "image display processing" in the
control unit 301 of the ultrasonicdiagnostic device 30. In this case, as for the display mode that is the control object, there are "Display mode 1" and "Display mode 2". TheDisplay mode 1 is the mode for displaying the reduced tomographic image as shown in Fig. 12B. On the other hand, as shown in Fig. 13, theDisplay mode 2 is the mode for displaying (1) the plural synchronous tomographic images in the different cycle, the characteristic value curve and the synchronization signal waveform or (2) the plural tomographic images of the different phase in the same cycle, the characteristic value curve and the synchronization signal waveform. - The
control unit 301 receives the type of the display mode from the operator. When theDisplay mode 1 is selected (S1401), thecontrol unit 301 instructs thedata specification unit 108 to display six pieces of the tomographic images to which the synchronization information "R" is added. Next, based on the instruction from thedata specification unit 108, the imagedata selection unit 202 selects six frames (namely, n•m frames: n and m are natural numbers) of image data to which "R" is added and send them to the selected image storage unit 308 (S1402). In doing this, theimage compression unit 309 compresses the received image data to (1/n·m) and stores the compressed image data to the frame memory (S1403). Further, theimage display unit 310 displays the tomographic images based on the image data stored in the frame memory on the observational monitor (S1404). - On the other hand, when the
Display mode 2 is selected (S14901), based on the reading start point and the reading finish point received from the operator as well as the markers (S1406, S1407), either (1) the plural synchronous tomographic images in the different cycle, the characteristic value curve and the synchronization signal waveform or (2) the plural tomographic images of the different phase in the same cycle, the characteristic value curve and the synchronization signal waveform are displayed (S1408). - Fig. 16A and Fig. 16B show how the
cycle estimate unit 305 monitors the cycle fluctuation based on the cycle estimated to the generated synchronization signal and notifies the warning when the abnormality is observed by the cyclefluctuation warning unit 311 in schematic form. Fig. 16A is a diagram that shows the generated normalsynchronization signal waveform 35. Fig. 16B is a diagram that shows in schematic form how thecycle estimate unit 305 monitors the cycle fluctuation based on the cycle estimated to the generated synchronization signal and notifies the warning when the abnormality is observed. - In general, in the case of generating a synchronization signal focusing attention on the same characteristic value and observing a living body, the synchronization signals will be generated in the almost regular cycle. But when the cycle of the generated synchronization signals fluctuates suddenly, the probability that abnormality of some kind occurs is great and it is necessary to notify the observer. In the case of Fig. 16B, the cycle
fluctuation warning unit 311 calculates the average value Tm of the generated synchronization signals; when the synchronization signal becomes shorter than this Tm by X% or longer than this Tm by X%, the cyclefluctuation warning unit 311 notifies the observer by a warning sound, changing the color of display or the like. - By the way, in Fig. 11, the ultrasonic
diagnostic device 30 is configured to comprise the cyclefluctuation warning unit 311 and to execute a warning notification when the cycle of the synchronization signals fluctuates; it is acceptable that the ultrasonicdiagnostic device 30 is configured to comprise a characteristic value fluctuation warning unit and to execute a warning notification when the characteristic value fluctuates abnormally. In this case, the object whose fluctuation is detected is not the cycle; the maximum value, the minimum value and the difference between the maximum value and the minimum value of the LVV of the heart described above are the objects; using the average value of these values or the like, the characteristic value fluctuation warning unit monitors the ever-changing characteristic value and notifies by sounding a warning or the like when an abnormal value is detected. - As is described, the ultrasonic
diagnostic device 30 according to the third embodiment makes it possible to execute the reduced display and the scroll display of the tomographic image and the warning notification when the abnormality in the characteristic value occurs. - Note that it is acceptable to configure the ultrasonic
diagnostic device 30 to generate the ECG waveform artificially in thesynchronization generation unit 304 similarly to the first embodiment. - Fig. 17 is a block diagram that shows the functional configuration of an ultrasonic
diagnostic device 40 according to the fourth embodiment. - By the way, in the following description, the configuration different from the first embodiment is explained placing the full weight; the common configuration is given the same numbers and the explanation is omitted.
- The ultrasonic
diagnostic device 40 differs from the ultrasonicdiagnostic device 10 in that the former newly includes a bloodstreaminformation calculation unit 402 that generates an image including the bloodstream information. Here, "the image including the bloodstream information (hereafter called the bloodstream image)" is the image that is generally called the color Doppler. "The color Doppler" is a bloodstream image that uses the Doppler effect of the ultrasound by a moving reflection (a group of red blood cells in the case of bloodstream), overlaps two-dimensional distribution such as bloodstream information of a heart or a blood vessel on the tomographic image of the tissue, and displays the overlapped image in colors in real time. Using this color Doppler, it is possible to grasp the bloodstream information in the body part visually by representing the components of velocity that are coming to and going away from theultrasound probing unit 11 with the images of different colors, overlapping the components of velocity on the tomographic images of the tissue, and displaying the overlapped images. - The
control unit 401 has the function of thecontrol unit 101 of the first embodiment and controls the send/receiveunit 12 to send/receive the ultrasound to acquire the tomographic image and the ultrasound to acquire the bloodstream information based on the rule set in advance (e.g. to acquire alternatively) to acquire the image data of the bloodstream image while acquiring the image data of the tomographic image. Further, thecontrol unit 401 sends the two kinds of electric signals received from the send/receiveunit 12 separately to theimage generation unit 102 and the bloodstreaminformation calculation unit 402 following the above-mentioned rule. - The bloodstream
information calculation unit 402 generates the bloodstream information that shows physical characteristics (such as bloodstream velocity, velocity dispersion and the direction of bloodstream) collected by the sampling rate regulated in advance and generates the image data of the bloodstream image based on this bloodstream information. - The synchronization
information addition unit 403 adds the image data of the tomographic image to the image data of the bloodstream image as one set of data, adds the same synchronization information to the added image data and stores the added image data in the imagedata storage unit 107. - Fig. 18 is a diagram that shows the relationship of mutual acquisition timing in the case of acquiring the image data of the tomographic image and the image data of the bloodstream image. Generally, in the case of acquiring the color Doppler image, as shown in Fig. 18, while acquiring the image data of the tomographic image, the
control unit 401 collects data for bloodstream information during the interim. Consequently, when the color Doppler image is displayed by the ultrasonic diagnostic device, the frame rate drops (generally, about 10 [fps]). In the case of displaying the color Doppler image, the synchronizationinformation addition unit 403 overlaps thetomographic image 1701 of gray scale on thebloodstream image 1702 that represents the bloodstream speed with warm color/cold color and generates the combinedimage 1703. In addition, as shown in Fig. 18, the synchronizationinformation addition unit 403 associates thetomographic image 1701 with thebloodstream image 1702 acquired immediately after as one set of data, adds the same synchronization information to the associated image and stores the associated image in the imagedata storage unit 107. - Fig. 19A∼Fig. 19C are diagrams that show how the processing to relate the bloodstream image to the generated synchronization signal is executed. Fig. 19A is an example of the acquired plural tomographic images. Fig. 19B is an example of the generated synchronization signal waveform. Fig. 19C is an example of the acquired plural bloodstream images and a diagram that shows how the processing for relating the generated synchronization signal with the bloodstream image is executed. Fig. 19D is an example of the combined plural images that combine the tomographic images and the bloodstream images. As shown in Fig. 19A∼Fig. 19C, the synchronization
information addition unit 403 associates thesynchronization signal 1802 generated based on thetomographic image 1801 with thebloodstream image 1803 as one set of data, adds the same synchronization information "R" to the associated image and stores the associated image in the imagedata storage unit 107. Further, the synchronizationinformation addition unit 403 generates thecolor Doppler image 1804 by combining thetomographic image 1801 and thebloodstream image 1803 that are associated. - As is described above, since the ultrasonic
diagnostic device 40 according to the fourth embodiment generates the synchronization signal from the acquired tomographic image and displays a color Doppler image of bloodstream and the like based on this synchronization signal, it is possible to associate an ordinary tomographic image with the color Doppler image that have a temporally constant relationship without inputting the synchronization signal from the outside. - In addition, similarly to the first embodiment, it is acceptable to configure the ultrasonic
diagnostic device 40 in order to generate the ECG waveform artificially in thesynchronization generation unit 105.
Claims (27)
- An image processing device (100,200,300,400) that processes a tomographic image of an object that acts cyclically comprising
an image acquisition unit operable to acquire a sequence of image data of a tomographic image of an object by sampling at a constant rate during a predetermined time that is one cycle or more, characterized in that it further comprises:a volume value calculation unit (104) operable to extract contours of the object that change with a passage of time by using the acquired sequence of image data and to calculate a volume value of the object based on the extracted contours; anda synchronization signal generation unit (105) operable to generate a synchronization signal that indicates a timing of same phase in the action of the object based on temporal changes of the calculated volume values. - The image processing device according to claim 1 further comprising a synchronization information addition unit (106) operable to discriminate a phase timing by which individual image data is sampled in the sequence of image data based on the generated synchronization signal and to add synchronization information that indicates that phase timings are the same in plural image data.
- The image processing device according to claim 2 further comprising an image storage unit (107) operable to store the sequence of image data including the image data to which the synchronization information is added.
- The image processing device according to claim 3 further comprising:an image read-out unit (109) operable to read out image data to which the synchronization information is added from the image storage unit;a display unit (111) operable to display a tomographic image based on the read-out image data.
- The image processing device according to claim 4, wherein the synchronization signal generation unit (105) specifies a minimum volume value among the calculated volume values and generates the synchronization signal based on the timing by which the image data that corresponds to the specified minimum value is sampled.
- The image processing device according to claim 4, wherein the synchronization signal generation unit (105) includes:a minimum value specification unit that specifies a minimum volume value among the calculated volume values;a local maximal value specification unit that specifies the local maximal volume value immediately before the specified minimum volume value; anda local minimal value specification unit that specifies the local minimal volume value immediately before the specified local maximal volume value, andthe synchronization signal generation unit generates the synchronization signal at a halfway timing between the timing when the image data that correspond to the specified local maximal volume value is sampled and the timing when the image data that correspond to the specified local minimal volume value is sampled.
- The image processing device according to claim 5 or claim 6, wherein the synchronization signal is a synchronization signal including a pulse waveform and indicates the timing of same phase by a timing of a peak of the pulse waveform.
- The image processing device according to claim 6, wherein the synchronization signal is an R wave of an artificial electrocardiogram signal and indicates the timing of same phase by a timing of a peak of the R wave.
- The image processing device according to claim 7 further comprising:wherein the display unit (310) further reads out information that represents the volume value and information that represents the synchronization signal and displays the two kinds of information together with the tomographic image.a volume value storage unit (302) that stores information which represents the calculated volume values; anda synchronization signal storage unit (306) that stores information that represents the generated synchronization signal,
- The image processing device according to claim 9 further comprising a reception unit operable to receive settings of a reading start point and a reading finish point, wherein the display unit further reads out information that represents volume value between the set reading start point and the set reading finish point and information that represents the synchronization signal and displays the two kinds of information together with the tomographic image.
- The image processing device according to claim 10 further comprising a marker reception unit operable to receive settings of markers, wherein the display unit further displays the set markers in order that the volume value, the synchronization signal and the tomographic image indicate the same phase.
- The image processing device according to claim 7, wherein the display unit includes:a data compression unit that compresses the read-out image data;a memory storage unit that stores the compressed image data into frame memory; andan image display unit that reads out data from the frame memory and displays a tomographic image.
- The image processing device according to claim 12, wherein the image display unit reads out the plural data from the frame memory and displays plural tomographic images.
- The image processing device according to claim 13, wherein the image display unit displays plural tomographic images updating in sequence a temporally old part of the data among the plural read-out data.
- The image processing device according to claim 1 further comprising:a cycle estimate unit operable to judge whether a cycle of the generated synchronization signal is within a certain standard value or not; anda warning notification unit operable to issue a predetermined warning in the case of the cycle being out of the certain standard value.
- The image processing device according to claim 2, wherein the image acquisition unit further generates bloodstream information which represents physical characteristics of bloodstream by sampling based on predetermined rules, and the image processing device further comprises:a bloodstream image generation unit operable to generate image data of a bloodstream image based on the generated bloodstream information; anda correspondence unit operable to associate image data of the tomographic image to which the synchronization information is added with image data of the bloodstream image based on the synchronization signal.
- The image processing device according to Claim 16, wherein the correspondence unit associates image data of a bloodstream image based on sampled data immediately after the image data of the tomographic image are sampled with the image data of the tomographic image.
- An ultrasonic diagnostic device that generates and displays a tomographic image of an object that acts cyclically comprising:an image acquisition unit operable to acquire a sequence of image data of a tomographic image of an object by sampling at a constant rate during a predetermined time that is one cycle or more;a volume value calculation unit (104) operable to extract contours of the object that change with a passage of time by using the acquired sequence of image data and to calculate a volume value of the object based on the extracted contours;a synchronization signal generation unit (105) operable to generate a synchronization signal that indicates a timing of same phase in the action of the object based on temporal changes of the calculated volume values;a synchronization information addition unit (106) operable to discriminate a phase timing by which individual image data is sampled in the sequence of image data based on the generated synchronization signal and to add synchronization information that indicates that phase timings are the same in plural image data; anda display unit operable to display a tomographic image based on the synchronous image data to which the synchronization information is added.
- An image processing method for processing a tomographic image of an object that acts cyclically including an image acquisition step for acquiring a sequence of image data of a tomographic image of an object by sampling at a constant rate during a predetermined time that is one cycle or more,
characterized in that it further includes:a volume value calculation step for extracting contours of the object that change with a passage of time using the acquired sequence of image data and calculating volume values of the object based on the extracted contours; anda synchronization signal generation step for generating a synchronization signal that indicates a timing of same phase in the action of the object based on temporal changes of the calculated volume values. - The image processing method according to claim 19 further including a synchronization information addition step for discriminating a phase timing by which individual image data is sampled in the sequence of image data based on the generated synchronization signal and for adding synchronization information that indicates that phase timings are the same in plural image data.
- The image processing method according to claim 20, wherein in the image acquisition step, bloodstream information which represents physical characteristics of bloodstream is generated by sampling based on predetermined rules, and the image processing method further includes:a bloodstream image generation step for generating image data of a bloodstream image based on the generated bloodstream information; anda correspondence step for associating image data of the tomographic image to which the synchronization information is added with image data of the bloodstream image based on the synchronization signal.
- A program for an image processing device that processes a tomographic image of an object that acts cyclically, the program causing a computer to execute:an image acquisition step for acquiring a sequence of image data of a tomographic image of an object by sampling at a constant rate during a predetermined time that is one cycle or more;a volume value calculation step for extracting contours of the object and calculating volume values of the object based on the extracted contours that change with a passage of time using the acquired sequence of image data; anda synchronization signal generation step for generating a synchronization signal that indicates a timing of same phase in the action of the object based on temporal changes of the calculated volume values.
- The program according to claim 22 further causing the computer to execute a synchronization information addition step for discriminating a phase timing by which individual image data is sampled in the sequence of image data based on the generated synchronization signal and adding synchronization information that indicates that phase timings are the same in plural image data.
- The program according to Claim 23, wherein in the image acquisition step, bloodstream information which represents physical characteristics of bloodstream is generated by sampling based on predetermined rules, and the program further causes the computer to execute:a bloodstream image generation step for generating image data of a bloodstream image based on the generated bloodstream information; anda correspondence step for associating image data of the tomographic image to which the synchronization information is added with the image data of the bloodstream image.
- A program for an ultrasonic diagnostic device that generates and displays a tomographic image of an object that acts cyclically, the program causing a computer to execute:an image acquisition step for acquiring a sequence of image data of a tomographic image of an object by sampling at a constant rate during a predetermined time that is one cycle or more;a volume value calculation step for extracting contours of the object and calculating a volume value of the object based on the extracted contours that change with a passage of time using the acquired sequence of image data;a synchronization signal generation step for generating a synchronization signal that indicates a timing of same phase in the action of the object based on temporal changes of the calculated volume values;a synchronization information addition step for discriminating a phase timing by which individual image data is sampled in the sequence of image data based on the generated synchronization signal and adding synchronization information that indicates that phase timings are the same in plural image data; anda display step for displaying a tomographic image based on synchronous image data to which the synchronization information is added.
- A recording medium that a computer can read and in which a program for an image processing device that processes a tomographic image of an object that acts cyclically is recorded, wherein the program causes a computer to execute:an image acquisition step for acquiring a sequence of image data of a tomographic image of an object by sampling at a constant rate during a predetermined time that is one cycle or more;a volume value calculation step for extracting contours of the object and calculating a volume value of the object based on the extracted contours that change with a passage of time using the acquired sequence of image data ; anda synchronization signal generation step for generating a synchronization signal that indicates a timing of same phase in the action of the object based on temporal changes of the calculated volume values.
- A recording medium that a computer can read and in which a program for an ultrasonic diagnostic device that generates and displays a tomographic image of an object that acts cyclically is recorded, wherein the program causes the computer to execute:an image acquisition step for acquiring a sequence of image data of a tomographic image of an object by sampling at a constant rate during a predetermined time that is one cycle or more;a volume value calculation step for extracting contours of the object and calculating a volume value of the object based on the extracted contours that change with a passage of time using the acquired sequence of image data ;a synchronization signal generation step for generating a synchronization signal that indicates a timing of same phase in the action of the object based on temporal changes of the calculated volume values;a synchronization information addition step for discriminating a phase timing by which individual image data is sampled in the sequence of image data based on the generated synchronization signal and for adding synchronization information that indicates that phase timings are the same in plural image data; anda display step for displaying a tomographic image based on synchronous image data to which the synchronization information is added.
Applications Claiming Priority (2)
| Application Number | Priority Date | Filing Date | Title |
|---|---|---|---|
| JP2002097079 | 2002-03-29 | ||
| JP2002097079A JP3986866B2 (en) | 2002-03-29 | 2002-03-29 | Image processing apparatus and ultrasonic diagnostic apparatus |
Publications (3)
| Publication Number | Publication Date |
|---|---|
| EP1350470A2 EP1350470A2 (en) | 2003-10-08 |
| EP1350470A3 EP1350470A3 (en) | 2003-12-03 |
| EP1350470B1 true EP1350470B1 (en) | 2005-05-11 |
Family
ID=28035875
Family Applications (1)
| Application Number | Title | Priority Date | Filing Date |
|---|---|---|---|
| EP03006727A Expired - Fee Related EP1350470B1 (en) | 2002-03-29 | 2003-03-25 | Image processing device and ultrasonic diagnostic device |
Country Status (8)
| Country | Link |
|---|---|
| US (1) | US6849048B2 (en) |
| EP (1) | EP1350470B1 (en) |
| JP (1) | JP3986866B2 (en) |
| KR (1) | KR20030078760A (en) |
| CN (1) | CN100403989C (en) |
| CA (1) | CA2423635A1 (en) |
| DE (1) | DE60300629T2 (en) |
| ES (1) | ES2242117T3 (en) |
Cited By (3)
| Publication number | Priority date | Publication date | Assignee | Title |
|---|---|---|---|---|
| DE102005029476A1 (en) * | 2005-06-24 | 2007-02-08 | Siemens Ag | Device for carrying out intravascular examinations |
| DE102006013475A1 (en) * | 2006-03-23 | 2007-09-27 | Siemens Ag | Image recording device synchronisation device for use during operational interferences in patient, has recording units for recording periodically recurring, current information of area of patient |
| US7918793B2 (en) | 2005-10-28 | 2011-04-05 | Biosense Webster, Inc. | Synchronization of ultrasound imaging data with electrical mapping |
Families Citing this family (53)
| Publication number | Priority date | Publication date | Assignee | Title |
|---|---|---|---|---|
| JP4189405B2 (en) * | 2003-05-20 | 2008-12-03 | パナソニック株式会社 | Ultrasonic diagnostic equipment |
| JP3867080B2 (en) | 2003-12-11 | 2007-01-10 | ジーイー・メディカル・システムズ・グローバル・テクノロジー・カンパニー・エルエルシー | Ultrasonic diagnostic equipment |
| US7261695B2 (en) * | 2004-03-09 | 2007-08-28 | General Electric Company | Trigger extraction from ultrasound doppler signals |
| JP4644449B2 (en) * | 2004-07-12 | 2011-03-02 | 富士通株式会社 | Image display device and image display program |
| JP4649147B2 (en) * | 2004-08-31 | 2011-03-09 | 株式会社東芝 | Ultrasonic diagnostic equipment |
| JP2006158444A (en) * | 2004-12-02 | 2006-06-22 | Toshiba Corp | X-ray computer tomographic apparatus |
| JP2006197967A (en) * | 2005-01-18 | 2006-08-03 | Toshiba Corp | Ultrasonic diagnostic equipment and ultrasonic image display device |
| JP4589778B2 (en) * | 2005-03-28 | 2010-12-01 | 株式会社東芝 | Ultrasonic diagnostic apparatus and method for generating electrocardiogram synchronization trigger signal of ultrasonic diagnostic apparatus |
| CN101155551A (en) * | 2005-04-07 | 2008-04-02 | 株式会社根本杏林堂 | Image display device |
| US20090105589A1 (en) * | 2005-06-07 | 2009-04-23 | Takashi Osaka | Ultrasonic diagnostic apparatus and method of acquiring ultrasonic elastic image |
| JP4920302B2 (en) * | 2005-06-20 | 2012-04-18 | 株式会社東芝 | Ultrasonic diagnostic apparatus and ultrasonic measurement method |
| KR100863745B1 (en) * | 2005-08-18 | 2008-10-16 | 주식회사 메디슨 | Apparatus and method for processing an ultrasound image in an ultrasound image diagnostic system |
| EP1937152A4 (en) * | 2005-08-19 | 2011-01-05 | Visualsonics Inc | Systems and methods for capture and display of blood pressure and ultrasound data |
| JP2007068726A (en) * | 2005-09-06 | 2007-03-22 | Toshiba Corp | Heart function diagnostic system |
| JP4805669B2 (en) * | 2005-12-27 | 2011-11-02 | 株式会社東芝 | Ultrasonic image processing apparatus and control program for ultrasonic image processing apparatus |
| KR100867588B1 (en) * | 2006-01-06 | 2008-11-10 | 주식회사 메디슨 | Ultrasound system for displaying ultrasound image relating to periodic motion of object and method for the same |
| KR20070078152A (en) * | 2006-01-26 | 2007-07-31 | 주식회사 메디슨 | Apparatus and method for displaying an ultrasound image |
| JP2007287018A (en) * | 2006-04-19 | 2007-11-01 | Fujifilm Corp | Diagnosis support system |
| US9612142B2 (en) | 2006-04-27 | 2017-04-04 | General Electric Company | Method and system for measuring flow through a heart valve |
| ATE466352T1 (en) * | 2006-06-28 | 2010-05-15 | Koninkl Philips Electronics Nv | MODEL-BASED DETERMINATION OF THE CONTRACTION STATUS OF A PERIODICALLY CONTRACTED OBJECT |
| WO2008010135A2 (en) * | 2006-07-14 | 2008-01-24 | Koninklijke Philips Electronics, N.V. | System and method for organizing, recording and displaying images in ultrasound imaging systems |
| JP2008049012A (en) * | 2006-08-28 | 2008-03-06 | Toshiba Corp | Ultrasonic diagnostic apparatus, and program and image display used for the same |
| JP2008059250A (en) * | 2006-08-31 | 2008-03-13 | Toshiba Corp | Image management system, image management method, and image management program |
| JP4994786B2 (en) * | 2006-10-26 | 2012-08-08 | 株式会社日立メディコ | Magnetic resonance imaging system |
| JP4218772B2 (en) * | 2007-02-16 | 2009-02-04 | 国立大学法人名古屋大学 | Diagnostic imaging support device |
| US7860887B2 (en) | 2007-02-20 | 2010-12-28 | The Invention Science Fund I, Llc | Cross-media storage coordination |
| US9008116B2 (en) * | 2007-02-20 | 2015-04-14 | The Invention Science Fund I, Llc | Cross-media communication coordination |
| JP5366372B2 (en) * | 2007-04-23 | 2013-12-11 | 株式会社東芝 | Ultrasonic diagnostic apparatus and ultrasonic image data generation program |
| JP5366385B2 (en) * | 2007-09-26 | 2013-12-11 | 株式会社東芝 | Ultrasonic diagnostic apparatus and ultrasonic scanning program |
| JP4956375B2 (en) * | 2007-10-30 | 2012-06-20 | キヤノン株式会社 | Image processing apparatus and image processing method |
| JP5422117B2 (en) * | 2007-12-20 | 2014-02-19 | 株式会社東芝 | Medical image processing apparatus and medical image photographing apparatus |
| JP5472891B2 (en) * | 2008-01-21 | 2014-04-16 | 株式会社東芝 | Medical image processing device |
| JP5317716B2 (en) * | 2009-01-14 | 2013-10-16 | キヤノン株式会社 | Information processing apparatus and information processing method |
| JP2012000135A (en) * | 2010-06-14 | 2012-01-05 | Hitachi Medical Corp | Multi-modality dynamic image diagnostic apparatus |
| KR101302384B1 (en) * | 2010-07-19 | 2013-09-02 | 삼성메디슨 주식회사 | Ultrasonic Diagnostic Apparatus and the Method thereof |
| JP5444175B2 (en) * | 2010-09-14 | 2014-03-19 | 富士フイルム株式会社 | Image processing apparatus, method, and program |
| KR101194290B1 (en) * | 2010-09-24 | 2012-10-29 | 삼성메디슨 주식회사 | 3d ultrasound system for using image filtering and method for operating 3d ultrasound system |
| JP5498989B2 (en) * | 2011-05-30 | 2014-05-21 | 富士フイルム株式会社 | Image processing apparatus, image processing method, and image processing program |
| JP5501292B2 (en) * | 2011-05-30 | 2014-05-21 | 富士フイルム株式会社 | Image processing apparatus, image processing method, and image processing program |
| DE102011083704A1 (en) * | 2011-09-29 | 2013-04-04 | Siemens Aktiengesellschaft | Angiographic examination procedure |
| CN103156636B (en) * | 2011-12-15 | 2016-05-25 | 深圳迈瑞生物医疗电子股份有限公司 | A kind of supersonic imaging device and method |
| US20130253319A1 (en) * | 2012-03-23 | 2013-09-26 | Ultrasound Medical Devices, Inc. | Method and system for acquiring and analyzing multiple image data loops |
| CN103876835A (en) * | 2012-12-20 | 2014-06-25 | 上海联影医疗科技有限公司 | Medical information display system |
| CN104068845B (en) * | 2014-03-06 | 2016-07-06 | 武汉培威医学科技有限公司 | A kind of electrocardio ultrasonic signal merges dislocation scanning and imaging system and method |
| WO2015190180A1 (en) * | 2014-06-11 | 2015-12-17 | オリンパス株式会社 | Medical diagnostic device, medical diagnostic device operation method, and medical diagnostic device operation program |
| EP3381361B1 (en) * | 2015-11-24 | 2023-12-27 | Advanced Telecommunications Research Institute International | Brain activity analysis device, brain activity analysis method, program, and biomarker device |
| CN108742520A (en) * | 2018-04-09 | 2018-11-06 | 张小磊 | A kind of neurological tactile perception diagnostic device |
| JP7114386B2 (en) * | 2018-07-27 | 2022-08-08 | キヤノンメディカルシステムズ株式会社 | Medical diagnostic imaging equipment and modality control equipment |
| JP7135775B2 (en) * | 2018-11-22 | 2022-09-13 | コニカミノルタ株式会社 | Measuring device and program |
| JP7020392B2 (en) * | 2018-12-25 | 2022-02-16 | 東芝三菱電機産業システム株式会社 | Data collection and playback system |
| CN111803108A (en) * | 2020-08-07 | 2020-10-23 | 上海联影医疗科技有限公司 | Exposure control method and system based on clock synchronization |
| TWI768774B (en) * | 2021-03-17 | 2022-06-21 | 宏碁股份有限公司 | Method for evaluating movement state of heart |
| WO2024071054A1 (en) * | 2022-09-30 | 2024-04-04 | テルモ株式会社 | Image processing device, image display system, image display method, and image processing program |
Family Cites Families (23)
| Publication number | Priority date | Publication date | Assignee | Title |
|---|---|---|---|---|
| JPS5869544A (en) * | 1981-10-20 | 1983-04-25 | 三菱電機株式会社 | M mode ultrasonic diagnostic apparatus |
| JPH0636797B2 (en) * | 1985-05-24 | 1994-05-18 | 株式会社東芝 | Ultrasonic diagnostic equipment |
| JPS63240841A (en) * | 1987-03-30 | 1988-10-06 | 株式会社東芝 | Ultrasonic diagnostic apparatus |
| JPS63318932A (en) * | 1987-06-24 | 1988-12-27 | Toshiba Corp | Ultrasonic diagnostic apparatus |
| JPH02307436A (en) * | 1989-05-23 | 1990-12-20 | Toshiba Corp | Ultrasonic blood flow imaging apparatus |
| JP2777911B2 (en) * | 1989-07-10 | 1998-07-23 | 富士通株式会社 | Display method of ultrasonic diagnostic equipment |
| US6006126A (en) * | 1991-01-28 | 1999-12-21 | Cosman; Eric R. | System and method for stereotactic registration of image scan data |
| JP3069929B2 (en) * | 1992-01-14 | 2000-07-24 | 石原 謙 | Ultrasound diagnostic equipment |
| JPH06154213A (en) * | 1992-11-24 | 1994-06-03 | Matsushita Electric Ind Co Ltd | Ultrasonic diagnosing apparatus |
| US5526442A (en) * | 1993-10-04 | 1996-06-11 | Hitachi Medical Corporation | X-ray radiography method and system |
| JP3713303B2 (en) * | 1994-06-22 | 2005-11-09 | 株式会社東芝 | Ultrasonic diagnostic equipment |
| US5615680A (en) * | 1994-07-22 | 1997-04-01 | Kabushiki Kaisha Toshiba | Method of imaging in ultrasound diagnosis and diagnostic ultrasound system |
| JP3516497B2 (en) * | 1994-12-21 | 2004-04-05 | ジーイー横河メディカルシステム株式会社 | Ultrasound diagnostic equipment |
| JP3647970B2 (en) * | 1996-05-10 | 2005-05-18 | フクダ電子株式会社 | Region extraction device |
| US5872571A (en) * | 1996-05-14 | 1999-02-16 | Hewlett-Packard Company | Method and apparatus for display of multi-planar ultrasound images employing image projection techniques |
| JPH10127631A (en) * | 1996-11-06 | 1998-05-19 | Toshiba Corp | Ultrasonic diagnostic system |
| CN1106825C (en) * | 1997-02-13 | 2003-04-30 | 通用电器横河医疗系统株式会社 | Method of identifying time phase of state of organ to be observed, and ultrasonic diagnostic apparatus based on same |
| AU6673498A (en) * | 1997-03-10 | 1998-09-29 | Robin Medical Inc. | Method and apparatus for the assessment and display of variability in mechanicalactivity of the heart, and enhancement of ultrasound contrast imaging by variab ility analysis |
| JPH11164833A (en) * | 1997-09-30 | 1999-06-22 | Toshiba Corp | Medical image diagnostic apparatus |
| CN1073394C (en) * | 1997-12-05 | 2001-10-24 | 李强 | Method and device for two-dimensional body surface ultrasonic measuring right ventricle volume and function |
| EP1061474A1 (en) * | 1999-06-17 | 2000-12-20 | VAMP Verfahren und Apparate der Medizinischen Physik GmbH | Computer tomograph reducing object motion artifacts and extracting object motion information |
| JP2002097079A (en) | 2000-09-21 | 2002-04-02 | Shinagawa Refract Co Ltd | Brick containing carbon which has low heat conduction layer on backside and method of manufacturing the same |
| JP4614548B2 (en) | 2001-01-31 | 2011-01-19 | パナソニック株式会社 | Ultrasonic diagnostic equipment |
-
2002
- 2002-03-29 JP JP2002097079A patent/JP3986866B2/en not_active Expired - Lifetime
-
2003
- 2003-03-25 ES ES03006727T patent/ES2242117T3/en not_active Expired - Lifetime
- 2003-03-25 DE DE60300629T patent/DE60300629T2/en not_active Expired - Lifetime
- 2003-03-25 EP EP03006727A patent/EP1350470B1/en not_active Expired - Fee Related
- 2003-03-26 US US10/396,418 patent/US6849048B2/en not_active Expired - Lifetime
- 2003-03-27 CA CA002423635A patent/CA2423635A1/en not_active Abandoned
- 2003-03-28 KR KR10-2003-0019517A patent/KR20030078760A/en not_active Application Discontinuation
- 2003-03-31 CN CNB031086128A patent/CN100403989C/en not_active Expired - Fee Related
Cited By (4)
| Publication number | Priority date | Publication date | Assignee | Title |
|---|---|---|---|---|
| DE102005029476A1 (en) * | 2005-06-24 | 2007-02-08 | Siemens Ag | Device for carrying out intravascular examinations |
| US7918793B2 (en) | 2005-10-28 | 2011-04-05 | Biosense Webster, Inc. | Synchronization of ultrasound imaging data with electrical mapping |
| DE102006013475A1 (en) * | 2006-03-23 | 2007-09-27 | Siemens Ag | Image recording device synchronisation device for use during operational interferences in patient, has recording units for recording periodically recurring, current information of area of patient |
| US8411921B2 (en) | 2006-03-23 | 2013-04-02 | Siemens Aktiengesellschaft | Device and method for synchronizing an image capture device with a pre-operative image data set |
Also Published As
| Publication number | Publication date |
|---|---|
| CN100403989C (en) | 2008-07-23 |
| EP1350470A2 (en) | 2003-10-08 |
| DE60300629D1 (en) | 2005-06-16 |
| US6849048B2 (en) | 2005-02-01 |
| US20030187350A1 (en) | 2003-10-02 |
| JP3986866B2 (en) | 2007-10-03 |
| ES2242117T3 (en) | 2005-11-01 |
| CN1448113A (en) | 2003-10-15 |
| DE60300629T2 (en) | 2006-02-02 |
| KR20030078760A (en) | 2003-10-08 |
| EP1350470A3 (en) | 2003-12-03 |
| JP2003290225A (en) | 2003-10-14 |
| CA2423635A1 (en) | 2003-09-29 |
Similar Documents
| Publication | Publication Date | Title |
|---|---|---|
| EP1350470B1 (en) | Image processing device and ultrasonic diagnostic device | |
| US10410409B2 (en) | Automatic positioning of standard planes for real-time fetal heart evaluation | |
| US6488629B1 (en) | Ultrasound image acquisition with synchronized reference image | |
| US10448921B2 (en) | Ultrasound systems and methods for automated fetal heartbeat identification | |
| JP5192697B2 (en) | Ultrasonic diagnostic equipment | |
| US8460192B2 (en) | Ultrasound imaging apparatus, medical image processing apparatus, display apparatus, and display method | |
| JP5715123B2 (en) | Ultrasound diagnostic imaging system and method using three-dimensional fetal heart imaging method with non-ECG biological synchronization collection | |
| JP5889886B2 (en) | Automatic heart rate detection for 3D ultrasound fetal imaging | |
| JP5105981B2 (en) | MEDICAL IMAGE PROCESSING DISPLAY DEVICE AND PROCESSING PROGRAM THEREOF | |
| CN101896123A (en) | Robotic ultrasound system with microadjustment and positioning control using feedback responsive to acquired image data | |
| US20140343427A1 (en) | Diagnostic imaging apparatus and image display method | |
| WO2012161040A1 (en) | Ultrasonic diagnosis device and method for presenting items for inspection | |
| JP3187008B2 (en) | Ultrasound color Doppler tomography | |
| CN111317508B (en) | Ultrasonic diagnostic apparatus, medical information processing apparatus, and computer program product | |
| JP4268695B2 (en) | Diagnostic imaging apparatus and ultrasonic diagnostic apparatus | |
| JPH09140711A (en) | Automatic time phase discriminating method and ultrasonic diagnostic device | |
| JP2002336255A (en) | Ultrasonic diagnostic equipment | |
| JP4527838B2 (en) | Ultrasonic diagnostic equipment | |
| JPH08117236A (en) | Ultrasonic diagnostic device | |
| JP2803329B2 (en) | Doppler tomographic ultrasound system |
Legal Events
| Date | Code | Title | Description |
|---|---|---|---|
| PUAI | Public reference made under article 153(3) epc to a published international application that has entered the european phase |
Free format text: ORIGINAL CODE: 0009012 |
|
| AK | Designated contracting states |
Kind code of ref document: A2 Designated state(s): AT BE BG CH CY CZ DE DK EE ES FI FR GB GR HU IE IT LI LU MC NL PT SE SI SK TR |
|
| AX | Request for extension of the european patent |
Extension state: AL LT LV MK RO |
|
| PUAL | Search report despatched |
Free format text: ORIGINAL CODE: 0009013 |
|
| AK | Designated contracting states |
Kind code of ref document: A3 Designated state(s): AT BE BG CH CY CZ DE DK EE ES FI FR GB GR HU IE IT LI LU MC NL PT SE SI SK TR |
|
| AX | Request for extension of the european patent |
Extension state: AL LT LV MK RO |
|
| RIC1 | Information provided on ipc code assigned before grant |
Ipc: 7A 61B 8/06 B Ipc: 7G 06T 7/20 B Ipc: 7G 06T 11/00 A |
|
| 17P | Request for examination filed |
Effective date: 20040324 |
|
| 17Q | First examination report despatched |
Effective date: 20040420 |
|
| AKX | Designation fees paid |
Designated state(s): DE ES FR GB IT NL |
|
| GRAP | Despatch of communication of intention to grant a patent |
Free format text: ORIGINAL CODE: EPIDOSNIGR1 |
|
| GRAS | Grant fee paid |
Free format text: ORIGINAL CODE: EPIDOSNIGR3 |
|
| GRAA | (expected) grant |
Free format text: ORIGINAL CODE: 0009210 |
|
| AK | Designated contracting states |
Kind code of ref document: B1 Designated state(s): DE ES FR GB IT NL |
|
| REG | Reference to a national code |
Ref country code: GB Ref legal event code: FG4D |
|
| REF | Corresponds to: |
Ref document number: 60300629 Country of ref document: DE Date of ref document: 20050616 Kind code of ref document: P |
|
| REG | Reference to a national code |
Ref country code: ES Ref legal event code: FG2A Ref document number: 2242117 Country of ref document: ES Kind code of ref document: T3 |
|
| ET | Fr: translation filed | ||
| PLBE | No opposition filed within time limit |
Free format text: ORIGINAL CODE: 0009261 |
|
| STAA | Information on the status of an ep patent application or granted ep patent |
Free format text: STATUS: NO OPPOSITION FILED WITHIN TIME LIMIT |
|
| 26N | No opposition filed |
Effective date: 20060214 |
|
| PGFP | Annual fee paid to national office [announced via postgrant information from national office to epo] |
Ref country code: NL Payment date: 20090315 Year of fee payment: 7 |
|
| PGFP | Annual fee paid to national office [announced via postgrant information from national office to epo] |
Ref country code: ES Payment date: 20090401 Year of fee payment: 7 |
|
| PGFP | Annual fee paid to national office [announced via postgrant information from national office to epo] |
Ref country code: FR Payment date: 20090316 Year of fee payment: 7 |
|
| REG | Reference to a national code |
Ref country code: NL Ref legal event code: V1 Effective date: 20101001 |
|
| REG | Reference to a national code |
Ref country code: FR Ref legal event code: ST Effective date: 20101130 |
|
| PG25 | Lapsed in a contracting state [announced via postgrant information from national office to epo] |
Ref country code: FR Free format text: LAPSE BECAUSE OF NON-PAYMENT OF DUE FEES Effective date: 20100331 Ref country code: NL Free format text: LAPSE BECAUSE OF NON-PAYMENT OF DUE FEES Effective date: 20101001 |
|
| REG | Reference to a national code |
Ref country code: ES Ref legal event code: FD2A Effective date: 20111118 |
|
| PG25 | Lapsed in a contracting state [announced via postgrant information from national office to epo] |
Ref country code: ES Free format text: LAPSE BECAUSE OF NON-PAYMENT OF DUE FEES Effective date: 20100326 |
|
| REG | Reference to a national code |
Ref country code: DE Ref legal event code: R082 Ref document number: 60300629 Country of ref document: DE Representative=s name: PRUEFER & PARTNER GBR, DE Ref country code: DE Ref legal event code: R082 Ref document number: 60300629 Country of ref document: DE Representative=s name: PATENTANWAELTE HENKEL, BREUER & PARTNER, DE |
|
| REG | Reference to a national code |
Ref country code: DE Ref legal event code: R082 Ref document number: 60300629 Country of ref document: DE Representative=s name: PATENTANWAELTE HENKEL, BREUER & PARTNER, DE |
|
| REG | Reference to a national code |
Ref country code: DE Ref legal event code: R082 Ref document number: 60300629 Country of ref document: DE Representative=s name: PATENTANWAELTE HENKEL, BREUER & PARTNER, DE |
|
| PGFP | Annual fee paid to national office [announced via postgrant information from national office to epo] |
Ref country code: IT Payment date: 20140306 Year of fee payment: 12 |
|
| REG | Reference to a national code |
Ref country code: DE Ref legal event code: R082 Ref document number: 60300629 Country of ref document: DE Representative=s name: PATENTANWAELTE HENKEL, BREUER & PARTNER, DE Effective date: 20140319 Ref country code: DE Ref legal event code: R081 Ref document number: 60300629 Country of ref document: DE Owner name: KONICA MINOLTA, INC., JP Free format text: FORMER OWNER: PANASONIC CORPORATION, KADOMA-SHI, JP Effective date: 20140211 Ref country code: DE Ref legal event code: R081 Ref document number: 60300629 Country of ref document: DE Owner name: KONICA MINOLTA, INC., JP Free format text: FORMER OWNER: PANASONIC CORP., KADOMA-SHI, JP Effective date: 20140506 Ref country code: DE Ref legal event code: R082 Ref document number: 60300629 Country of ref document: DE Representative=s name: PATENTANWAELTE HENKEL, BREUER & PARTNER, DE Effective date: 20140211 Ref country code: DE Ref legal event code: R082 Ref document number: 60300629 Country of ref document: DE Representative=s name: PATENTANWAELTE HENKEL, BREUER & PARTNER, DE Effective date: 20140506 Ref country code: DE Ref legal event code: R081 Ref document number: 60300629 Country of ref document: DE Owner name: KONICA MINOLTA, INC., JP Free format text: FORMER OWNER: PANASONIC CORPORATION, KADOMA-SHI, OSAKA, JP Effective date: 20140211 Ref country code: DE Ref legal event code: R081 Ref document number: 60300629 Country of ref document: DE Owner name: KONICA MINOLTA, INC., JP Free format text: FORMER OWNER: PANASONIC CORPORATION, KADOMA-SHI, OSAKA, JP Effective date: 20140506 |
|
| PGFP | Annual fee paid to national office [announced via postgrant information from national office to epo] |
Ref country code: GB Payment date: 20150325 Year of fee payment: 13 |
|
| PG25 | Lapsed in a contracting state [announced via postgrant information from national office to epo] |
Ref country code: IT Free format text: LAPSE BECAUSE OF NON-PAYMENT OF DUE FEES Effective date: 20150325 |
|
| GBPC | Gb: european patent ceased through non-payment of renewal fee |
Effective date: 20160325 |
|
| PG25 | Lapsed in a contracting state [announced via postgrant information from national office to epo] |
Ref country code: GB Free format text: LAPSE BECAUSE OF NON-PAYMENT OF DUE FEES Effective date: 20160325 |
|
| PGFP | Annual fee paid to national office [announced via postgrant information from national office to epo] |
Ref country code: DE Payment date: 20180313 Year of fee payment: 16 |
|
| REG | Reference to a national code |
Ref country code: DE Ref legal event code: R119 Ref document number: 60300629 Country of ref document: DE |
|
| PG25 | Lapsed in a contracting state [announced via postgrant information from national office to epo] |
Ref country code: DE Free format text: LAPSE BECAUSE OF NON-PAYMENT OF DUE FEES Effective date: 20191001 |