EP1510939A1 - A method of providing a visualisation graph on a computer and a computer for providing a visualisation graph - Google Patents
A method of providing a visualisation graph on a computer and a computer for providing a visualisation graph Download PDFInfo
- Publication number
- EP1510939A1 EP1510939A1 EP03078584A EP03078584A EP1510939A1 EP 1510939 A1 EP1510939 A1 EP 1510939A1 EP 03078584 A EP03078584 A EP 03078584A EP 03078584 A EP03078584 A EP 03078584A EP 1510939 A1 EP1510939 A1 EP 1510939A1
- Authority
- EP
- European Patent Office
- Prior art keywords
- entities
- graph
- visualisation
- node
- query
- Prior art date
- Legal status (The legal status is an assumption and is not a legal conclusion. Google has not performed a legal analysis and makes no representation as to the accuracy of the status listed.)
- Ceased
Links
- 238000012800 visualization Methods 0.000 title claims abstract description 56
- 238000000034 method Methods 0.000 title claims abstract description 21
- 238000012545 processing Methods 0.000 claims description 5
- 238000013459 approach Methods 0.000 description 5
- 239000013598 vector Substances 0.000 description 4
- 230000000694 effects Effects 0.000 description 3
- 238000004880 explosion Methods 0.000 description 3
- 230000000007 visual effect Effects 0.000 description 2
- 230000001133 acceleration Effects 0.000 description 1
- 230000015572 biosynthetic process Effects 0.000 description 1
- 238000004891 communication Methods 0.000 description 1
- 238000013016 damping Methods 0.000 description 1
- 230000001419 dependent effect Effects 0.000 description 1
- 238000005516 engineering process Methods 0.000 description 1
- 238000003780 insertion Methods 0.000 description 1
- 230000037431 insertion Effects 0.000 description 1
- 230000011218 segmentation Effects 0.000 description 1
- 238000004088 simulation Methods 0.000 description 1
Images


Classifications
-
- G—PHYSICS
- G06—COMPUTING; CALCULATING OR COUNTING
- G06F—ELECTRIC DIGITAL DATA PROCESSING
- G06F16/00—Information retrieval; Database structures therefor; File system structures therefor
- G06F16/90—Details of database functions independent of the retrieved data types
- G06F16/903—Querying
- G06F16/9038—Presentation of query results
-
- Y—GENERAL TAGGING OF NEW TECHNOLOGICAL DEVELOPMENTS; GENERAL TAGGING OF CROSS-SECTIONAL TECHNOLOGIES SPANNING OVER SEVERAL SECTIONS OF THE IPC; TECHNICAL SUBJECTS COVERED BY FORMER USPC CROSS-REFERENCE ART COLLECTIONS [XRACs] AND DIGESTS
- Y10—TECHNICAL SUBJECTS COVERED BY FORMER USPC
- Y10S—TECHNICAL SUBJECTS COVERED BY FORMER USPC CROSS-REFERENCE ART COLLECTIONS [XRACs] AND DIGESTS
- Y10S707/00—Data processing: database and file management or data structures
- Y10S707/99931—Database or file accessing
- Y10S707/99933—Query processing, i.e. searching
-
- Y—GENERAL TAGGING OF NEW TECHNOLOGICAL DEVELOPMENTS; GENERAL TAGGING OF CROSS-SECTIONAL TECHNOLOGIES SPANNING OVER SEVERAL SECTIONS OF THE IPC; TECHNICAL SUBJECTS COVERED BY FORMER USPC CROSS-REFERENCE ART COLLECTIONS [XRACs] AND DIGESTS
- Y10—TECHNICAL SUBJECTS COVERED BY FORMER USPC
- Y10S—TECHNICAL SUBJECTS COVERED BY FORMER USPC CROSS-REFERENCE ART COLLECTIONS [XRACs] AND DIGESTS
- Y10S707/00—Data processing: database and file management or data structures
- Y10S707/99941—Database schema or data structure
- Y10S707/99944—Object-oriented database structure
- Y10S707/99945—Object-oriented database structure processing
-
- Y—GENERAL TAGGING OF NEW TECHNOLOGICAL DEVELOPMENTS; GENERAL TAGGING OF CROSS-SECTIONAL TECHNOLOGIES SPANNING OVER SEVERAL SECTIONS OF THE IPC; TECHNICAL SUBJECTS COVERED BY FORMER USPC CROSS-REFERENCE ART COLLECTIONS [XRACs] AND DIGESTS
- Y10—TECHNICAL SUBJECTS COVERED BY FORMER USPC
- Y10T—TECHNICAL SUBJECTS COVERED BY FORMER US CLASSIFICATION
- Y10T70/00—Locks
- Y10T70/50—Special application
- Y10T70/5093—For closures
- Y10T70/5155—Door
- Y10T70/5199—Swinging door
- Y10T70/5204—Interfitting lock housing and keeper
Definitions
- the invention relates to a method of providing a visualisation graph on a computer and a computer for providing a visualisation graph.
- Visualisation graphs are tools which allow data to be handled and displayed on a display device according to certain criteria.
- the primary objective of navigation graphs is to display systems of complex interrelationships between entities, e.g. in a database or the world wide web.
- Visualisation graphs can be based on a semantic net including all entity types occurring, where the considered entities are linked to each other by various kinds of relations.
- a visualization graph represents entities as boxes, often referred to as "nodes" of the graph, and relations as lines between the boxes.
- a common way of solving the problem of graphical layout is applying a physical simulation where all entities are treated as masses repulsing each other and the relations are treated as elastic lines trying to pull connected entities together.
- a method of providing a visualisation graph on a computer comprising the steps of:
- a computer for providing a visualisation graph comprising:
- a user terminal comprising means operable to perform the any of the methods according to the first aspect of the invention.
- a program storage device readable by a processing apparatus, said device embodying a program of instructions executable by the processor to perform the steps of any one of the methods according to the first aspect of the invention.
- Figures 1-8 show visualisation graphs according to examples of embodiments of the present invention.
- Figure 3 shows details of a visualisation graph 1 wherein a plurality of entities 2 are displayed. Each entity is represented by a square box.
- the entities 2 shown in Figure 3 are represent top level types, referred to hereinafter as types.
- Figure 4 shows details of a visualisation graph 1 wherein a plurality of sub-entities 4 are displayed. Each sub-entity 4 is represented by a square box.
- the sub-entities 4 shown in Figure 4 represent second level entity types, hereinafter referred to as sub-types.
- the entities 2 and sub-entities are typically modelled as a mass. There is a repulsive force exerted by a repulsor between each pair of entities.
- the repulsive force may be inversely proportional to the distance or the square of the distance, or any other inverse relationship.
- the relations 8 between entities are modelled as springs, typically linear springs. The model provides damping to ensure that the system converges.
- the system is modelled to adopt the lowest energy level.
- the distance and repulsive force is calculated from other entities and nodes. The forces are added to obtain a force vector. The reaction of the system in terms of acceleration and deceleration is dependent on the force vector.
- Groups of entities sharing at least one relation 8 may be bundled together and displayed as a node 9, as seen in Figure 1.
- Nodes 9 and entities 2 may be displayed together on the same graph as seen in Figure 1, wherein relations 8 common to entities 2 and nodes 9 are displayed as a line linking the appropriate entities and/or nodes.
- Any particular graph may be arranged so that the relations 8 with respect to a particular entity 2, 4 or node 9 are displayed.
- the entity 2, 4 or node 9 in question is referred to as the focus entity or node 10 and is typically displayed in a central region of the graph.
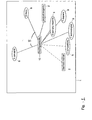
- Figure 1 shows a visualisation graph according to an example of an embodiment of the present invention.
- Figure 1 shows a focus entity 10 with related entities 2 and those comprised in nodes 9, clustered by entity type.
- the dashed lines indicate indirectly related items, "competitors", "market”, selected due to user preferences.
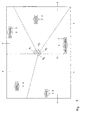
- Figure 2 shows further details of the visualisation graph shown in Figure 1.
- Figure 2 depicts a display of a group's common relations 8 as indicated when a mouse, or other indicator adapted for use with a computer, is passed over the desired node (MouseOver).
- a visualisation graph 1 getting crowded and the data complex to navigate as a result
- groups of entities 9 with common relations 8 are bundled and displayed as group nodes 9 (Fig.
- the common relation 8 of the entities of a particular group node defines the focus entity. Of all possible groupings those are selected which result in the most even distribution of entities 2 (also referred as elements) over the groups and which form groups of entities 2 (elements) which have at least two relations 8 in common.
- the common relations 8 may be explicitly assigned to each entity in a group, but they may also be abstractions of the individual relations 8. This embodiment is shown in Fig. 2, where the common relations 8 of the group " sanitary napkins" are displayed: each of these products has got a relation 8 "refers to German market” and a relation 8 "has property biodegradability". These are direct relations 8. For example, two products in the group are sold by the company having access to the graph, the remaining products are sold by competing companies. Since the semantic net contains the information that all those are companies, a common abstract relation 8 "is sold by some company” is created, which also characterizes the elements of the group.
- the selection code is dynamic resulting in a dynamic grouping of the entities. That is, depending on certain criteria such as the context, the selection and abstraction, if applied, may at different times provide different groupings.
- the method may include the further step of:
- facets are introduced.
- the user may define facets for each entity type. "Types" are discussed in more detail below with reference to Figures 3 and 4. Facets are predefined groups which are characterized by the entity type of their elements or the kind of relation 8 which connects their elements to the focus entity. In the example, the following facets have been defined for product properties: knowledge, products, technologies, persons, life cycle phases, companies, ideas, insights, facts, concepts, approaches, activities.
- facets are defined, all entities related to the focus entity will be sorted into the corresponding facets (groups) and the dynamic grouping algorithm is used only to subdivide these facets into smaller groups (if possible).
- Figures 3 and 4 show examples of embodiments of the present invention.
- Figure 3 shows the position of attractors for top-level entity types, also referred to as “types” and
- Figure 4 shows the approximate position of attractors for second-level entity types, also referred to as "sub-types”.
- Figure 3 shows details of a visualisation graph 1 wherein a plurality of entities 2 are displayed. Associated with each entity is an attractor 3. The attractors do not appear on the graph to a user, but are schematically depicted as dotted circles 3 . To facilitate orientation, certain types (or kinds) of entities 2 are arranged to appear in the same sector 4 of the graph 1. According to further embodiments of the present invention, a 360°-approach is proposed.
- a further embodiment is based on a non-deterministic approach, using attractors and repulsors.
- a second further embodiment is based on a deterministic approach using a dynamic, but deterministic, subdivision of the screen and screen areas into sectors and sub-sectors, wherein entity types are allocated to sectors and entity sub-types are allocated to sub-sectors, respectively.
- the angle theta 1- theta 4 of each attractor 3 with respect to a reference may be set by customizing and is inherited by all subtypes (refer to Figure 4 which depicts subtypes 6, wherein subtypes are entities 2 which have a type falling within the scope of a top-level type.
- Figure 4 "strategic business planning" is a sub-type of "activity”. It is seen in Figures 3 and 4 that within each sector 4, 7 the entities to be placed are arranged in Figure 3 in an ellipse, whereas in Figure 4, because there are more entities to be arranged, and thus force vectors are more complex, in each sector 4, the sub-type entities, rather than being arranged in an ellipse are arranged in a more nebulous arrangement.
- Figure 4 shows the approximate location of the attractors 3 as dotted lines. It will be understood that the negotiation of sector size determined in accordance with the number of entities and how they are to be distributed causes the graph to have a particular fuzziness. As mentioned, this is achieved by the provision of the attractors 3. In contrast, in conventional graphs, there is no flexibility in the system to expand or contract a sector beyond or within its boundary, respectively, should the need arise when entities are either added or taken away from the sector.
- a second further deterministic embodiment is now described.
- the principle of the second further embodiment may be used to arrange nodes (refer to Figure 4) in a navigation graph without the use of repulsors and/or attractors.
- the display which is typically a computer screen, is divided into sectors 4 assigned to the respective top-level entity types 2.
- the size of each sector depends on the number of entities or nodes it contains, including all visible subtypes 6. For example, if a larger number of entities are to be placed in a particular sector, that sector will become larger.
- the sectors are recursively divided into subtype sectors 7 and again, their relative size depends on the number of entities they contain.
- the segmentation of the screen is repeated each time that entities are added to or removed from the graph 1.
- the distance of the entities or nodes to the center of the graph is an oscillating function of the angle in order to avoid collisions (which in the simulative approach are avoided by the repulsive force between entities). It will be understood that whilst the first and second further embodiments may be alternatively implemented, a combination of the first and second embodiments may also be implemented.
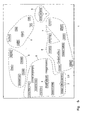
- Figures 5-8 show visualisation graphs according to further examples of embodiments of the present invention.
- Figure 5 depicts an exploding group 15, wherein association of members to group remains visible.
- Figure 6 depicts a display of entity type 16 as viewed with the MouseOver function.
- Figure 7 depicts an explosion of a group into subgroups 17.
- Figure 8 depicts the explosion of a subgroup 18.
- an embodiment of the present invention allows the formation of groups in a 2D visualisation graph whilst keeping it clear. According to an embodiment of the present invention this is achieved by keeping the space required for the nodes minimal and the origin of the added nodes traceable. Further, the graph is rearranged in a smooth way to avoid confusion of the user. According to an embodiment of the invention, the following steps are taken:
- the method according to an embodiment of the present invention may include the further steps of: representing a plurality of entities 2 having a common relation 8 as a first node 9 on the visualisation graph 1, and in response to a predetermined stimulus causing the entities 2 comprised at the first node 9 to be displayed, and in response to a further predetermined stimulus causing the graph to restructure so that the entities 2 displayed are replaced by the node 9.
- a predetermined stimulus causing the entities 2 comprised at the first node 9 to be displayed
- the visualisation graph layout is such that the number of nodes is kept low without missing out potentially relevant information.
- d ⁇ d max the distance is the number of relations 8 on the shortest path between a node and the focus node. Since the number of nodes usually increases exponentially with d max , a value of 1 or 2 is appropriate for most purposes.
- entities of certain types may be included in the graph even if they are far more distant to the focus, if they are considered to be of special interest in the current context either due to their entity type or due to the kind of relations 8 linking them to the focus node.
- the context information in this case can be made up, but is not limited, from the following components:
- the method includes the further steps of: storing 24 data corresponding to a plurality of entities and/or nodes 2, 9, wherein a semantic net includes the entities and/or nodes 2, 9 and wherein the entities and/or nodes 2, 9 are linked to each other by a plurality of relations 8, generating a query, performing the query on the data, and outputting at least two of the plurality of data in the form of a visualisation graph 1 representing the results of the query, wherein the graph 1 has a focus entity or node 10 defined by a user or said query, and using context information to determine at least one entity and/or node 2, 9 to be output in said results which is indirectly related to said focus 10.
- the user By providing the possibility to display entities which are indirectly related to the "focus” entity based on the current context and user preferences, the user is able to collect additional information even if there is no direct relationship between entities. Thus, allowing the user to "jump" from context to context within the graph.
- the present invention allows a user to find how large amounts of data are related. The user is able to navigate and explore knowledge domains in a visual way.
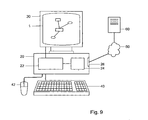
- Figure 9 shows a typical computer arrangement for carrying out the methods according to embodiments of the invention.
- a computer 20 including a central processing unit (CPU) 22.
- the computer further includes a storage medium, which may be located in the CPU 22 and/or elsewhere.
- processor readable code is stored, which may be read by the CPU 22 to provide a visualisation graph.
- Various codes may be stored the code may include: selection code processable to select those entities from the plurality of entities having a common relation 8 and storing the selected entities as a plurality of groups, representation code processable to represent the groups on the graph as a plurality of nodes, wherein only those relations 8 which all of the nodes have in common are represented, abstraction code processable to abstract the relations 8 to identify the common relation 8.
- the code may further include representation code processable to represent a plurality of entities having a common relation 8 as a node 9 on the visualisation graph, and in response to a predetermined stimulus causing the entities 2 comprised at the node 9 to be displayed, and in response to a further predetermined stimulus, for example, as may be instigated by a mouse click, causing the graph to restructure so that the entities 9 displayed are replaced by the node 9.
- a display device 30 such as a screen, for displaying a visualisation graph 1.
- the user may use a keyboard 40, mouse 42 or other operating device to communicate with the computer 20 and to instruct the computer to perform a query.
- the query may be generated automatically. It may alternatively be generated by a user.
- Context information may be defined in the query. Alternatively, it may not form part of the query, and may be defined in some other way, for example, by user preferences.
- a computer 20 for providing a visualisation graph 1, the computer 20 may comprise: a database 24, 60 for storing data corresponding to a plurality of entities and/or nodes 2, 9, wherein a semantic net includes said entities and/or nodes 2, 9 and wherein said entities and/or nodes 2, 9 are linked to each other by a plurality of relations 8, a storage medium 22 having recorded therein processor readable code processable to provide a visualisation graph 1, said code including a query code processable to perform a query on said database, an output device 30 for outputting at least two of said plurality of data in the form of a visualisation graph 1 representing the results of said query, wherein said graph 1 has a focus entity or node 10 defined by a user or said query, wherein said code further includes context code processable to express context information which is processable to determine at least one entity and/or node to be output in said results which is indirectly related to said focus 10.
- the context code may be processable to allow at least one entity 2 and/or node 9 to be output in said results which are indirectly related by more than two relations 8.
- the context code may also be processable to enable identification of at least one entity and /or node 2, 9 having a particular interest with respect to the focus 10, and/or may be processable to identify a particular interest on the basis of an entity 2 or node 9 type or due to the relations 8 linking the entity and/or node 2, 9 to the focus 10.
- the context code may be determined by any or a combination of: at least one predetermined user preference, information associated with said focus, or a user's current role and/or session history query.
- further codes may be stored, such as: an allocator code processable to allocate the entities to a predetermined sector of the graph depending on their entity type, additional entity allocator code processable so that if an additional entity of a particular entity type is stored in a storing step, the location on the graph of the allocated entities is adapted in accordance with the additional entity.
- the allocator code may include a plurality of attractor codes processable to attract the entities to a predetermined sector of the graph depending on their entity type, respectively, a plurality of repulsor codes processable to repulse the entities allocated to the predetermined sector from one another.
- the attractor codes and the repulsor codes are processable so that the location of an entity on a graph is determined by the sum of the influence exerted on the entity by the attractor code and the repulsor codes.
- the allocator code may further comprise dividing code processable to divide the graph into sectors, wherein an entity is allocated to one of the sectors according to its entity type, and further dividing code processable to further divide the sectors into sub-sectors, wherein an entity is allocated to one of the sub-sectors in accordance with its entity sub-type, wherein the size of the sectors and the sub-sectors is determined in accordance with the number of entities of a particular type allocated to the sector and the number of entities of a particular sub-type allocated to the sub-sector, respectively.
- the allocator code may also include repeater code processable to activate the dividing code if the number of entities to be displayed on a graph changes.
- the processable code may further comprise selection code processable to select those entities from the plurality of entities having a common relation 8 and storing the selected entities as a plurality of groups, representation code processable to represent the groups on the graph as a plurality of nodes, wherein only those relations 8 which all of the nodes have in common are represented.
- the database 24 in which data for building the graph is stored may be located locally at the computer 20.
- the database 60 or an additional database may be located remotely from the computer 20.
- the computer is provided with means to remotely access a remote database.
- a modem 26 connected via the internet 50 or other network or communications link to the remote database 60.
- the embodiment shown in Figure 9 is a typical internet configuration, other configurations may also be possible.
- a stand-alone configuration is also envisaged.
- the database may be distributed over more than one computer. Whilst parts of the processing may be performed on the user's computer, other parts of the processing may be performed remotely at a remote computer.
- the visualisation graph is concerned with aspects of company dealing with personal hygiene products.
- the invention is not limited in this respect.
- the present invention finds application in any sphere where data is to be navigated. In particular, where complex interrelationships of data are to be navigated. Further applications are found where data in one or more databases is somehow related to one another. Further applications include internet applications, where metadata is accessed and used.
- the expression "visualisation graph” is intended to cover visual representations, such as navigation graphs and other such tools.
Abstract
in response to a query with respect to an entity selected from said plurality of entities, providing a visualisation graph representing the results of said query, and
selecting those entities from said plurality of entities having at least one common relation and storing said selected entities as a plurality of groups.
Description
It has been found that conventional visualisation graphs suffer drawbacks. One problem with conventional visualisation graphs is that when the number of entities becomes large, the display becomes crowded. This leads to an inefficient use of the display. Also, it becomes more difficult for the user to access information easily.
In particular, it is an object of the present invention to visualize complex interrelationships, for example in a semantic net, in a graph, in a flexible way, allowing the display to be used in an efficient manner.
The
Figure 2 shows further details of the visualisation graph shown in Figure 1. In particular, Figure 2 depicts a display of a group's
As shown in Figures 1 and 2, to avoid a
The selection code is dynamic resulting in a dynamic grouping of the entities. That is, depending on certain criteria such as the context, the selection and abstraction, if applied, may at different times provide different groupings.
In the example, the following facets have been defined for product properties: knowledge, products, technologies, persons, life cycle phases, companies, ideas, insights, facts, concepts, approaches, activities.
Figure 3 shows details of a
To facilitate orientation, certain types (or kinds) of
According to further embodiments of the present invention, a 360°-approach is proposed. A further embodiment is based on a non-deterministic approach, using attractors and repulsors. A second further embodiment, is based on a deterministic approach using a dynamic, but deterministic, subdivision of the screen and screen areas into sectors and sub-sectors, wherein entity types are allocated to sectors and entity sub-types are allocated to sub-sectors, respectively.
It will be understood that the negotiation of sector size determined in accordance with the number of entities and how they are to be distributed causes the graph to have a particular fuzziness. As mentioned, this is achieved by the provision of the
The principle of the second further embodiment may be used to arrange nodes (refer to Figure 4) in a navigation graph without the use of repulsors and/or attractors.
Figure 6 depicts a display of
As mentioned, in contrast to conventional visualisation graphs, an embodiment of the present invention allows the formation of groups in a 2D visualisation graph whilst keeping it clear. According to an embodiment of the present invention this is achieved by keeping the space required for the nodes minimal and the origin of the added nodes traceable. Further, the graph is rearranged in a smooth way to avoid confusion of the user. According to an embodiment of the invention, the following steps are taken:
- before exploding, the group node increases repulsive force proportionally to the number of entities to be inserted in order to make room for the new nodes. The actual insertion begins, when the neighbour nodes have moved sufficiently far away.
- Although the new nodes inserted into to the graph have a
direct relation 8 to the "focus"node 10, thisrelation 8 is only displayed indirectly: the new entities are connected to the group node which remains in the graph as "bundler" without label and establishes therelation 8 to the "focus"node 10. Thus the number of lines connected to thecenter node 10 remains low. - While a group "bundler"
node 11 doesn't have a label in order to save space, the group's characteristics are shown when the user moves the mouse pointer over the "bundler"node 11, in the same way as shown in Fig. 2. - Double-clicking a "bundler"
node 11 causes group to collapse again into one node. - The recursive explosion and collapsing of
subgroups 18 is also possible (Fig. 7,8).
In order to enhance navigation of the visualisation graph, entities of certain types may be included in the graph even if they are far more distant to the focus, if they are considered to be of special interest in the current context either due to their entity type or due to the kind of
The context information in this case can be made up, but is not limited, from the following components:
- Current user's general preferences,
- Context information attached to the "focus" node, and
- Current user's current role and/or session history.
More sophisticated algorithms may be applied to find entities of special interest and it is even possible to let the user create context specific algorithms by means of a scripting language or macro recorder.
Also provided is a
The user may use a
The allocator code may further comprise dividing code processable to divide the graph into sectors, wherein an entity is allocated to one of the sectors according to its entity type, and further dividing code processable to further divide the sectors into sub-sectors, wherein an entity is allocated to one of the sub-sectors in accordance with its entity sub-type, wherein the size of the sectors and the sub-sectors is determined in accordance with the number of entities of a particular type allocated to the sector and the number of entities of a particular sub-type allocated to the sub-sector, respectively.
The allocator code may also include repeater code processable to activate the dividing code if the number of entities to be displayed on a graph changes.
The processable code may further comprise selection code processable to select those entities from the plurality of entities having a
The expression "visualisation graph" is intended to cover visual representations, such as navigation graphs and other such tools.
Claims (14)
- A method of providing a visualisation graph on a computer comprising the steps of:storing data (24) corresponding to a plurality of entities (2), wherein a semantic net includes said entities (2) and wherein said entities (2) are linked to each other by a plurality of relations (8),in response to a query with respect to an entity selected (2) from said plurality of entities (2), providing a visualisation graph (1) representing the results of said query, andselecting those entities (2) from said plurality of entities (2) having at least one common relation (8) and storing said selected entities (2) as a plurality of groups.
- A method according to claim 1, comprising the further step of:representing said groups on said graph as a plurality of nodes (9), and representing only those relations (8) which all of said nodes (9) have in common.
- A method according to either claim 1 or claim 2, wherein said selecting step includes abstracting said relations (8) to identify said common relation (8).
- A method according to any of the preceding claims, comprising the further steps of:representing a plurality of entities (2) having a common relation (8) as a first node (9) on said visualisation graph (1), and in response to a predetermined stimulus causing said entities (2) comprised at said first node (9) to be displayed, and in response to a further predetermined stimulus causing said graph (1) to restructure so that said entities (2) displayed are replaced by said node (9).
- A method according to claim 4, wherein, in response to said first predetermined stimulus, said node (9) remains in said graph (1) to represent said common relation (8).
- A method according to either of claims 4 or 5, wherein said entities (2) are linked to a further entity (2) or node (9) via a link which represents a relation (8) which may not be common to all entities (2) linked to said first node (9).
- A method according to any of the preceding claims, wherein said method includes the further steps of: storing (24) data corresponding to a plurality of entities and/or nodes (2, 9), wherein a semantic net includes said entities and/or nodes (2; 9) and wherein said entities and/or nodes (2, 9) are linked to each other by a plurality of relations (8),
generating a query,
performing said query on said data, and outputting at least two of said plurality of data in the form of a visualisation graph (1) representing the results of said query, wherein said graph (1) has a focus entity or node (10) defined by a user or said query, and
using context information to determine at least one entity and/or node to be output in said results which is indirectly related to said focus (10). - A computer for providing a visualisation graph, said computer comprising:a storage medium (22) having recorded therein processor readable code processable to provide a visualisation graph (1),a database (24, 60) for storing data corresponding to a plurality of entities (2), wherein a semantic net includes said entities (2) andwherein said entities (2) are linked to each other by a plurality of relations (8),a query interface (40, 42) adapted, so that in response to a query with respect to an entity (2) selected from said plurality of entities (2), a visualisation graph (1) is provided representing the results of said query, wherein said code includes:selection code processable to select those entities from said plurality of entities having a common relation (8) and storing said selected entities (2) as a plurality of groups.
- A computer according to claim 8, wherein said code further includes representation code processable to represent said groups on said graph as a plurality of nodes (9), wherein only those relations (8) which all of said nodes (9) have in common are represented.
- A computer according to either claim 8 or claim 9, wherein said code further includes abstraction code processable to abstract said relations (8) to identify said common relation (8).
- A computer according to any of preceding claims 8-10, wherein said code further includes:representation code processable to represent a plurality of entities (2) having a common relation (8) as a node (9) on said visualisation graph (1), and in response to a predetermined stimulus causing said entities (2) comprised at said node (9) to be displayed, and in response to a further predetermined stimulus causing said graph (1) to restructure so that said entities (2) displayed are replaced by said node (9).
- A computer according to any of preceding claims 8-11, comprising:a database (24, 60) for storing data corresponding to a plurality of entities and/or nodes (2, 9), wherein a semantic net includes said entities and/or nodes (2, 9) and wherein said entities and/or nodes (2, 9) are linked to each other by a plurality of relations (8),a storage medium (22) having recorded therein processor readable code processable to provide a visualisation graph (1), said code including a query code processable to perform a query on said database (24, 60),an output device (30) for outputting at least two of said plurality of data in the form of a visualisation graph (1) representing the results of said query, wherein said graph (1) has a focus entity or node (10) defined by a user or said query, wherein said code further includes context code processable to express context information which is processable to determine at least one entity and/or node (2, 9) to be output in said results which is indirectly related to said focus (10).
- A user terminal comprising means operable to perform the method of any of claims 1-7.
- A program storage device readable by a processing apparatus, said device embodying a program of instructions executable by the processor to perform the steps of any one of claims 1-7.
Priority Applications (3)
| Application Number | Priority Date | Filing Date | Title |
|---|---|---|---|
| EP03078584A EP1510939A1 (en) | 2003-08-29 | 2003-11-14 | A method of providing a visualisation graph on a computer and a computer for providing a visualisation graph |
| JP2004246056A JP4651329B2 (en) | 2003-08-29 | 2004-08-26 | Method for providing visualization graph on display screen, computer providing the same, computer program thereof, and storage medium thereof |
| US10/927,315 US7549309B2 (en) | 2003-08-29 | 2004-08-27 | Method and system for restructuring a visualization graph so that entities linked to a common node are replaced by the common node in response to a predetermined stimulus |
Applications Claiming Priority (3)
| Application Number | Priority Date | Filing Date | Title |
|---|---|---|---|
| EP03077697 | 2003-08-29 | ||
| EP03077697A EP1510937A1 (en) | 2003-08-29 | 2003-08-29 | A method of providing a visualisation graph on a computer and a computer for providing a visualisation graph |
| EP03078584A EP1510939A1 (en) | 2003-08-29 | 2003-11-14 | A method of providing a visualisation graph on a computer and a computer for providing a visualisation graph |
Publications (1)
| Publication Number | Publication Date |
|---|---|
| EP1510939A1 true EP1510939A1 (en) | 2005-03-02 |
Family
ID=34105747
Family Applications (1)
| Application Number | Title | Priority Date | Filing Date |
|---|---|---|---|
| EP03078584A Ceased EP1510939A1 (en) | 2003-08-29 | 2003-11-14 | A method of providing a visualisation graph on a computer and a computer for providing a visualisation graph |
Country Status (3)
| Country | Link |
|---|---|
| US (1) | US7549309B2 (en) |
| EP (1) | EP1510939A1 (en) |
| JP (1) | JP4651329B2 (en) |
Families Citing this family (35)
| Publication number | Priority date | Publication date | Assignee | Title |
|---|---|---|---|---|
| EP1510938B1 (en) * | 2003-08-29 | 2014-06-18 | Sap Ag | A method of providing a visualisation graph on a computer and a computer for providing a visualisation graph |
| EP1510940A1 (en) * | 2003-08-29 | 2005-03-02 | Sap Ag | A method of providing a visualisation graph on a computer and a computer for providing a visualisation graph |
| US7849090B2 (en) * | 2005-03-30 | 2010-12-07 | Primal Fusion Inc. | System, method and computer program for faceted classification synthesis |
| JP2008176758A (en) * | 2006-12-20 | 2008-07-31 | Nec Corp | System, method, and program for displaying group relationship |
| US8226860B2 (en) * | 2007-03-29 | 2012-07-24 | Akron Polymer Systems | Optical compensation films having positive birefringence for liquid crystal display |
| US9087296B2 (en) | 2008-02-22 | 2015-07-21 | Adobe Systems Incorporated | Navigable semantic network that processes a specification to and uses a set of declaritive statements to produce a semantic network model |
| US8332782B1 (en) * | 2008-02-22 | 2012-12-11 | Adobe Systems Incorporated | Network visualization and navigation |
| US8914720B2 (en) * | 2009-07-31 | 2014-12-16 | Xerox Corporation | Method and system for constructing a document redundancy graph |
| US8458187B2 (en) * | 2009-11-30 | 2013-06-04 | Xerox Corporation | Methods and systems for visualizing topic location in a document redundancy graph |
| US8904272B2 (en) | 2010-05-05 | 2014-12-02 | Xerox Corporation | Method of multi-document aggregation and presentation |
| US10394778B2 (en) | 2010-09-03 | 2019-08-27 | Robert Lewis Jackson, JR. | Minimal representation of connecting walks |
| JP5651789B2 (en) | 2011-02-16 | 2015-01-14 | エンパイア テクノロジー ディベロップメント エルエルシー | Executing queries using semantically restricted relationships |
| US8688717B2 (en) * | 2012-02-16 | 2014-04-01 | Accenture Global Service Limited | Method and apparatus for generating and using an interest graph |
| US8959475B2 (en) * | 2012-03-21 | 2015-02-17 | International Business Machines Corporation | Generating a semantic graph that allows a user to intelligently and efficiently connect with people and assets involved in projects |
| CN102707944A (en) * | 2012-04-13 | 2012-10-03 | 华为技术有限公司 | User interface generation display method and user interface equipment |
| US10230603B2 (en) | 2012-05-21 | 2019-03-12 | Thousandeyes, Inc. | Cross-layer troubleshooting of application delivery |
| US10055541B2 (en) | 2012-10-12 | 2018-08-21 | Sap Se | Visualization and navigation of knowledge domains |
| FR3013862A1 (en) * | 2013-11-26 | 2015-05-29 | Orange | PROCESSING DATA RELATING TO ENTITIES |
| JP6274560B2 (en) * | 2014-01-09 | 2018-02-07 | 株式会社Nttぷらら | Content providing system, content providing server, content providing method, and program |
| WO2015162458A1 (en) * | 2014-04-24 | 2015-10-29 | Singapore Telecommunications Limited | Knowledge model for personalization and location services |
| US10657178B2 (en) * | 2014-08-22 | 2020-05-19 | Hewlett Packard Enterprise Development Lp | Processing of a generate entity type graph component of a graph analysis system |
| WO2016068955A1 (en) * | 2014-10-30 | 2016-05-06 | Hewlett Packard Enterprise Development Lp | Data entries having values for features |
| US10841852B2 (en) | 2015-12-09 | 2020-11-17 | DataSpark, PTE. LTD. | Transportation network monitoring using cellular radio metadata |
| US10176340B2 (en) | 2016-03-13 | 2019-01-08 | DataSpark, PTE. LTD. | Abstracted graphs from social relationship graph |
| US11157520B2 (en) | 2016-03-28 | 2021-10-26 | DataSpark, Pte Ltd. | Uniqueness level for anonymized datasets |
| US10659325B2 (en) | 2016-06-15 | 2020-05-19 | Thousandeyes, Inc. | Monitoring enterprise networks with endpoint agents |
| US10671520B1 (en) | 2016-06-15 | 2020-06-02 | Thousandeyes, Inc. | Scheduled tests for endpoint agents |
| WO2018150227A1 (en) | 2017-02-17 | 2018-08-23 | Dataspark Pte, Ltd | Mobility gene for trajectory data |
| US11418915B2 (en) | 2017-02-17 | 2022-08-16 | DataSpark, PTE. LTD. | Trajectory analysis with mode of transportation analysis |
| WO2018150228A1 (en) | 2017-02-17 | 2018-08-23 | Dataspark Pte, Ltd | Mobility gene for visit data |
| JP6439009B1 (en) * | 2017-06-05 | 2018-12-19 | Sky株式会社 | Correlation diagram display system and correlation diagram display program |
| US10529100B2 (en) * | 2018-04-10 | 2020-01-07 | Vmware, Inc. | Interaction-driven format for graph visualization |
| US10848402B1 (en) | 2018-10-24 | 2020-11-24 | Thousandeyes, Inc. | Application aware device monitoring correlation and visualization |
| US11032124B1 (en) | 2018-10-24 | 2021-06-08 | Thousandeyes Llc | Application aware device monitoring |
| US10567249B1 (en) * | 2019-03-18 | 2020-02-18 | Thousandeyes, Inc. | Network path visualization using node grouping and pagination |
Citations (1)
| Publication number | Priority date | Publication date | Assignee | Title |
|---|---|---|---|---|
| US6154220A (en) | 1998-10-19 | 2000-11-28 | Microsoft Corporation | Rectilinear layout |
Family Cites Families (47)
| Publication number | Priority date | Publication date | Assignee | Title |
|---|---|---|---|---|
| US5619632A (en) * | 1994-09-14 | 1997-04-08 | Xerox Corporation | Displaying node-link structure with region of greater spacings and peripheral branches |
| US5590250A (en) * | 1994-09-14 | 1996-12-31 | Xerox Corporation | Layout of node-link structures in space with negative curvature |
| US5740440A (en) | 1995-01-06 | 1998-04-14 | Objective Software Technology | Dynamic object visualization and browsing system |
| JP3525634B2 (en) * | 1996-07-25 | 2004-05-10 | 日本電信電話株式会社 | Graphic information aggregation controller |
| US6144962A (en) | 1996-10-15 | 2000-11-07 | Mercury Interactive Corporation | Visualization of web sites and hierarchical data structures |
| US6154213A (en) | 1997-05-30 | 2000-11-28 | Rennison; Earl F. | Immersive movement-based interaction with large complex information structures |
| US6266805B1 (en) | 1997-07-25 | 2001-07-24 | British Telecommunications Plc | Visualization in a modular software system |
| US6369819B1 (en) | 1998-04-17 | 2002-04-09 | Xerox Corporation | Methods for visualizing transformations among related series of graphs |
| US6216134B1 (en) | 1998-06-25 | 2001-04-10 | Microsoft Corporation | Method and system for visualization of clusters and classifications |
| US6654761B2 (en) | 1998-07-29 | 2003-11-25 | Inxight Software, Inc. | Controlling which part of data defining a node-link structure is in memory |
| US6480843B2 (en) | 1998-11-03 | 2002-11-12 | Nec Usa, Inc. | Supporting web-query expansion efficiently using multi-granularity indexing and query processing |
| US6434556B1 (en) * | 1999-04-16 | 2002-08-13 | Board Of Trustees Of The University Of Illinois | Visualization of Internet search information |
| EP1050829A3 (en) * | 1999-04-22 | 2005-05-18 | International Business Machines Corporation | Visualization of graph-structured name spaces |
| US6714936B1 (en) | 1999-05-25 | 2004-03-30 | Nevin, Iii Rocky Harry W. | Method and apparatus for displaying data stored in linked nodes |
| US6583794B1 (en) | 1999-07-01 | 2003-06-24 | Smart Money | Interface system for information mapping |
| DE60001915T2 (en) | 1999-07-02 | 2004-02-05 | Pri Automation, Inc., Billerica | DYNAMIC TRANSPORT ALGORITHM |
| US6556983B1 (en) * | 2000-01-12 | 2003-04-29 | Microsoft Corporation | Methods and apparatus for finding semantic information, such as usage logs, similar to a query using a pattern lattice data space |
| US6868525B1 (en) | 2000-02-01 | 2005-03-15 | Alberti Anemometer Llc | Computer graphic display visualization system and method |
| US6446083B1 (en) | 2000-05-12 | 2002-09-03 | Vastvideo, Inc. | System and method for classifying media items |
| US20020087275A1 (en) * | 2000-07-31 | 2002-07-04 | Junhyong Kim | Visualization and manipulation of biomolecular relationships using graph operators |
| US6795825B2 (en) | 2000-09-12 | 2004-09-21 | Naphtali David Rishe | Database querying system and method |
| US6981228B1 (en) | 2000-09-29 | 2005-12-27 | Sbc Technology Resources, Inc. | Interactive topology graphs for visualization and characterization of SONET consumption patterns |
| US6792400B2 (en) | 2000-12-18 | 2004-09-14 | General Motors Corporation | Visualization of complex system interactions |
| US6944830B2 (en) | 2000-12-21 | 2005-09-13 | Xerox Corporation | System and method for browsing hierarchically based node-link structures based on an estimated degree of interest |
| US6646652B2 (en) | 2000-12-21 | 2003-11-11 | Xerox Corporation | System and method for browsing node-link structures based on an estimated degree of interest |
| US6781599B2 (en) * | 2001-01-04 | 2004-08-24 | At&T | System and method for visualizing massive multi-digraphs |
| US20020133392A1 (en) * | 2001-02-22 | 2002-09-19 | Angel Mark A. | Distributed customer relationship management systems and methods |
| WO2002069192A1 (en) | 2001-02-26 | 2002-09-06 | Compudigm International Limited | Data visualisation system and method |
| US7043702B2 (en) | 2001-03-15 | 2006-05-09 | Xerox Corporation | Method for visualizing user path through a web site and a path's associated information scent |
| US20020158918A1 (en) | 2001-03-28 | 2002-10-31 | Sarnoff Corporation | Method and apparatus for visualizing correlations among and between objects and events |
| US20040030741A1 (en) * | 2001-04-02 | 2004-02-12 | Wolton Richard Ernest | Method and apparatus for search, visual navigation, analysis and retrieval of information from networks with remote notification and content delivery |
| JP3790679B2 (en) | 2001-04-06 | 2006-06-28 | インターナショナル・ビジネス・マシーンズ・コーポレーション | Graph data visualization device, graphics creation method, program, and storage medium |
| JP3747404B2 (en) | 2001-06-19 | 2006-02-22 | インターナショナル・ビジネス・マシーンズ・コーポレーション | Graphics image creating apparatus, method and program thereof |
| KR100436356B1 (en) | 2001-08-01 | 2004-06-18 | (주) 위즈도메인 | A method for analyzing and providing inter-citation relationship between patents related to a subject patent |
| US6888548B1 (en) | 2001-08-31 | 2005-05-03 | Attenex Corporation | System and method for generating a visualized data representation preserving independent variable geometric relationships |
| US6996774B2 (en) | 2002-02-12 | 2006-02-07 | Accenture Global Services Gmbh | Display of data element indicia based on data types |
| US7167910B2 (en) | 2002-02-20 | 2007-01-23 | Microsoft Corporation | Social mapping of contacts from computer communication information |
| US20030220928A1 (en) * | 2002-05-21 | 2003-11-27 | Patrick Durand | Method for organizing and querying a genomic and proteomic databases |
| JP2004069417A (en) | 2002-08-05 | 2004-03-04 | Hitachi Ltd | Method for deciding node coordinates, method for displaying via network and method for screening |
| KR100470977B1 (en) * | 2002-09-23 | 2005-03-10 | 학교법인 인하학원 | A fast algorithm for visualizing large-scale protein-protein interactions |
| US7111253B2 (en) | 2002-12-16 | 2006-09-19 | Palo Alto Research Center Incorporated | Method and apparatus for displaying hierarchical information |
| US7089266B2 (en) | 2003-06-02 | 2006-08-08 | The Board Of Trustees Of The Leland Stanford Jr. University | Computer systems and methods for the query and visualization of multidimensional databases |
| US7167865B1 (en) | 2003-06-30 | 2007-01-23 | Mvalent, Inc. | Collaborative environment for producing software products |
| EP2487601A1 (en) * | 2004-05-04 | 2012-08-15 | Boston Consulting Group, Inc. | Method and apparatus for selecting, analyzing and visualizing related database records as a network |
| US7877737B2 (en) | 2004-07-23 | 2011-01-25 | University Of Maryland | Tree-to-graph folding procedure for systems engineering requirements |
| US7456840B2 (en) | 2004-08-31 | 2008-11-25 | Oracle International Corporation | Displaying information using nodes in a graph |
| WO2007062885A1 (en) | 2005-11-29 | 2007-06-07 | International Business Machines Corporation | Method and system for extracting and visualizing graph-structured relations from unstructured text |
-
2003
- 2003-11-14 EP EP03078584A patent/EP1510939A1/en not_active Ceased
-
2004
- 2004-08-26 JP JP2004246056A patent/JP4651329B2/en active Active
- 2004-08-27 US US10/927,315 patent/US7549309B2/en active Active
Patent Citations (1)
| Publication number | Priority date | Publication date | Assignee | Title |
|---|---|---|---|---|
| US6154220A (en) | 1998-10-19 | 2000-11-28 | Microsoft Corporation | Rectilinear layout |
Non-Patent Citations (19)
| Title |
|---|
| "CHAPTER 15: Topic Maps in Knowledge Organization", 16 July 2002, XML TOPIC MAPS: CREATING AND USING TOPIC MAPS FOR THE WEB, ADDISON WESLEY PROFESSIONAL, XP007906697 * |
| BOUTIN F ET AL: "Focus-based clustering for multi-scale visualization", PROCEEDINGS SEVENTH INTERNATIONAL CONFERENCE ON INFORMATION VISUALIZATION, 16 July 2003 (2003-07-16), LONDON, UK, pages 53 - 58, XP010648478 * |
| BROCKENAUER R, CORNELSEN S: "Drawing Clusters and Hierarchies", LECTURE NOTES IN COMPUTER SCIENCE, vol. 2025 / 2001, June 2003 (2003-06-01), HEIDELBERG, GERMANY, pages 193 - 227, XP002283485 * |
| COURTINE M, BOURNAUD I, ZUCKER J D: "KIDS: an iterative algorithm to organize relational knowledge", PROCEEDINGS OF EKAW'2000 LNAI 1937, October 2000 (2000-10-01), GERMANY, pages 217 - 232, XP002283484 * |
| COURTINE M. ET AL.: "KIDS: an iterative algorithm to organize relational knowledge", PROCEEDINGS OF EKAW", 2000 LNAI 1937, October 2000 (2000-10-01), pages 217 - 232 |
| FLUIT C. ET AL.: "Ontology-based Information Visualisation", 5TH INTERNATIONAL CONFERENCE ON INFORMATION VISUALISATION, 25 July 2001 (2001-07-25), pages 546 - 559, XP002281069 |
| FLUIT C.; SABOU M.; VAN HARMELEN F.: "Ontology-based Information Visualisation", PROCEEDINGS OF THE INTERNATIONAL CONFERENCE ON INFORMATION VISUALISATION, 25 July 2001 (2001-07-25), XP002281069 * |
| GOLOVCHINSKY G.; KAMPS T.; REICHENBERGER K.: "Subverting structure: data-driven diagram generation", VISUALIZATION, 1995. VISUALIZATION '95. PROCEEDINGS., IEEE CONFERENCE ON ATLANTA, GA, USA, 29 October 1995 (1995-10-29), XP010151200 * |
| HERMAN I, MELANÇON G, SCOTT MARSHALL M: "Graph visualization and Navigation in Information Visualization: a Survey", IEEE TRANSACTIONS ON VISUALIZATION AND COMPUTER GRAPHICS, vol. 6, no. 1, 2000, pages 24 - 43, XP002281070 * |
| HULL R.; KING R.: "Semantic database modeling: survey, applications and research issues", ACM COMPUTING SURVEYS, ACM, NEW YORK, NY, US, US, 1 September 1987 (1987-09-01), pages 201 - 260, XP002962747 * |
| MUKHERJEA S ET AL: "VISUALIZING COMPLEX HYPERMEDIA NETWORKS THROUGH MULTIPLE HIERARCHICAL VIEWS", HUMAN FACTORS IN COMPUTING SYSTEMS. CHI '95 CONFERENCE PROCEEDINGS. DENVER, MAY 7 - 11, 1995; [CONFERENCE ON HUMAN FACTORS IN COMPUTING SYSTEMS], NEW YORK, ACM, US, 7 May 1995 (1995-05-07), pages 331 - 337, XP000538463, ISBN: 978-0-201-84705-5 * |
| MUKHERJEA S ET AL: "Visualizing the World-Wide Web with the Navigational View Builder", COMPUTER NETWORKS AND ISDN SYSTEMS, NORTH HOLLAND PUBLISHING. AMSTERDAM, NL, vol. 27, no. 6, 1 April 1995 (1995-04-01), pages 1075 - 1087, XP004013209, ISSN: 0169-7552, DOI: 10.1016/0169-7552(95)00023-Z * |
| MUKHERJEA S, FOLEY J D, HUDSON S E: "Interactive clustering for navigating in hypermedia systems", PROCEEDINGS OF THE 1994 ACM EUROPEAN CONFERENCE ON HYPERMEDIA TECHNOLOGY, September 1994 (1994-09-01), EDINBURGH, SCOTLAND, pages 136 - 145, XP002283483 * |
| MUKHERJEA S. ET AL.: "Interactive clustering for navigating in hypermedia systems", PROCEEDINGS OF THE 1994 ACM EUROPEAN CONFERENCE ON HYPERMEDIA TECHNOLOGY, EDINBURGH, SCOTLAND, September 1994 (1994-09-01), pages 136 - 145, XP002283483, DOI: doi:10.1145/192757.192787 |
| MUTTON P.; GOLBECK J.: "Visualization of semantic metadata and ontologies", INFORMATION VISUALIZATION, 2003. INFOVIS 2003. IEEE SYMPOSIUM ON 16-18 JULY 2003, XP010648515 * |
| SCOTT MARSHALL: "Methods and Tools for the Visualization and Navigation of Graphs", PHD THESIS UNIVERSITE BORDEAUX, XX, XX, 1 January 2001 (2001-01-01), pages complete, XP002284043 * |
| SOUGATA MUKHERJEA ET AL: "Requirements and architecture of an information visualization tool", 28 October 1995, DATABASE ISSUES FOR DATA VISUALIZATION, SPRINGER BERLIN HEIDELBERG, BERLIN, HEIDELBERG, PAGE(S) 57 - 75, ISBN: 978-3-540-62221-5, XP019197115 * |
| STASZAK C.: "Semantic Network Picture Book", pages: 1 - 14 |
| STASZAK, C: "Semantic Network Picture Book", HTTP://WWW.SEMANTICRESEARCH.COM/DOWNLOADS/WHITEPAPERS/INDEX.PHP, 2002, pages 1 - 14, XP002283482, Retrieved from the Internet <URL:http://www.semanticresearch.com/downloads/whitepapers/picture_book.pdf> [retrieved on 20040528] * |
Also Published As
| Publication number | Publication date |
|---|---|
| JP2005100376A (en) | 2005-04-14 |
| US20050114383A1 (en) | 2005-05-26 |
| JP4651329B2 (en) | 2011-03-16 |
| US7549309B2 (en) | 2009-06-23 |
Similar Documents
| Publication | Publication Date | Title |
|---|---|---|
| US7720857B2 (en) | Method and system for providing an invisible attractor in a predetermined sector, which attracts a subset of entities depending on an entity type | |
| US7853552B2 (en) | Method and system for increasing a repulsive force between a first node and surrounding nodes in proportion to a number of entities and adding nodes to a visualization graph | |
| EP1510939A1 (en) | A method of providing a visualisation graph on a computer and a computer for providing a visualisation graph | |
| EP1510941A1 (en) | A method of providing a visualisation graph on a computer and a computer for providing a visualisation graph | |
| JP3747404B2 (en) | Graphics image creating apparatus, method and program thereof | |
| US6154220A (en) | Rectilinear layout | |
| US20160205137A1 (en) | Visualization and analysis of complex security information | |
| WO2011142720A1 (en) | A self-organizing and contextual graphical user interface | |
| CN109471900A (en) | Chart class data self action data exchange method and system, computer program | |
| JP2016167303A (en) | Attraction-based data visualization | |
| JPWO2011001584A1 (en) | Information classification apparatus, information classification method, and information classification program | |
| EP1510937A1 (en) | A method of providing a visualisation graph on a computer and a computer for providing a visualisation graph | |
| Zhang et al. | ZoomRDF: semantic fisheye zooming on RDF data | |
| Demian et al. | Finding and understanding reusable designs from large hierarchical repositories | |
| JP2006107358A (en) | Webpage browsing device and webpage browsing program | |
| Loubier et al. | Temporal and relational data representation by graph morphing | |
| Moere et al. | Visualizing abstract information using motion properties of data-driven infoticles | |
| Held et al. | Cluster-based Visualization of Dynamic Graphs | |
| Somasundaram | OntoSELF: A 3D ontology visualization tool | |
| Sjöblom et al. | An Exploration of how Representational Tools can Support Creativity and Relational Reasoning | |
| Herman et al. | Graph visualisation and navigation in information visualisation. | |
| Regan | Constructing memorable asymmetric information diagrams in three dimensions | |
| Pavlo | Interactive, tree-based graph visualization | |
| Bichler | Visualization framework for information graphs: an incremental approach | |
| Taghavi et al. | System-level MP-SoC design space exploration using tree visualization |
Legal Events
| Date | Code | Title | Description |
|---|---|---|---|
| PUAI | Public reference made under article 153(3) epc to a published international application that has entered the european phase |
Free format text: ORIGINAL CODE: 0009012 |
|
| AK | Designated contracting states |
Kind code of ref document: A1 Designated state(s): AT BE BG CH CY CZ DE DK EE ES FI FR GB GR HU IE IT LI LU MC NL PT RO SE SI SK TR |
|
| AX | Request for extension of the european patent |
Extension state: AL LT LV MK |
|
| 17P | Request for examination filed |
Effective date: 20050623 |
|
| AKX | Designation fees paid |
Designated state(s): AT BE BG CH CY CZ DE DK EE ES FI FR GB GR HU IE IT LI LU MC NL PT RO SE SI SK TR |
|
| RAP1 | Party data changed (applicant data changed or rights of an application transferred) |
Owner name: SAP AG |
|
| 17Q | First examination report despatched |
Effective date: 20070117 |
|
| STAA | Information on the status of an ep patent application or granted ep patent |
Free format text: STATUS: THE APPLICATION HAS BEEN REFUSED |
|
| 18R | Application refused |
Effective date: 20130526 |