EP2103253A1 - Device, method and computer-readable storage medium for SVT and VT Classification - Google Patents
Device, method and computer-readable storage medium for SVT and VT Classification Download PDFInfo
- Publication number
- EP2103253A1 EP2103253A1 EP08164155A EP08164155A EP2103253A1 EP 2103253 A1 EP2103253 A1 EP 2103253A1 EP 08164155 A EP08164155 A EP 08164155A EP 08164155 A EP08164155 A EP 08164155A EP 2103253 A1 EP2103253 A1 EP 2103253A1
- Authority
- EP
- European Patent Office
- Prior art keywords
- signal
- template
- ventricular
- values
- test signal
- Prior art date
- Legal status (The legal status is an assumption and is not a legal conclusion. Google has not performed a legal analysis and makes no representation as to the accuracy of the status listed.)
- Granted
Links
- 0 CC*(C)CNC*C Chemical compound CC*(C)CNC*C 0.000 description 1
Images


Classifications
-
- A—HUMAN NECESSITIES
- A61—MEDICAL OR VETERINARY SCIENCE; HYGIENE
- A61B—DIAGNOSIS; SURGERY; IDENTIFICATION
- A61B5/00—Measuring for diagnostic purposes; Identification of persons
- A61B5/24—Detecting, measuring or recording bioelectric or biomagnetic signals of the body or parts thereof
- A61B5/316—Modalities, i.e. specific diagnostic methods
- A61B5/318—Heart-related electrical modalities, e.g. electrocardiography [ECG]
- A61B5/346—Analysis of electrocardiograms
- A61B5/349—Detecting specific parameters of the electrocardiograph cycle
- A61B5/35—Detecting specific parameters of the electrocardiograph cycle by template matching
-
- A—HUMAN NECESSITIES
- A61—MEDICAL OR VETERINARY SCIENCE; HYGIENE
- A61B—DIAGNOSIS; SURGERY; IDENTIFICATION
- A61B5/00—Measuring for diagnostic purposes; Identification of persons
- A61B5/24—Detecting, measuring or recording bioelectric or biomagnetic signals of the body or parts thereof
- A61B5/316—Modalities, i.e. specific diagnostic methods
- A61B5/318—Heart-related electrical modalities, e.g. electrocardiography [ECG]
- A61B5/346—Analysis of electrocardiograms
- A61B5/349—Detecting specific parameters of the electrocardiograph cycle
- A61B5/363—Detecting tachycardia or bradycardia
-
- A—HUMAN NECESSITIES
- A61—MEDICAL OR VETERINARY SCIENCE; HYGIENE
- A61B—DIAGNOSIS; SURGERY; IDENTIFICATION
- A61B5/00—Measuring for diagnostic purposes; Identification of persons
- A61B5/72—Signal processing specially adapted for physiological signals or for diagnostic purposes
- A61B5/7235—Details of waveform analysis
- A61B5/7264—Classification of physiological signals or data, e.g. using neural networks, statistical classifiers, expert systems or fuzzy systems
-
- G—PHYSICS
- G16—INFORMATION AND COMMUNICATION TECHNOLOGY [ICT] SPECIALLY ADAPTED FOR SPECIFIC APPLICATION FIELDS
- G16H—HEALTHCARE INFORMATICS, i.e. INFORMATION AND COMMUNICATION TECHNOLOGY [ICT] SPECIALLY ADAPTED FOR THE HANDLING OR PROCESSING OF MEDICAL OR HEALTHCARE DATA
- G16H50/00—ICT specially adapted for medical diagnosis, medical simulation or medical data mining; ICT specially adapted for detecting, monitoring or modelling epidemics or pandemics
- G16H50/20—ICT specially adapted for medical diagnosis, medical simulation or medical data mining; ICT specially adapted for detecting, monitoring or modelling epidemics or pandemics for computer-aided diagnosis, e.g. based on medical expert systems
Definitions
- the present invention generally relates to implantable cardiac devices, including pacemakers, defibrillators and cardioverters, which stimulate cardiac tissue electrically to control the patient's heart rhythm. More particularly, the present invention relates to a method and apparatus for classifying of supraventricular tachyarrhythmia (SVT) from ventricular tachyarrhythmia (VT) based on morphological analysis of the intracardiac electrogram (IEGM) recorded by the implantable cardiac devices.
- SVT supraventricular tachyarrhythmia
- IEGM intracardiac electrogram
- Implantable cardioverter-defibrillator is a demonstrated therapy for treating life-threatening VT, including ventricular tachycardia and ventricular fibrillation.
- Successful ICD therapy relies on fast and accurate detection of VT.
- one of the major limitations of the current ICD devices is the relatively low specificity for VT detection. False VT detection frequently occurs in the case of SVT, particular in the case of 1:1 AV association. Consequently, this low specificity often results in inappropriate ICD shocks delivered for SVT, causing patient's discomfort, negatively affecting their quality of life, and reducing device longevity because of unnecessary current drain.
- the VT detection algorithm in the ICDs is based on cardiac inter-beat or RR interval analysis. Different VT zones are programmed based on predefined thresholds of RR intervals or ventricular rates. Because SVT frequently results in short RR intervals or high ventricular rates that also fall in the VT zone, enhancement of the VT detection algorithm was made by including additional criteria such as sudden onset and stability.
- the discrimination of SVT from VT can be substantially enhanced by the addition of atrial sensing capability.
- Many types of SVT rhythms such as atrial flutter and atrial fibrillation, can be easily distinguished from the VT by the evidence of AV dissociation.
- the challenge to discriminate SVT from VT in the presence of 1:1 AV relationship such as during sinus tachycardia or AV nodal reentrant tachycardia, still remains.
- Morphological analysis has also been used to facilitate the SVT-VT classification.
- a template IEGM of conducted baseline rhythm is recorded and maintained.
- the rhythm is classified as SVT if the IEGM morphology is similar to the template waveform, whereas it is classified as VT if the IEGM morphology is distinctly different from the template waveform. All morphology-based SVT-VT classification algorithms require proper alignment of the template waveform and the test IEGM.
- One morphology analysis method is based on correlation analysis.
- CC correlation coefficient
- FCC feature correlation coefficient
- the computation load is still high due to the floating-point operation.
- the waveform morphology is unlikely to be fully characterized by the limited 8 samples, thus FCC may not accurately quantify the similarity between two waveforms.
- the FCC is less sensitive to the amplitude discrepancy between the signals.
- the FCC between two signals X and Y ⁇ X , where ⁇ is a constant scaling factor, is always 1, despite the fact that the amplitude of Y can be significantly different than that of X .
- the FCC between two signals is affected by each sample amplitude of each signal, thus is sensitive to additive noise such as impulse noise and continuous random noise.
- Another morphology analysis method is based on metrics that are derived from the signals.
- the metric used in this algorithm is the peak area of the IEGM waveform, while other metrics (weight, height, zero-crossing, etc.) may also be used.
- the algorithm measures the difference between the corresponding (normalized) peak areas of the test and template IEGM waveforms. Then a morphology score is generated based on the peak area difference to indicate the similarity between test and template IEGM signals.
- the metric (peak area) derived from the signal is affected by many factors, such that waveforms of different morphologies can have the same metric value.
- the waveform morphology is unlikely to be fully characterized by a single or multiple metrics, thus the derived morphology score may not accurately quantify the similarity between two waveforms.
- such an algorithm is known to be very sensitive to the waveform alignment errors.
- Wavelets have also been used to facilitate discrimination between SVT and VT.
- the modified Haar wavelets were used to decompose the IEGM signal into wavelet coefficients.
- their respective wavelet coefficients are compared. If the match percentage between their wavelet coefficients is greater than a threshold (e.g., 70%), then the test IEGM is considered similar to the template waveform, indicating a conducted beat. Otherwise, the test IEGM is thought to have different morphology than the template waveform, suggesting ventricular origin of the beat.
- a threshold e.g. 70%
- the device comprises means for providing a template signal and a test signal originated from an electrogram. The template signal and the test signal comprising samples.
- the device comprises further means for transforming at least the test signal resulting in a representation of the test signal where the sample values of the signal take integers.
- the device comprises further means for determining a correlation between the template signal and the test signal, and means for classifying of SVT from ventricular VT based on the correlation.
- the electrogram may be an intracardiac electrogram (IEGM), a surface electrocardiogram (ECG) or a subcutaneous electrogram.
- IEGM intracardiac electrogram
- ECG surface electrocardiogram
- subcutaneous electrogram IEGM
- the invention provides a device which further comprises means for averaging a plurality of cycles of signals to obtain the template signal. Especially cycles of conducted ventricular IEGM signals may be used.
- the invention provides a device which further comprises means for updating the template periodically or continuously after an initial template setup.
- the invention provides a device which further comprises means for aligning the signals based on at least one predefined fiducial point.
- a further object of the invention is providing a device which further comprises means for associating the template signal with at least two subspaces of the template signal space and means for transforming at least one of the template signal and the test signal with respect to the subspaces.
- the means for associating the template signal with at least two subspaces comprises means for defining a first subspace comprising values which differ from the template signal values at the most by a predefined first value, and means for defining a second subspace comprising values which differ from the template signal values at the least by the predefined first value.
- the means for associating the template signal with at least two subspaces comprises means for associating the template signal with three subspaces, and means for defining a first subspace comprising values which differ from the template signal values at the most by a predefined first value, means for defining a second subspace comprising values which differ from the template signal values at the least by the predefined first value and at the most by a predefined second value, and means for defining a third subspace comprising values which differ from the template signal values at the least by the predefined second value.
- the device further comprising means for generating threshold vectors bounding the subspaces, where the threshold vectors are generated by increasing or decreasing the sample values of the template signal by a predefined value.
- the means for transforming comprises means for setting a sample value of the transformed signal to a first, second or third integer if the corresponding sample value of the signal belongs to the first, second or third subspace.
- the first integer is set to 1
- the second integer is set to 0
- the third integer is set to -1.
- the device comprises means for determining a correlation using at least the transformed test signal.
- the device comprises means for determining a correlation using only the transformed test signal.
- the means for determining a correlation comprises means for determining an Adapted Signed Correlation Index (ASCI) as the sum of the sample values of the transformed test signal or by dividing the sum of the sample values of the transformed test signal by the number of samples.
- ASCI Adapted Signed Correlation Index
- the means for classifying comprises means for classifying a ventricular IEGM as being of ventricular origin if the correlation is below a predefined threshold, or as being of supraventricular origin otherwise.
- the means for classifying comprises means for performing SVT-VT classification by a combination of determining the correlation between the template signal and the test signal and RR interval analysis.
- the means for classifying further comprises means for incrementing a VT sample counter by 1 for a ventricular cycle that falls in the VT/VF zone if and only if the correlation value between the ventricular cycle and the template signal is below a predefined threshold.
- the means for classifying comprises means for performing SVT-VT classification by a combination of determining the correlation between the template signal and the test signal and SVT-VT classification algorithm that involves both atrial and ventricular rate and rhythm analysis.
- the template signal is an atrial IEGM waveform and the means for classifying comprises means for determining the correlation between an atrial test IEGM signal with the atrial IEGM waveform in case a SVT or VT with 1:1 relationship is detected for distinguishing an intrinsic atrial event from a retrograde conducted atrial event.
- the signals are provided by an intracardiac electrogram (IEGM), a surface electrocardiogram (ECG) or a subcutaneous electrogram.
- IEGM intracardiac electrogram
- ECG surface electrocardiogram
- subcutaneous electrogram IEGM
- IEGM intracardiac electrogram
- ECG surface electrocardiogram
- the template signal is obtained by averaging a plurality of cycles of signals, where cycles of conducted ventricular IEGM signals may be used.
- the template is updated periodically or continuously.
- the signals are aligned based on at least one predefined fiducial point.
- the method for classifying of SVT from VT comprises the further steps of:
- the subspaces are bounded by threshold vectors.
- the threshold vectors are obtained by increasing or decreasing the sample values of the template signal by a predefined value.
- transforming the signals comprises assigning a first, second or third integer to a sample of the transformed signal if the corresponding sample of the signal belongs to the first, second or third subspace.
- the first integer may be set to 1
- the second integer may be set to 0
- the third integer may be set to -1.
- determination of the correlation is performed using the transformed test signals.
- determination of the correlation is performed using only the transformed test signal.
- a ASCI Adapted Signed Correlation Index
- Adapted Signed Correlation Index is determined as the sum of the sample values of the transformed test signal or by dividing the sum of the sample values of the transformed test signal by the number of samples.
- a ventricular IEGM is classified as being of ventricular origin if the correlation is below a predefined threshold, or as being of supraventricular origin otherwise.
- SVT-VT classification is performed by a combination of determining the correlation between the template signal and the test signal and RR interval analysis.
- a VT sample counter is increment by 1 if and only if the correlation value between the test and the template signal is below a predefined threshold.
- SVT-VT classification is performed by a combination of determining the correlation between the template signal and the test signal and SVT-VT classification algorithm that involves both atrial and ventricular rate and rhythm analysis.
- the template signal is an atrial IEGM waveform and determining the correlation between an atrial test IEGM signal with the atrial IEGM waveform in case a SVT or VT with 1:1 relationship is detected for distinguishing an intrinsic atrial event from a retrograde conducted atrial event.
- the ASCI is used to quantify the morphological similarity between an IEGM signal and a template waveform. All valid sample pairs are included in the calculation of ASCI, thus complete waveform morphology information of the two signals is retained (i.e., no loss of morphological information due to feature extraction).
- the calculation of ASCI is computationally efficient because no floating-point operation is necessary. Furthermore, calculation of ASCI is robust against measurement noise and minor alignment error of the signals.
- the template waveform is created by averaging multiple cycles of conducted ventricular IEGM, which is aligned with predefined fiducial point.
- the template waveform is created at high atrial rate (sinus rhythm or atrial pacing) but below the VT detection rate.
- the template waveform is also preferably updated periodically or dynamically to reflect the gradual change of the conducted IEGM morphology.
- the ASCI-based morphological analysis is activated to enhance the existing SVT-VT classification algorithm.
- the ASCI between this cycle's IEGM and the template waveform is calculated. If the ASCI is greater than a predefined threshold, it indicates the test IEGM has similar morphology as the template waveform, suggesting this is a conducted beat. Otherwise, it indicates the test IEGM has different morphology than the template waveform, suggesting the ventricular origin of the beat.
- IEGM signals are used to illustrate the concept of ASCI-based morphology analysis for SVT and VT classification, it should be understood that the same method could be applied to SVT and VT classification based on surface ECG or subcutaneous electrogram signals.
- the template waveform is constructed from the electrogram signal that corresponds to antegrade conducted ventricular beat.
- the template waveform can be constructed from the ventricular IEGM corresponding to ventricular sense (VS) event that is associated with preceding atrial sense (AS) or atrial pace (AP) event.
- VS ventricular sense
- AS atrial sense
- AP atrial pace
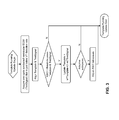
- Figure 1 shows a high-level flowchart diagram that illustrates the steps involved in automatic setup of the conducted ventricular IEGM template in an ICD.
- the template waveform is created at an atrial rate that is higher than a predefined 'template rate', but below the programmed VT detection rate.
- the 'template rate' is defined as 20ppm below the programmed VT detection rate.
- the high atrial rate can be achieved at elevated sinus rhythm, for example, during stress test, or by means of high rate atrial pacing. It is also required that 1:1 AV conduction is maintained during the template setup phase.
- the ICD collects multiple cycles of the conducted ventricular IEGM signal, which are then aligned based on predefined fiducial point, for example, the positive or negative peak, the maximum slope, the threshold crossing point, etc., as known in the art.
- the IEGM segment in a fixed window relative to the fiducial point is selected for creating the template signal.
- the fiducial point is chosen as the dominant peak (positive or negative) of the ventricular IEGM, and the IEGM window spans from 50 ms before the fiducial point to 100 ms after the fiducial point.
- ASCI Adaptive Signed Correlation Index
- the calculated ASCI is greater than the predefined threshold value (e.g., 0.8)
- the predefined threshold value e.g. 0.
- the ASCI is calculated based on the definition of three subspaces which are dependent on the template signal.
- the ICD further determines the three subspaces as discussed thereinafter. Note that during the initial template setup phase when template waveform has not been available yet, to calculate the ASCI between a pair of IEGM cycles, any one of the two IEGM signals can be initialized as the tentative template signal. Based on this tentative template signal, the three subspaces can be defined, and the similarity between these two signals can be quantified by ASCI. As discussed above, only when all pairs of the collected IEGM cycles result in higher than predefined threshold ASCI values, then these cycles are considered to have similar morphology, and the true template waveform can be created.
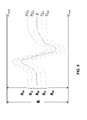
- FIG. 2 shows a particular example of template setup for conducted ventricular IEGM signals.
- the surface ECG, the atrial IEGM, and the ventricular IEGM are shown (left) for four cardiac cycles in sinus rhythm. Each intrinsic atrial depolarization is followed by a conducted ventricular depolarization.
- the ventricular IEGM morphology is consistent among the four cycles.
- the positive peak of the ventricular IEGM is chosen as the fiducial point, and the window size is set from 50 ms before the positive peak to 100 ms after the positive peak. Then the four cycles of ventricular IEGM are averaged to create the conducted ventricular IEGM template waveform (right).
- the conducted ventricular IEGM template is preferably updated periodically or continuously to reflect the dynamic change of the conducted IEGM morphology.
- This template running update feature is important because the conducted ventricular IEGM waveform may gradually change over time due to different factors such as heart rate variation, circadian pattern, changes of medication, changes of electrode-tissue interface, etc.
- Figure 3 shows a high-level flowchart that illustrates the steps involved in running update of the conducted ventricular IEGM template.
- the template running update is activated if and only if the atrial rate (sensed or paced) is higher than the predefined 'template rate' but below the programmed VT detection rate.
- the ICD acquires one cycle of conducted ventricular IEGM (i.e., preceded by an AS or AP event) as the test signal, which is aligned with the template signal based on predefined fiducial point as discussed above. Then the ICD calculates the ASCI between the template signal and the acquired test signal.
- the test signal is considered different than the template signal, and no template update is performed for this test cycle.
- the predefined threshold e.g. 0.
- the test signal is considered similar to the template signal, and the template signal is updated by taking the weighted average of the original template signal and the newly acquired test signal.
- the new template is the sum of the old template signal scaled by 255/256, and the newly acquired test signal scaled by 1/256.
- the ICD can further adjust the three subspaces based on newly updated template signal, if the adaptive subspace feature is enabled.
- test signal must be properly aligned with the template signal. Morphological analysis based on misaligned signals may yield misleading results.
- the common practice for signal alignment is based on a predefined fiducial point, such as the positive peak, the negative peak, etc. However, in some cases, the signal alignment based on a single fiducial point is not reliable.
- FIG. 4 shows some examples.
- Panels (a) and (b) show two signal complexes that have similar morphology. Both signal complexes can be characterized by two positive peaks (P1, P2) that have similar amplitude and one negative peak (N1). If the dominant positive peak is chosen as the fiducial point, then the fiducial point will be P1 for the signal complex shown in panel (a) but P2 for the signal complex shown in panel (b).
- panels (c) and (d) show another pair of signal complexes that have similar morphology. Both signal complexes can be characterized by two negative peaks (N1, N2) that have similar amplitude and one positive peak (P1). If the dominant negative peak is chosen as the fiducial point, then the fiducial point will be N2 for the signal complex shown in panel (c) but N1 for the signal complex shown in panel (d).
- multiple fiducial points are defined for signal alignment in ad-junction with ASCI-based morphological analysis. Specifically, for a given template signal representing conducted ventricular IEGM, multiple fiducial points (if available) are defined in a sequential order, that is, 1 st fiducial point, 2 nd fiducial point, 3 rd fiducial point, etc. Similar fiducal points (if available) are also identified for a test ventricular IEGM signal.
- the fiducial points can be defined in the following order: dominant positive peak (1 st fiducial point; P1 in (a) and P2 in (b)), dominant negative peak (2 nd fiducial point; N1 in both (a) and (b)), secondary positive peak (3 rd fiducial point; P2 in (a) and P1 in (b)).
- the fiducial points can be defined in the following order: dominant positive peak (1 st fiducial point; P1 in both (c) and (d)), dominant negative peak (2 nd fiducial point; N2 in (c) and N1 in (d)), secondary negative peak (3 rd fiducial point; N1 in (c) and N2 in (d)).
- the two signals are first aligned with the 1 st fiducial point, and their ASCI value is calculated. If the resulting ASCI value is higher than a predefined threshold (e.g., 0.8), then it indicates the two signals have similar morphology (as described in details below). The signal alignment is considered valid, and no further calculation is needed. On the other hand, if the resulting ASCI value is lower than the predefined threshold (e.g., 0.8), then it indicates the two signals have different morphology (as described in details below). Then the signals are re-aligned with the 2 nd fiducial point (if available for both signals), and their ASCI value is re-calculated.
- a predefined threshold e.g. 0.8
- the re-calculated ASCI value is higher than the predefined threshold (e.g., 0.8), then it indicates misalignment for the 1 st fiducial point, but the alignment based on the 2 nd fiducial point is valid.
- the signals are considered to have similar morphology and no further calculation is needed. Similar test can be performed for the 3 rd fiducial point (if available for both signals) if the ASCI value obtained for the 2 nd fiducial point is still lower than the predefined threshold (e.g., 0.8). No further test is needed if a fiducial point is only available for one signal but not the other signal. If all ASCI values are below the predefined threshold (e.g., 0.8), no matter which fiducial point is chosen, then it is determined that the test signal and the template signal have different morphology.
- the predefined threshold e.g. 0.8
- R denote the ventricular IEGM signal space that spans from V min to V max , where V min is the minimum amplitude and V max is the maximum amplitude that could be measured by the ventricular sensing channel.
- R P as the positive subspace
- R Z as the zero subspace
- R N the negative subspace.
- all three subspaces (R P , R Z , R N ) are adaptive to the template signal representing conducted ventricular IEGM morphology.
- four threshold vectors TL D , TL P , TU P , TU D are defined from the template signal X .
- X [ x(1), x(2), ..., x(L) ], where L is the number of samples in signal X .
- TL P [ tlp(1), tlp(2), ..., tlp(L)] as the proximal lower threshold vector
- TL D [ tld(1), tld(2), ..., tld(L) ] as the distal lower threshold vector
- TUp [ tup(1), tup(2), ..., tup(L) ] as the proximal upper threshold vector
- TU D [ tud(1), tud(2), ..., tud(L) ] as the distal upper threshold vector.
- threshold vectors are defined such that TL D ⁇ TL P ⁇ X ⁇ TU P ⁇ TU D , or specifically, tld(i) ⁇ tlp(i) ⁇ x(i) ⁇ tup(i) ⁇ tud(i) , for 1 ⁇ i ⁇ L .
- the positive subspace R P is defined as the region bounded by TL P and TU P
- the negative subspace R N is defined as the region above TU D or below TL D
- the zero subspace R Z is defined as the region bounded between TU P and TU D , and that between TL D and TL P .
- a sample in R P is proximal to the template
- a sample in R N is distal to the template
- a sample in R Z is at intermediate distance to the template.
- max(abs(X)) is the peak absolute amplitude of the template signal
- ⁇ and ⁇ are programmable scaling coefficients that satisfy 0 ⁇ ⁇ ⁇ ⁇ .
- the resulting threshold vectors are symmetric around the template signal.
- the four threshold vectors so that they are adaptive to the template signal X , for example, either based on sample-by-sample amplitude of X, or based on specific features of X, such as its maximum, minimum, max absolute, mean, median, etc., or their combinations.
- the upper threshold vectors and the lower threshold vectors can be symmetric or asymmetric around the template signal.
- the three subspaces can be defined from four threshold vectors that are adaptive to the template signal by means of the method described above.
- the three subspaces can be adjusted by redefining the threshold vectors based on the new template.
- both signals are first trichotomized based on three subspaces that are adaptive to the defined template signal.
- signal X is trichotomized to TX by converting all its data samples to values selected from ⁇ -1, 0, 1 ⁇ , based on which subspace each data sample belongs to.
- signal X is the template signal representing conducted ventricular IEGM morphology
- ASCI(X, Y) measures the similarity between a test ventricular IEGM signal Y and the template signal X .
- TX all elements of its trichotomized signal
- TX all samples of X are within the positive subspace R P .
- Y its trichotomized signal TY will have more 1s if more samples of Y are close to the corresponding samples of X, i.e., Y is similar to X.
- Y gradually deviates from X, its trichotomized signal TY has less 1s, more 0s, and eventually more -1s.
- R P , R Z , and R N which are adaptive to the template signal
- ASCI X ⁇ Y TX ⁇ TY TX ⁇ TX ⁇ TY ⁇ TY
- tx(i) ty(i)
- their SCP is 1.
- the sample pair x(i) and y(i) are considered neither concordant, nor discordant. Specifically, one sample is within the zero subspace, and the other sample is either in the positive subspace or in the negative subspace.
- ASCI(X, Y) can be simply calculated as the accumulative sum of all trichotomized samples of test signal Y normalized by the number of samples.
- Figure 6 shows two examples of calculating ASCI for particular application to the assessment of IEGM morphology similarity in an ICD.
- signal X blue trace
- the four threshold vectors are defined based on the template signal according to the method illustrated in Figure 5 .
- the test IEGM signal Y red trace
- the corresponding ASCI(X, Y) is calculated as described above.
- panel (a) the calculated ASCI(X, Y) is 0.90
- panel (b) the resulting ASCI(X, Y) is 0.08.
- the supra-threshold ASCI(X, Y) obtained in panel (a) indicates X and Y have similar morphology.
- the sub-threshold ASCI(X, Y) obtained in panel (b) indicates X and Y have different morphology.
- ASCI(X, Y) provides a quantitative measure of the similarity between signals X and Y .
- the definition of ASCI is compatible to the conventional definition of Pearson's correlation coefficient ( CC ). Similar to CC, ASCI(X, Y) is a normalized index ranging from -1 to +1. If signals X and Y have similar morphology, they will have more concordant sample pairs, and ASCI(X, Y) will approach +1. On the other hand, if signals X and Y have different morphology, they will have fewer concordant sample pairs, and ASCI(X, Y) will be less. If most sample pairs of X and Y are discordant, then ASCI(X, Y) will approach -1. However, the ASCI is advantageous compared to Pearson's CC , due to at least three reasons:
- the ASCI can reliably and efficiently measure the morphological similarity between signals, it can be used to facilitate SVT and VT classification in an ICD.
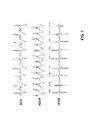
- Figure 7 shows an episode of SVT with 3:2 Wenckebach periodicity.
- the surface ECG, the atrial IEGM, and the ventricular IEGM are shown.
- the template waveform representing conducted ventricular IEGM was created by means of beat averaging as illustrated in Figure 1 and Figure 2 , and the three subspaces were created by defining four threshold vectors that are adaptive to the template waveform as illustrated in Figure 5 .
- each ventricular IEGM cycle (test signal) was aligned with the template signal based on predefined fiducial point as discussed above, and the ASCI value between the test signal and the template signal was calculated.
- the resulting ASCI values for the first 8 ventricular cycles are high (range from 0.76 to 1.0), indicating the ventricular IEGM has similar morphology to the template signal, thus implying they are antegrade conducted beats.
- the resulting ASCI value is low (0.15), indicating the ventricular IEGM has different morphology than the template signal, thus implying ventricular origin of the beat.
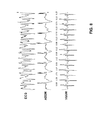
- Figure 8 shows an episode of VT with higher ventricular rate than the atrial rate.
- the surface ECG, the atrial IEGM, and the ventricular IEGM are shown.
- the template waveform representing conducted ventricular IEGM was created by means of beat averaging as illustrated in Figure 1 and Figure 2 , and the three subspaces were created by defining four threshold vectors that are adaptive to the template waveform as illustrated in Figure 5 .
- each ventricular IEGM cycle (test signal) was aligned with the template signal based on predefined fiducial point as discussed above, and the ASCI value between the test signal and the template waveform was calculated.
- the resulting ASCI values are consistently low (range from 0.06 to 0.26), indicating the ventricular IEGM has different morphology than the template signal, thus implying ventricular origin of the beats.
- the SVT-VT classification is made by means of RR interval analysis combined with ASCI-based morphological analysis of the ventricular IEGM.
- VT detection algorithms which maintains an up/down VT sample counter.
- the counter is increased by each RR interval within the predefined VT/VF zone, and is decreased by each RR interval within the predefined sinus zone.
- a VT episode is detected if the VT sample counter exceeds a predefined threshold (e.g., 12).
- a predefined threshold e.g. 12
- such an RR interval analysis based VT detection algorithm can be further enhanced by evaluating the ASCI value between the template waveform representing conducted ventricular IEGM and each cycle of ventricular IEGM (test signal).
- a short ventricular cycle that falls in the VT/VF zone is counted toward VT (i.e., increment VT sample counter by 1) if and only if the ASCI value between the test signal and the template waveform is below a predefined threshold (e.g., 0.5).
- a predefined threshold e.g., 0.5
- the VT sample counter does not change or decreases by a delta value.
- the VT sample counter does not change if 0.5 ⁇ ASCI ⁇ 0.7, or is decreased by 1 ⁇ 4 if 0.7 ⁇ ASCI ⁇ 0.8, or is decreased by 1 ⁇ 2 if 0.8 ⁇ ASCI ⁇ 0.9, or is decreased by 1 if 0.9 ⁇ ASCI ⁇ 1.
- the ASCI-based morphological analysis is used to enhance the SVT-VT classification algorithm that involves both atrial and ventricular rate and rhythm analysis.
- Such algorithms analyze the average heart rate, the rate stability, and the beat-to-beat relation between atrial and ventricular activity (AV relation).
- Multiple detection criteria are used to determine if a short cycle (in VT zone) belongs to VT or SVT. Detailed description of detection criteria of such a SVT-VT classification algorithm is given in:
- the VT sample counter is based on both RR interval and the detection decision criteria. Similarly, a VT episode is detected if the VT sample counter exceeds a predefined threshold (e.g., 12). In a typical example, the VT sample counter is increased by 1 if the RR interval is in VT zone and the cycle meets VT detection criteria. The VT sample counter is decreased by 1 ⁇ 4 for sinus tachycardia (ST) with 1:1 AV relationship, and decreased by 1 for other SVT (e.g., atrial fibrillation, atrial flutter) interval in the VT zone. The VT sample counter is also decreased by 1 if the RR interval is in sinus interval zone.
- ST sinus tachycardia
- other SVT e.g., atrial fibrillation, atrial flutter
- VT sample counter does not change (freeze) for a cycle in ventricular fibrillation (VF) zone.
- a separate counter is maintained to count the cycles in VF zone for VF detection based on conventional X-out-of-Y criterion (e.g., 8 out of 12 beats having a short RR interval in VF zone).
- VT detection algorithm can be further enhanced by evaluating the ASCI value between the template waveform representing conducted ventricular IEGM and each cycle of ventricular IEGM (test signal).
- a short ventricular cycle that meets the VT detection criteria is counted toward VT (i.e., increment VT sample counter by 1) if and only if the ASCI value between the test signal and the template waveform is below a predefined threshold (e.g., 0.5).
- a predefined threshold e.g. 0. 0.5
- the two signals have different morphology, thus confirming ventricular origin of the ventricular beat. Otherwise, it implies that the two signals have similar morphology, thus indicating supraventricular origin of the ventricular beat. Consequently, the VT sample counter does not change or decreases by a delta value.
- the VT sample counter does not change if 0.5 ⁇ ASCI ⁇ 0.7, or is decreased by 1 ⁇ 4 if 0.7 ⁇ ASCI ⁇ 0.8, or is decreased by 1 ⁇ 2 if 0.8 ⁇ ASCI ⁇ 0.9, or is decreased by 1 if 0.9 ⁇ ASCI ⁇ 1.
- the ASCI-based morphology analysis is only activated to facilitate SVT-VT detection when the algorithm which is based on both atrial and ventricular rate and rhythm analysis has difficulty to determine SVT or VT rhythm, for example, when the algorithm makes the decision of SVT or VT with 1:1 AV relationship.
- the algorithm has high confidence of its decision, for example, detection of VT when ventricular rate is higher than atrial rate, or detection of atrial fibrillation if atrial rate is higher than ventricular rate and ventricular rate is unstable, then ASCI-based morphology analysis is not needed.
- the ASCI-based morphology analysis is applied to atrial IEGM to facilitate SVT-VT detection when the algorithm which is based on both atrial and ventricular rate and rhythm analysis makes the decision of SVT or VT with 1:1 AV relationship.
- an atrial IEGM template waveform representing intrinsic atrial depolarization is created and maintained in a similar manner as the ventricular IEGM template.
- the atrial IEGM is compared with the atrial template waveform and their ASCI value is calculated. If the resulting ASCI is higher than a predefined threshold (e.g., 0.5), then it indicates that the two signals have similar morphology.
- a predefined threshold e.g., 0.5
- the beat can be counted toward SVT.
- the resulting ASCI is lower than the predefined threshold (e.g., 0.5), then it indicates that the two signals have different morphology. This suggests that the atrial IEGM may be the result of retrograde conduction, thus the beat can be counted toward VT.
Abstract
Description
- The present invention generally relates to implantable cardiac devices, including pacemakers, defibrillators and cardioverters, which stimulate cardiac tissue electrically to control the patient's heart rhythm. More particularly, the present invention relates to a method and apparatus for classifying of supraventricular tachyarrhythmia (SVT) from ventricular tachyarrhythmia (VT) based on morphological analysis of the intracardiac electrogram (IEGM) recorded by the implantable cardiac devices.
- Implantable cardioverter-defibrillator (ICD) is a demonstrated therapy for treating life-threatening VT, including ventricular tachycardia and ventricular fibrillation. Successful ICD therapy relies on fast and accurate detection of VT. However, despite high sensitivity, one of the major limitations of the current ICD devices is the relatively low specificity for VT detection. False VT detection frequently occurs in the case of SVT, particular in the case of 1:1 AV association. Consequently, this low specificity often results in inappropriate ICD shocks delivered for SVT, causing patient's discomfort, negatively affecting their quality of life, and reducing device longevity because of unnecessary current drain.
- Conventionally, the VT detection algorithm in the ICDs is based on cardiac inter-beat or RR interval analysis. Different VT zones are programmed based on predefined thresholds of RR intervals or ventricular rates. Because SVT frequently results in short RR intervals or high ventricular rates that also fall in the VT zone, enhancement of the VT detection algorithm was made by including additional criteria such as sudden onset and stability.
- For dual-chamber ICDs, the discrimination of SVT from VT can be substantially enhanced by the addition of atrial sensing capability. Many types of SVT rhythms, such as atrial flutter and atrial fibrillation, can be easily distinguished from the VT by the evidence of AV dissociation. However, the challenge to discriminate SVT from VT in the presence of 1:1 AV relationship, such as during sinus tachycardia or AV nodal reentrant tachycardia, still remains.
- Morphological analysis has also been used to facilitate the SVT-VT classification. Usually, a template IEGM of conducted baseline rhythm is recorded and maintained. During fast ventricular activation, the rhythm is classified as SVT if the IEGM morphology is similar to the template waveform, whereas it is classified as VT if the IEGM morphology is distinctly different from the template waveform. All morphology-based SVT-VT classification algorithms require proper alignment of the template waveform and the test IEGM.
- One morphology analysis method is based on correlation analysis. However, the calculation of conventional correlation coefficient (CC) between two vectors requires extensive floating-point operation, which renders it not feasible for implementation in the low-power devices or systems. As a compromise, an algorithm may only select a small number of samples from the signal (for example 8) to calculate an alternative index termed feature correlation coefficient (FCC). Despite this simplification, the computation load is still high due to the floating-point operation. Also, the waveform morphology is unlikely to be fully characterized by the limited 8 samples, thus FCC may not accurately quantify the similarity between two waveforms. Furthermore, similar to CC, the FCC is less sensitive to the amplitude discrepancy between the signals. For example, the FCC between two signals X and Y = ρ·X, where ρ is a constant scaling factor, is always 1, despite the fact that the amplitude of Y can be significantly different than that of X. Finally, the FCC between two signals is affected by each sample amplitude of each signal, thus is sensitive to additive noise such as impulse noise and continuous random noise.
- Another morphology analysis method is based on metrics that are derived from the signals. The metric used in this algorithm is the peak area of the IEGM waveform, while other metrics (weight, height, zero-crossing, etc.) may also be used. The algorithm measures the difference between the corresponding (normalized) peak areas of the test and template IEGM waveforms. Then a morphology score is generated based on the peak area difference to indicate the similarity between test and template IEGM signals. However, the metric (peak area) derived from the signal is affected by many factors, such that waveforms of different morphologies can have the same metric value. In principle, the waveform morphology is unlikely to be fully characterized by a single or multiple metrics, thus the derived morphology score may not accurately quantify the similarity between two waveforms. Moreover, such an algorithm is known to be very sensitive to the waveform alignment errors.
- Wavelets, especially modified Haar wavelets, have also been used to facilitate discrimination between SVT and VT. In particular, the modified Haar wavelets were used to decompose the IEGM signal into wavelet coefficients. To compare the morphology between a test IEGM and the template waveform, their respective wavelet coefficients are compared. If the match percentage between their wavelet coefficients is greater than a threshold (e.g., 70%), then the test IEGM is considered similar to the template waveform, indicating a conducted beat. Otherwise, the test IEGM is thought to have different morphology than the template waveform, suggesting ventricular origin of the beat. However, because in practice, only limited number of wavelet coefficients are retained to represent the IEGM waveform, some subtle morphological information may be lost through the wavelet transform. As a result, the match percentage between wavelet coefficients may not accurately reflect the morphological similarity between two signals.
- In view of above, there is a need to provide a novel method to accurately, efficiently, and robustly measure the morphological similarity between an IEGM signal and a template waveform, to facilitate discrimination between SVT and VT.
- It is an object of the invention to provide a device, for example an implantable cardiac device, such as a pacemaker, a defibrillator or a cardioverter, for classifying of supraventricular tachyarrhythmia (SVT) from ventricular tachyarrhythmia (VT). The device comprises means for providing a template signal and a test signal originated from an electrogram. The template signal and the test signal comprising samples. The device comprises further means for transforming at least the test signal resulting in a representation of the test signal where the sample values of the signal take integers. The device comprises further means for determining a correlation between the template signal and the test signal, and means for classifying of SVT from ventricular VT based on the correlation.
- The electrogram may be an intracardiac electrogram (IEGM), a surface electrocardiogram (ECG) or a subcutaneous electrogram.
- The invention provides a device which further comprises means for averaging a plurality of cycles of signals to obtain the template signal. Especially cycles of conducted ventricular IEGM signals may be used.
- The invention provides a device which further comprises means for updating the template periodically or continuously after an initial template setup.
- The invention provides a device which further comprises means for aligning the signals based on at least one predefined fiducial point.
- A further object of the invention is providing a device which further comprises means for associating the template signal with at least two subspaces of the template signal space and means for transforming at least one of the template signal and the test signal with respect to the subspaces.
- In an embodiment the means for associating the template signal with at least two subspaces comprises means for defining a first subspace comprising values which differ from the template signal values at the most by a predefined first value, and means for defining a second subspace comprising values which differ from the template signal values at the least by the predefined first value.
- In an other embodiment the means for associating the template signal with at least two subspaces comprises means for associating the template signal with three subspaces, and means for defining a first subspace comprising values which differ from the template signal values at the most by a predefined first value, means for defining a second subspace comprising values which differ from the template signal values at the least by the predefined first value and at the most by a predefined second value, and means for defining a third subspace comprising values which differ from the template signal values at the least by the predefined second value.
- According to another aspect of the invention the device further comprising means for generating threshold vectors bounding the subspaces, where the threshold vectors are generated by increasing or decreasing the sample values of the template signal by a predefined value.
- According to yet another aspect of the invention the means for transforming comprises means for setting a sample value of the transformed signal to a first, second or third integer if the corresponding sample value of the signal belongs to the first, second or third subspace. In a special embodiment the first integer is set to 1, the second integer is set to 0 and the third integer is set to -1.
- In a further embodiment of the invention the device comprises means for determining a correlation using at least the transformed test signal.
- In yet a further embodiment of the invention the device comprises means for determining a correlation using only the transformed test signal.
- In another embodiment the means for determining a correlation comprises means for determining an Adapted Signed Correlation Index (ASCI) as the sum of the sample values of the transformed test signal or by dividing the sum of the sample values of the transformed test signal by the number of samples.
- According to an aspect of the invention the means for classifying comprises means for classifying a ventricular IEGM as being of ventricular origin if the correlation is below a predefined threshold, or as being of supraventricular origin otherwise.
- According to another aspect of the invention the means for classifying comprises means for performing SVT-VT classification by a combination of determining the correlation between the template signal and the test signal and RR interval analysis.
- In an embodiment the means for classifying further comprises means for incrementing a VT sample counter by 1 for a ventricular cycle that falls in the VT/VF zone if and only if the correlation value between the ventricular cycle and the template signal is below a predefined threshold.
- According to yet an other aspect of the invention the means for classifying comprises means for performing SVT-VT classification by a combination of determining the correlation between the template signal and the test signal and SVT-VT classification algorithm that involves both atrial and ventricular rate and rhythm analysis.
- According to yet another aspect of the invention the template signal is an atrial IEGM waveform and the means for classifying comprises means for determining the correlation between an atrial test IEGM signal with the atrial IEGM waveform in case a SVT or VT with 1:1 relationship is detected for distinguishing an intrinsic atrial event from a retrograde conducted atrial event.
- It is further an object of the invention to provide a method for classifying of supraventricular tachyarrhythmia (SVT) from ventricular tachyarrhythmia (VT) using signals provided by an electrogram comprising the steps of:
- providing a template signal and a test signal, the template signal and the test signal comprising samples;
- transforming at least the test signal resulting in a representation of the test signal where the sample values of the signal take integers;
- determining a correlation between the template signal and the test signal; and
- classifying of SVT from ventricular VT based on the correlation.
- According to an aspect of the invention the signals are provided by an intracardiac electrogram (IEGM), a surface electrocardiogram (ECG) or a subcutaneous electrogram.
- In an embodiment of the invention the template signal is obtained by averaging a plurality of cycles of signals, where cycles of conducted ventricular IEGM signals may be used.
- In an embodiment of the invention after an initial template setup the template is updated periodically or continuously.
- In another embodiment of the invention the signals are aligned based on at least one predefined fiducial point.
- According to another aspect of the invention the method for classifying of SVT from VT comprises the further steps of:
- associating the template signal with at least two subspaces of the template signal space and
- transforming at least one of the template signal and the test signal with respect to the subspaces.
- In an embodiment of the invention the at least two subspaces are defined by
- a first subspace comprising values which differ from the template signal values at the most by a predefined first value, and
- a second subspace comprising values which differ from the template signal values at the least by the predefined first value.
- In another embodiment of the invention the template signal is associated with three subspaces and the three subspaces are defined by
- a first subspace comprising values which differ from the template signal values at the most by a predefined first value,
- a second subspace comprising values which differ from the template signal values at the least by the predefined first value and at the most by a predefined second value, and
- a third subspace comprising values which differ from the template signal values at the least by the predefined second value.
- According to an aspect of the invention the subspaces are bounded by threshold vectors.
- In an embodiment of the invention the threshold vectors are obtained by increasing or decreasing the sample values of the template signal by a predefined value.
- In an embodiment of the invention transforming the signals comprises assigning a first, second or third integer to a sample of the transformed signal if the corresponding sample of the signal belongs to the first, second or third subspace. The first integer may be set to 1, the second integer may be set to 0 and the third integer may be set to -1.
- According to an aspect of the invention determination of the correlation is performed using the transformed test signals.
- According to another aspect of the invention determination of the correlation is performed using only the transformed test signal.
- In an embodiment of the invention for determining a correlation a ASCI (Adapted Signed Correlation Index) is determined as the sum of the sample values of the transformed test signal or by dividing the sum of the sample values of the transformed test signal by the number of samples.
- According to an aspect of the invention a ventricular IEGM is classified as being of ventricular origin if the correlation is below a predefined threshold, or as being of supraventricular origin otherwise.
- According to another aspect of the invention SVT-VT classification is performed by a combination of determining the correlation between the template signal and the test signal and RR interval analysis.
- In an embodiment for a ventricular cycle that falls in the VT/VF zone a VT sample counter is increment by 1 if and only if the correlation value between the test and the template signal is below a predefined threshold.
- According to yet an other aspect of the invention SVT-VT classification is performed by a combination of determining the correlation between the template signal and the test signal and SVT-VT classification algorithm that involves both atrial and ventricular rate and rhythm analysis.
- According to a further aspect of the invention the template signal is an atrial IEGM waveform and determining the correlation between an atrial test IEGM signal with the atrial IEGM waveform in case a SVT or VT with 1:1 relationship is detected for distinguishing an intrinsic atrial event from a retrograde conducted atrial event.
- It is further an object of the invention to provide a computer-readable storage medium storing program code for causing a data processing device to perform a method for classifying of supraventricular tachyarrhythmia (SVT) from ventricular tachyarrhythmia (VT) using signals provided by an electrogram, the method comprising the steps of:
- providing a template signal and a test signal, the template signal and the test signal comprising samples;
- transforming at least the test signal resulting in a representation of the test signal where the sample values of the signal take integers;
- determining a correlation between the template signal and the test signal; and
- classifying of SVT from ventricular VT based on the correlation.
- According to this invention, the ASCI is used to quantify the morphological similarity between an IEGM signal and a template waveform. All valid sample pairs are included in the calculation of ASCI, thus complete waveform morphology information of the two signals is retained (i.e., no loss of morphological information due to feature extraction). The calculation of ASCI is computationally efficient because no floating-point operation is necessary. Furthermore, calculation of ASCI is robust against measurement noise and minor alignment error of the signals.
- According to this invention, the template waveform is created by averaging multiple cycles of conducted ventricular IEGM, which is aligned with predefined fiducial point. Preferably, the template waveform is created at high atrial rate (sinus rhythm or atrial pacing) but below the VT detection rate. The template waveform is also preferably updated periodically or dynamically to reflect the gradual change of the conducted IEGM morphology.
- In a preferred embodiment, upon detection of high ventricular rate, the ASCI-based morphological analysis is activated to enhance the existing SVT-VT classification algorithm. For a short ventricular cycle, the ASCI between this cycle's IEGM and the template waveform is calculated. If the ASCI is greater than a predefined threshold, it indicates the test IEGM has similar morphology as the template waveform, suggesting this is a conducted beat. Otherwise, it indicates the test IEGM has different morphology than the template waveform, suggesting the ventricular origin of the beat.
- In this invention, although the IEGM signals are used to illustrate the concept of ASCI-based morphology analysis for SVT and VT classification, it should be understood that the same method could be applied to SVT and VT classification based on surface ECG or subcutaneous electrogram signals.
- The details of the invention can be understood from the following drawings and the corresponding text descriptions.
- Fig. 1
- is a high-level flowchart diagram that illustrates the steps involved in automatic setup of the conducted ventricular IEGM template in an ICD.
- Fig. 2
- shows an example of template setup for conducted ventricular IEGM signals.
- Fig. 3
- shows a high-level flowchart that illustrates the steps involved in running update of the conducted ventricular IEGM template.
- Fig. 4
- illustrates the concept of signal alignment using multiple fiducial points.
- Fig. 5
- illustrates the concept of three subspaces defined by four threshold vectors that are adaptive to the template signal.
- Fig. 6
- shows two examples of calculating ASCI for particular application to the assessment of IEGM morphology similarity in an ICD.
- Fig. 7
- shows an episode of SVT and the ASCI values between the template waveform representing conducted ventricular IEGM and each of the ventricular IEGM signal.
- Fig. 8
- shows an episode of VT and the ASCI values between the template waveform representing conducted ventricular IEGM and each of the ventricular IEGM signal.
- For the purpose of SVT and VT classification, the template waveform is constructed from the electrogram signal that corresponds to antegrade conducted ventricular beat. For implantable cardiac devices, the template waveform can be constructed from the ventricular IEGM corresponding to ventricular sense (VS) event that is associated with preceding atrial sense (AS) or atrial pace (AP) event.
-
Figure 1 shows a high-level flowchart diagram that illustrates the steps involved in automatic setup of the conducted ventricular IEGM template in an ICD. Preferably, the template waveform is created at an atrial rate that is higher than a predefined 'template rate', but below the programmed VT detection rate. In a typical example, the 'template rate' is defined as 20ppm below the programmed VT detection rate. The high atrial rate can be achieved at elevated sinus rhythm, for example, during stress test, or by means of high rate atrial pacing. It is also required that 1:1 AV conduction is maintained during the template setup phase. - Then the ICD collects multiple cycles of the conducted ventricular IEGM signal, which are then aligned based on predefined fiducial point, for example, the positive or negative peak, the maximum slope, the threshold crossing point, etc., as known in the art. For each cycle, the IEGM segment in a fixed window relative to the fiducial point is selected for creating the template signal. In a typical embodiment, the fiducial point is chosen as the dominant peak (positive or negative) of the ventricular IEGM, and the IEGM window spans from 50 ms before the fiducial point to 100 ms after the fiducial point.
- Still refer to
Figure 1 . According to this invention, for each pair of the aligned and windowed ventricular IEGM signals, their morphological similarity is quantified by an Adaptive Signed Correlation Index (ASCI), which will be described in details in the following sections. If for any given cycle pair, the calculated ASCI is lower than a predefined threshold value, then the collected ventricular IEGM signals are considered not stable. A warning is generated by the ICD indicating the template signal is not available at the moment, and the template setup may be retried at a later time. On the other hand, if for all cycle pairs, the calculated ASCI is greater than the predefined threshold value (e.g., 0.8), then all collected ventricular IEGM cycles are considered similar, and the conducted ventricular IEGM template is created by averaging all these aligned IEGM cycles. - As discussed in more details later, the ASCI is calculated based on the definition of three subspaces which are dependent on the template signal. Thus upon creation of the conducted ventricular IEGM template, the ICD further determines the three subspaces as discussed thereinafter. Note that during the initial template setup phase when template waveform has not been available yet, to calculate the ASCI between a pair of IEGM cycles, any one of the two IEGM signals can be initialized as the tentative template signal. Based on this tentative template signal, the three subspaces can be defined, and the similarity between these two signals can be quantified by ASCI. As discussed above, only when all pairs of the collected IEGM cycles result in higher than predefined threshold ASCI values, then these cycles are considered to have similar morphology, and the true template waveform can be created.
-
Figure 2 shows a particular example of template setup for conducted ventricular IEGM signals. In this example, the surface ECG, the atrial IEGM, and the ventricular IEGM are shown (left) for four cardiac cycles in sinus rhythm. Each intrinsic atrial depolarization is followed by a conducted ventricular depolarization. The ventricular IEGM morphology is consistent among the four cycles. The positive peak of the ventricular IEGM is chosen as the fiducial point, and the window size is set from 50 ms before the positive peak to 100 ms after the positive peak. Then the four cycles of ventricular IEGM are averaged to create the conducted ventricular IEGM template waveform (right). - According to this invention, after the initial template setup, the conducted ventricular IEGM template is preferably updated periodically or continuously to reflect the dynamic change of the conducted IEGM morphology. This template running update feature is important because the conducted ventricular IEGM waveform may gradually change over time due to different factors such as heart rate variation, circadian pattern, changes of medication, changes of electrode-tissue interface, etc.
-
Figure 3 shows a high-level flowchart that illustrates the steps involved in running update of the conducted ventricular IEGM template. Preferably, the template running update is activated if and only if the atrial rate (sensed or paced) is higher than the predefined 'template rate' but below the programmed VT detection rate. Upon activation of the template running update, the ICD acquires one cycle of conducted ventricular IEGM (i.e., preceded by an AS or AP event) as the test signal, which is aligned with the template signal based on predefined fiducial point as discussed above. Then the ICD calculates the ASCI between the template signal and the acquired test signal. If the ASCI is lower than a predefined threshold (e.g., 0.8), then the test signal is considered different than the template signal, and no template update is performed for this test cycle. On the other hand, if the calculated ASCI is greater than the predefined threshold (e.g., 0.8), then the test signal is considered similar to the template signal, and the template signal is updated by taking the weighted average of the original template signal and the newly acquired test signal. In an exemplary embodiment, the new template is the sum of the old template signal scaled by 255/256, and the newly acquired test signal scaled by 1/256. By this means, it ensures the stability of the template waveform by retaining 255/256 of the old template signal, whereas it incorporates 1/256 of the test signal to factor in any gradual change of the conducted ventricular IEGM morphology. As discussed in more details later, the ASCI is calculated based on the definition of three subspaces which are dependent on the template signal. Thus the ICD can further adjust the three subspaces based on newly updated template signal, if the adaptive subspace feature is enabled. - One prerequisite for any morphology-based SVT-VT classification algorithms is that the test signal must be properly aligned with the template signal. Morphological analysis based on misaligned signals may yield misleading results. As discussed above, the common practice for signal alignment is based on a predefined fiducial point, such as the positive peak, the negative peak, etc. However, in some cases, the signal alignment based on a single fiducial point is not reliable.
-
Figure 4 shows some examples. Panels (a) and (b) show two signal complexes that have similar morphology. Both signal complexes can be characterized by two positive peaks (P1, P2) that have similar amplitude and one negative peak (N1). If the dominant positive peak is chosen as the fiducial point, then the fiducial point will be P1 for the signal complex shown in panel (a) but P2 for the signal complex shown in panel (b). Similarly, panels (c) and (d) show another pair of signal complexes that have similar morphology. Both signal complexes can be characterized by two negative peaks (N1, N2) that have similar amplitude and one positive peak (P1). If the dominant negative peak is chosen as the fiducial point, then the fiducial point will be N2 for the signal complex shown in panel (c) but N1 for the signal complex shown in panel (d). - According to this invention, multiple fiducial points are defined for signal alignment in ad-junction with ASCI-based morphological analysis. Specifically, for a given template signal representing conducted ventricular IEGM, multiple fiducial points (if available) are defined in a sequential order, that is, 1st fiducial point, 2nd fiducial point, 3rd fiducial point, etc. Similar fiducal points (if available) are also identified for a test ventricular IEGM signal. For example, for the signals shown in panels (a) and (b) of
Figure 4 , the fiducial points can be defined in the following order: dominant positive peak (1st fiducial point; P1 in (a) and P2 in (b)), dominant negative peak (2nd fiducial point; N1 in both (a) and (b)), secondary positive peak (3rd fiducial point; P2 in (a) and P1 in (b)). Similarly, for the signals shown in panels (c) and (d) ofFigure 4 , the fiducial points can be defined in the following order: dominant positive peak (1st fiducial point; P1 in both (c) and (d)), dominant negative peak (2nd fiducial point; N2 in (c) and N1 in (d)), secondary negative peak (3rd fiducial point; N1 in (c) and N2 in (d)). - To compare the morphology of the test signal and the template signal, the two signals are first aligned with the 1st fiducial point, and their ASCI value is calculated. If the resulting ASCI value is higher than a predefined threshold (e.g., 0.8), then it indicates the two signals have similar morphology (as described in details below). The signal alignment is considered valid, and no further calculation is needed. On the other hand, if the resulting ASCI value is lower than the predefined threshold (e.g., 0.8), then it indicates the two signals have different morphology (as described in details below). Then the signals are re-aligned with the 2nd fiducial point (if available for both signals), and their ASCI value is re-calculated. If the re-calculated ASCI value is higher than the predefined threshold (e.g., 0.8), then it indicates misalignment for the 1st fiducial point, but the alignment based on the 2nd fiducial point is valid. The signals are considered to have similar morphology and no further calculation is needed. Similar test can be performed for the 3rd fiducial point (if available for both signals) if the ASCI value obtained for the 2nd fiducial point is still lower than the predefined threshold (e.g., 0.8). No further test is needed if a fiducial point is only available for one signal but not the other signal. If all ASCI values are below the predefined threshold (e.g., 0.8), no matter which fiducial point is chosen, then it is determined that the test signal and the template signal have different morphology.
- According to the experience of the present inventors, using two fiducial points (e.g., dominant positive peak and dominant negative peak) for signal alignment can effectively solve most of the signal misalignment problems caused by using a single fiducial point.
- Refer to
Figure 5 . Let R denote the ventricular IEGM signal space that spans from Vmin to Vmax, where Vmin is the minimum amplitude and Vmax is the maximum amplitude that could be measured by the ventricular sensing channel. Divide R into three subspaces RP, RZ, and RN such that R = RP ∪ RZ ∪ RN and RP ∩ RZ = RP ∩ RN = RZ ∩ RN = ∅, where ∪ is the union operator, ∩ is the intersection operator, and ∅ represents the null space. That is, the three subspaces are non-overlapping yet all together they span the whole signal space. For convenient purpose, in the following descriptions, we term RP as the positive subspace, RZ as the zero subspace, and RN as the negative subspace. - Still refer to
Figure 5 . According to this invention, all three subspaces (RP, RZ, RN) are adaptive to the template signal representing conducted ventricular IEGM morphology. In a preferred embodiment, four threshold vectors TLD, TLP, TUP , TUD are defined from the template signal X. Denote X = [x(1), x(2), ..., x(L)], where L is the number of samples in signal X. Further denote TLP = [tlp(1), tlp(2), ..., tlp(L)] as the proximal lower threshold vector, TLD = [tld(1), tld(2), ..., tld(L)] as the distal lower threshold vector, TUp = [tup(1), tup(2), ..., tup(L)] as the proximal upper threshold vector, and TUD = [tud(1), tud(2), ..., tud(L)] as the distal upper threshold vector. These threshold vectors are defined such that TLD ≤ TLP ≤X≤TUP ≤TUD , or specifically, tld(i) ≤ tlp(i) ≤ x(i) ≤ tup(i) ≤ tud(i), for 1 ≤ i ≤ L. The positive subspace RP is defined as the region bounded by TLP and TUP, the negative subspace RN is defined as the region above TUD or below TLD , and the zero subspace RZ is defined as the region bounded between TUP and TUD , and that between TLD and TLP . Obviously, a sample in RP is proximal to the template, a sample in RN is distal to the template, and a sample in RZ is at intermediate distance to the template. - According to an exemplary embodiment of the present invention, the four threshold vectors are defined from the template signal according to the following equations:
TUP = X + α · max(abs(X))
TLP = X - α · max(abs(X))
TUD = X + β · max(abs(X))
TLD = X - β · max(abs(X)) - Here, max(abs(X)) is the peak absolute amplitude of the template signal, α and β are programmable scaling coefficients that satisfy 0 < α < β. In a typical example, α = 0.25 and β = 0.5, and the resulting threshold vectors are symmetric around the template signal.
- Obviously, there are numerous other means to define the four threshold vectors so that they are adaptive to the template signal X, for example, either based on sample-by-sample amplitude of X, or based on specific features of X, such as its maximum, minimum, max absolute, mean, median, etc., or their combinations. Also, the upper threshold vectors and the lower threshold vectors can be symmetric or asymmetric around the template signal.
- As illustrated in
Figure 1 , after automatic setup of the conducted ventricular IEGM template, the three subspaces can be defined from four threshold vectors that are adaptive to the template signal by means of the method described above. Similarly, during the template running update as illustrated inFigure 3 , after the template signal is updated by taking the weighted average of the old template signal and the new test signal, the three subspaces can be adjusted by redefining the threshold vectors based on the new template. - To calculate the ASCI between two IEGM signals, both signals are first trichotomized based on three subspaces that are adaptive to the defined template signal.
- Denote S as the three-value set {-1, 0, 1}. Assume X = [x(1), x(2), ..., x(L)] is a ventricular IEGM signal, that is, x(i) ∈ R for i = 1, 2, ... L, where L is the number of samples in signal X. Trichotomization of signal X is an operation that maps the signal from R space to S space. Specifically, denote TX = [tx(1), tx(2), ..., tx(L)] as the trichotomized signal of X, where tx(i) ∈ S for i = 1, 2, ... L. Then the trichotomization is formulated as, for

- In other words, signal X is trichotomized to TX by converting all its data samples to values selected from {-1, 0, 1}, based on which subspace each data sample belongs to.
- In a typical embodiment, signal X is the template signal representing conducted ventricular IEGM morphology, and ASCI(X, Y) measures the similarity between a test ventricular IEGM signal Y and the template signal X. For the template signal X, all elements of its trichotomized signal TX are 1 because all samples of X are within the positive subspace RP. For another signal Y, its trichotomized signal TY will have more 1s if more samples of Y are close to the corresponding samples of X, i.e., Y is similar to X. As Y gradually deviates from X, its trichotomized signal TY has less 1s, more 0s, and eventually more -1s.
- Assume X = [x(1), x(2), ..., x(L)] and Y = [y(1), y(2), ..., y(L)] are two signals in R, and each has L samples. Given defined subspaces RP, RZ, and RN (which are adaptive to the template signal), X is trichotomized to TX = [tx(1), tx(2), ..., tx(L)], and Y is trichotomized to TY = [ty(1), ty(2), ..., ty(L)]. The ASCI between X and Y, or ASCI(X, Y), which measures the similarity between X and Y, is defined by the following formula:

- Here, the symbol° den̊otes the signed correlation product (SCP) of two trichotomized vectors, and is defined by the following formula:

- Here, the symbol ⊗ denotes the signed correlation product (SCP) between two trichotomized scalars, and is defined by the following formula:

- Accordingly, if tx(i) = ty(i), their SCP is 1. In this case, the sample pair x(i) and y(i) are considered concordant, meaning that they are in the same subspace. Specifically, both are in the positive subspace if tx(i) = ty(i) = 1; or both are in the negative subspace if tx(i) = ty(i) = -1; or both are in the zero subspace if tx(i) = ty(i) = 0.
- On the other hand, if tx(i)·ty(i)= -1, their SCP is -1. In this case, the sample pair x(i) and y(i) are considered discordant. Specifically, it occurs when tx(i) = 1 and ty(i) = -1, or tx(i) = -1 and ty(i) = 1. In both cases, one sample is in the positive subspace whereas the other sample is in the negative subspace.
- Otherwise, the case must be either tx(i) = 0 and ty(i) ≠ 0, or tx(i) ≠ 0 and ty(i) = 0, and their SCP is 0. In this case, the sample pair x(i) and y(i) are considered neither concordant, nor discordant. Specifically, one sample is within the zero subspace, and the other sample is either in the positive subspace or in the negative subspace.
- According to the above definition, the SCP of two trichotomized vectors (TX·TY) is the sum of the SCP of all sample pairs tx(i) ⊗ ty(i), for i = 1...L. Therefore, the SCP of two trichotomized signals will be increased by each pair of concordant samples (+1), decreased by each pair of discordant samples (-1), and not affected otherwise (neither concordant nor discordant sample pair).
- For two identical signals, all corresponding sample pairs are concordant. Therefore, for above defined TX and TY, it is evident that TX·TX=L and TY·TY=L. Consequently, the formula for calculating ASCI(X, Y) defined above can be simplified to:

- As discussed above, in a typical embodiment, signal X is the template signal representing conducted ventricular IEGM morphology, and all elements of its trichotomized signal TX are 1 because all samples of X are within the positive subspace. Therefore, the formula for calculating ASCI(X, Y) defined above can be further simplified to:

- In other words, the ASCI(X, Y) can be simply calculated as the accumulative sum of all trichotomized samples of test signal Y normalized by the number of samples.
- Now refer to
Figure 6 , which shows two examples of calculating ASCI for particular application to the assessment of IEGM morphology similarity in an ICD. In these examples, signal X (blue trace) is the template signal representing conducted ventricular IEGM. The four threshold vectors are defined based on the template signal according to the method illustrated inFigure 5 . Then the test IEGM signal Y (red trace) is trichotomized, and the corresponding ASCI(X, Y) is calculated as described above. In panel (a), the calculated ASCI(X, Y) is 0.90, whereas in panel (b), the resulting ASCI(X, Y) is 0.08. Assuming a predefined ASCI threshold of 0.50, then the supra-threshold ASCI(X, Y) obtained in panel (a) indicates X and Y have similar morphology. Contrarily, the sub-threshold ASCI(X, Y) obtained in panel (b) indicates X and Y have different morphology. - Therefore, ASCI(X, Y) provides a quantitative measure of the similarity between signals X and Y. The definition of ASCI is compatible to the conventional definition of Pearson's correlation coefficient (CC). Similar to CC, ASCI(X, Y) is a normalized index ranging from -1 to +1. If signals X and Y have similar morphology, they will have more concordant sample pairs, and ASCI(X, Y) will approach +1. On the other hand, if signals X and Y have different morphology, they will have fewer concordant sample pairs, and ASCI(X, Y) will be less. If most sample pairs of X and Y are discordant, then ASCI(X, Y) will approach -1. However, the ASCI is advantageous compared to Pearson's CC, due to at least three reasons:
- First, the calculation of Pearson's CC requires extensive floating-point operation including multiplication, division, and square root. On the other hand, the calculation of ASCI only requires comparison and summation. The threshold vectors that are used to define subspaces can be automatically determined from the template signal, through simple operations such as scaling (bit shifting), adding/subtracting, thresholding, etc. The normalization operation (divided by L) can be omitted because the total number of samples (L) is a known constant. For the purpose of SVT-VT classification, the ASCI will be mainly used for comparison with predefined or user-programmable threshold to determine if two signals have similar morphology. In this case, the threshold can be defined in the form of X-out-of-Y criterion, or by means of bit shifting operation (e.g., to obtain L/2, 3L/4, 7L/8, etc.). Therefore, the calculation of ASCI is computationally much more efficient, and can be easily implemented in firmware or hardware of the ICD.
- Second, Pearson's CC is a parametric measure of linear relationship, and it does not account for the amplitude difference between signals. On the other hand, the calculation of ASCI takes amplitude information into consideration. For the examples shown in
Figure 5 where the subspaces are defined by four threshold vectors which are further adaptive to the template signal X, a high ASCI(X, Y) value requires X and Y must stay close and have similar amplitude throughout the signal length (that is, Y must be bounded by proximal upper and lower threshold vectors around signal X); otherwise, low ASCI(X, Y) value is obtained. - Thirdly, Pearson's CC is affected by each sample amplitude of each signal, thus is sensitive to additive noise such as impulse noise or continuous random noise, as well as sensitive to slight yet normal signal variation. On the other hand, the ASCI(X, Y) is calculated based on trichotomized signals TX and TY, and signal trichotomization is further based on subspaces RP, RZ, and RN that are adaptive to the template signal. Different means to define these subspaces can provide different degrees of tolerance of signal variation. Thus a noise-free signal and the same signal added with noise could have identical trichotomized vectors. Therefore, by properly designing subspaces according to specific application and/or prior knowledge of the signal, the ASCI can be more tolerant to additive noise and normal signal variation than the Pearson's CC.
- Because the ASCI can reliably and efficiently measure the morphological similarity between signals, it can be used to facilitate SVT and VT classification in an ICD.
-
Figure 7 shows an episode of SVT with 3:2 Wenckebach periodicity. In this example, the surface ECG, the atrial IEGM, and the ventricular IEGM are shown. The template waveform representing conducted ventricular IEGM was created by means of beat averaging as illustrated inFigure 1 andFigure 2 , and the three subspaces were created by defining four threshold vectors that are adaptive to the template waveform as illustrated inFigure 5 . Then each ventricular IEGM cycle (test signal) was aligned with the template signal based on predefined fiducial point as discussed above, and the ASCI value between the test signal and the template signal was calculated. As shown in the figure, the resulting ASCI values for the first 8 ventricular cycles are high (range from 0.76 to 1.0), indicating the ventricular IEGM has similar morphology to the template signal, thus implying they are antegrade conducted beats. For the last cycle that represents a ventricular extrasystole (VES), however, the resulting ASCI value is low (0.15), indicating the ventricular IEGM has different morphology than the template signal, thus implying ventricular origin of the beat. -
Figure 8 shows an episode of VT with higher ventricular rate than the atrial rate. In this example, the surface ECG, the atrial IEGM, and the ventricular IEGM are shown. Similarly, the template waveform representing conducted ventricular IEGM was created by means of beat averaging as illustrated inFigure 1 andFigure 2 , and the three subspaces were created by defining four threshold vectors that are adaptive to the template waveform as illustrated inFigure 5 . Then each ventricular IEGM cycle (test signal) was aligned with the template signal based on predefined fiducial point as discussed above, and the ASCI value between the test signal and the template waveform was calculated. As shown in the figure, the resulting ASCI values are consistently low (range from 0.06 to 0.26), indicating the ventricular IEGM has different morphology than the template signal, thus implying ventricular origin of the beats. - In one embodiment, the SVT-VT classification is made by means of RR interval analysis combined with ASCI-based morphological analysis of the ventricular IEGM. For example, there exist VT detection algorithms which maintains an up/down VT sample counter. For single chamber devices with ventricular-only sensing, the counter is increased by each RR interval within the predefined VT/VF zone, and is decreased by each RR interval within the predefined sinus zone. A VT episode is detected if the VT sample counter exceeds a predefined threshold (e.g., 12). As known in the art, the sudden onset and RR interval stability criteria can be applied to enhance the performance of SVT-VT classification. According to this invention, such an RR interval analysis based VT detection algorithm can be further enhanced by evaluating the ASCI value between the template waveform representing conducted ventricular IEGM and each cycle of ventricular IEGM (test signal). In a preferred embodiment, a short ventricular cycle that falls in the VT/VF zone is counted toward VT (i.e., increment VT sample counter by 1) if and only if the ASCI value between the test signal and the template waveform is below a predefined threshold (e.g., 0.5). This implies that the two signals have different morphology, thus confirming ventricular origin of the ventricular beat. Otherwise, it implies that the two signals have similar morphology, thus indicating supraventricular origin of the ventricular beat. Consequently, the VT sample counter does not change or decreases by a delta value. For example, the VT sample counter does not change if 0.5 ≤ ASCI < 0.7, or is decreased by ¼ if 0.7 ≤ ASCI < 0.8, or is decreased by ½ if 0.8 ≤ ASCI < 0.9, or is decreased by 1 if 0.9 ≤ ASCI ≤ 1.
- In another embodiment, the ASCI-based morphological analysis is used to enhance the SVT-VT classification algorithm that involves both atrial and ventricular rate and rhythm analysis. Such algorithms analyze the average heart rate, the rate stability, and the beat-to-beat relation between atrial and ventricular activity (AV relation). Multiple detection criteria are used to determine if a short cycle (in VT zone) belongs to VT or SVT. Detailed description of detection criteria of such a SVT-VT classification algorithm is given in:
- Theuns et al., 'Initial clinical experience with a new arrhythmia detection algorithm in dual chamber implantable cardioverter defibrillators', Europace 2001; 3:181-186, and Sinha et al., 'Clinical experience with a new detection algorithm for differentiation of supraventricular from ventricular tachycardia in a dual-chamber defibrillator', JCE 2004; 15: 646-652.
- In known SVT-VT classification algorithms, the VT sample counter is based on both RR interval and the detection decision criteria. Similarly, a VT episode is detected if the VT sample counter exceeds a predefined threshold (e.g., 12). In a typical example, the VT sample counter is increased by 1 if the RR interval is in VT zone and the cycle meets VT detection criteria. The VT sample counter is decreased by ¼ for sinus tachycardia (ST) with 1:1 AV relationship, and decreased by 1 for other SVT (e.g., atrial fibrillation, atrial flutter) interval in the VT zone. The VT sample counter is also decreased by 1 if the RR interval is in sinus interval zone. In addition, VT sample counter does not change (freeze) for a cycle in ventricular fibrillation (VF) zone. A separate counter is maintained to count the cycles in VF zone for VF detection based on conventional X-out-of-Y criterion (e.g., 8 out of 12 beats having a short RR interval in VF zone).
- According to the present invention, VT detection algorithm can be further enhanced by evaluating the ASCI value between the template waveform representing conducted ventricular IEGM and each cycle of ventricular IEGM (test signal).
- In an exemplary embodiment, a short ventricular cycle that meets the VT detection criteria is counted toward VT (i.e., increment VT sample counter by 1) if and only if the ASCI value between the test signal and the template waveform is below a predefined threshold (e.g., 0.5). This implies that the two signals have different morphology, thus confirming ventricular origin of the ventricular beat. Otherwise, it implies that the two signals have similar morphology, thus indicating supraventricular origin of the ventricular beat. Consequently, the VT sample counter does not change or decreases by a delta value. For example, the VT sample counter does not change if 0.5 ≤ ASCI < 0.7, or is decreased by ¼ if 0.7 ≤ ASCI < 0.8, or is decreased by ½ if 0.8 ≤ ASCI < 0.9, or is decreased by 1 if 0.9 ≤ ASCI ≤ 1.
- Yet in another exemplary embodiment, the ASCI-based morphology analysis is only activated to facilitate SVT-VT detection when the algorithm which is based on both atrial and ventricular rate and rhythm analysis has difficulty to determine SVT or VT rhythm, for example, when the algorithm makes the decision of SVT or VT with 1:1 AV relationship. On the contrary, when the algorithm has high confidence of its decision, for example, detection of VT when ventricular rate is higher than atrial rate, or detection of atrial fibrillation if atrial rate is higher than ventricular rate and ventricular rate is unstable, then ASCI-based morphology analysis is not needed.
- According to yet another embodiment of the present invention, the ASCI-based morphology analysis is applied to atrial IEGM to facilitate SVT-VT detection when the algorithm which is based on both atrial and ventricular rate and rhythm analysis makes the decision of SVT or VT with 1:1 AV relationship. Specifically, an atrial IEGM template waveform representing intrinsic atrial depolarization is created and maintained in a similar manner as the ventricular IEGM template. When the algorithm detects SVT or VT with 1:1 AV relationship, the atrial IEGM is compared with the atrial template waveform and their ASCI value is calculated. If the resulting ASCI is higher than a predefined threshold (e.g., 0.5), then it indicates that the two signals have similar morphology. This implies the intrinsic nature of the atrial IEGM, thus the beat can be counted toward SVT. On the other hand, if the resulting ASCI is lower than the predefined threshold (e.g., 0.5), then it indicates that the two signals have different morphology. This suggests that the atrial IEGM may be the result of retrograde conduction, thus the beat can be counted toward VT.
Claims (19)
- A device for classifying of supraventricular tachyarrhythmia (SVT) from ventricular tachyarrhythmia (VT) comprising:- means for providing a template signal and a test signal originated from an electrogram, the template signal and the test signal comprising samples;- means for transforming at least the test signal resulting in a representation of the test signal where the sample values of the signal take integers;- means for determining a correlation between the template signal and the test signal; and- means for classifying of SVT from ventricular VT based on the correlation.
- The device according to claim 1, where the device is an implantable cardiac device, such as a pacemaker, a defibrillator or a cardioverter and wherein electrogram is an intracardiac electrogram (IEGM), a surface electrocardiogram (ECG) or a subcutaneous electrogram.
- The device according to claim 1 or 2, further comprising means for averaging a plurality of cycles of signals to obtain the template signal and wherein cycles of conducted ventricular IEGM signals are used.
- The device according to one of the preceding claims 1 to 3, further comprising means for updating the template periodically or continuously after an initial template setup.
- The device according to one of the preceding claims 1 to 4, further comprising means for aligning the signals based on at least one predefined fiducial point.
- The device according to one of the preceding claims 1 to 5, further comprising- means for associating the template signal with at least two subspaces of the template signal space and- means for transforming at least one of the template signal and the test signal with respect to the subspaces.
- The device according to claim 6, wherein the means for associating the template signal with at least two subspaces comprises- means for defining a first subspace comprising values which differ from the template signal values at the most by a predefined first value, and- means for defining a second subspace comprising values which differ from the template signal values at the least by the predefined first value orwherein the means for associating the template signal with at least two subspaces comprises- means for associating the template signal with three subspaces, and- means for defining a first subspace comprising values which differ from the template signal values at the most by a predefined first value,- means for defining a second subspace comprising values which differ from the template signal values at the least by the predefined first value and at the most by a predefined second value, and- means for defining a third subspace comprising values which differ from the template signal values at the least by the predefined second value.
- The device according to claim 6, further comprising means for generating threshold vectors bounding the subspaces or by increasing or decreasing the sample values of the template signal by a predefined value.
- The device according to one of the preceding claims 6 to 8, wherein the means for transforming comprises means for setting a sample value of the transformed signal to a first, second or third integer if the corresponding sample value of the signal belongs to the first, second or third subspace and wherein the first integer is 1, the second integer is 0 and the third integer is -1.
- The device according to one of the preceding claims 1 to 9, where the means for determining a correlation using at least the transformed test signal or only the transformed test signal.
- The device according to one of the preceding claims 1 to 10, where the means for determining a correlation comprises means for determining an adapted signed correlation index as the sum of the sample values of the transformed test signal or by dividing the sum of the sample values of the transformed test signal by the number of samples.
- The device according to one of the preceding claims 1 to 11, where the means for classifying comprises means for classifying a ventricular IEGM as being of ventricular origin if the correlation is below a predefined threshold, or as being of supraventricular origin otherwise or wherein the means for classifying comprises means for performing SVT-VT classification by a combination of determining the correlation between the template signal and the test signal and RR interval analysis and wherein the means for classifying further comprises means for incrementing a VT sample counter by 1 for a ventricular cycle that falls in the VT/VF zone if and only if the correlation value between the ventricular cycle and the template signal is below a predefined threshold.
- The device according to on of the preceding claims 1 to 12, where the means for classifying comprises means for performing SVT-VT classification by a combination of determining the correlation between the template signal and the test signal and SVT-VT classification algorithm that involves both atrial and ventricular rate and rhythm analysis.
- The device according to on of the preceding claims 1 to 13, where the template signal is an atrial IEGM waveform and the means for classifying comprises means for determining the correlation between an atrial test IEGM signal with the atrial IEGM waveform in case a SVT or VT with 1:1 relationship is detected for distinguishing an intrinsic atrial event from a retrograde conducted atrial event.
- A method for classifying of supraventricular tachyarrhythmia (SVT) from ventricular tachyarrhythmia (VT) using signals provided by an electrogram comprising the steps of:- providing a template signal and a test signal, the template signal and the test signal comprising samples;- transforming at least the test signal resulting in a representation of the test signal where the sample values of the signal take integers;- determining a correlation between the template signal and the test signal; and- classifying of SVT from ventricular VT based on the correlation.
- The method according to claim 15, wherein for determining a correlation an adapted signed correlation index is determined as the sum of the sample values of the transformed test signal or by dividing the sum of the sample values of the transformed test signal by the number of samples.
- The method according to claim 15 or 16, where the signals are aligned based on at least one predefined fiducial point.
- The method according to one of the preceding claims 15 to 17, comprising the further steps of:- associating the template signal with at least two subspaces of the template signal space and- transforming at least one of the template signal and the test signal with respect to the subspaceswherein the template signal is associated with three subspaces and the three subspaces are defined by- a first subspace comprising values which differ from the template signal values at the most by a predefined first value,- a second subspace comprising values which differ from the template signal values at the least by the predefined first value and at the most by a predefined second value, and- a third subspace comprising values which differ from the template signal values at the least by the predefined second value.
- A computer-readable storage medium storing program code for causing a data processing device to perform a method for classifying of supraventricular tachyarrhythmia (SVT) from ventricular tachyarrhythmia (VT) using signals provided by an electrogram, the method comprising the steps of:- providing a template signal and a test signal, the template signal and the test signal comprising samples;- transforming at least the test signal resulting in a representation of the test signal where the sample values of the signal take integers;- determining a correlation between the template signal and the test signal; and- classifying of SVT from ventricular VT based on the correlation.
Applications Claiming Priority (1)
| Application Number | Priority Date | Filing Date | Title |
|---|---|---|---|
| US3733408P | 2008-03-18 | 2008-03-18 |
Publications (2)
| Publication Number | Publication Date |
|---|---|
| EP2103253A1 true EP2103253A1 (en) | 2009-09-23 |
| EP2103253B1 EP2103253B1 (en) | 2011-03-30 |
Family
ID=39937330
Family Applications (2)
| Application Number | Title | Priority Date | Filing Date |
|---|---|---|---|
| EP08164155A Active EP2103253B1 (en) | 2008-03-18 | 2008-09-11 | Device and computer-readable storage medium for SVT and VT Classification |
| EP09001816A Not-in-force EP2103254B1 (en) | 2008-03-18 | 2009-02-10 | Device and computer-readable storage medium for classifying VS or VES |
Family Applications After (1)
| Application Number | Title | Priority Date | Filing Date |
|---|---|---|---|
| EP09001816A Not-in-force EP2103254B1 (en) | 2008-03-18 | 2009-02-10 | Device and computer-readable storage medium for classifying VS or VES |
Country Status (4)
| Country | Link |
|---|---|
| US (1) | US8082028B2 (en) |
| EP (2) | EP2103253B1 (en) |
| AT (1) | ATE503417T1 (en) |
| DE (1) | DE602008005841D1 (en) |
Cited By (2)
| Publication number | Priority date | Publication date | Assignee | Title |
|---|---|---|---|---|
| CN102835954A (en) * | 2012-09-07 | 2012-12-26 | 深圳市邦健电子有限公司 | Method for generating heart beating waveform template and treating ventricular premature beat detection and device |
| CN110251228A (en) * | 2014-01-29 | 2019-09-20 | 韦伯斯特生物官能(以色列)有限公司 | Dual bi-polar configuration for atrial fibrillation annotation |
Families Citing this family (21)
| Publication number | Priority date | Publication date | Assignee | Title |
|---|---|---|---|---|
| WO2009092055A1 (en) | 2008-01-18 | 2009-07-23 | Cameron Health, Inc. | Data manipulation following delivery of a cardiac stimulus in an implantable cardiac stimulus device |
| CA2717442C (en) | 2008-03-07 | 2017-11-07 | Cameron Health, Inc. | Accurate cardiac event detection in an implantable cardiac stimulus device |
| WO2009111766A2 (en) | 2008-03-07 | 2009-09-11 | Cameron Health, Inc. | Methods and devices for accurately classifying cardiac activity |
| ES2386623T3 (en) | 2008-05-07 | 2012-08-23 | Cameron Health, Inc. | Devices to accurately classify cardiac activity |
| US8712523B2 (en) | 2008-12-12 | 2014-04-29 | Cameron Health Inc. | Implantable defibrillator systems and methods with mitigations for saturation avoidance and accommodation |
| AU2010273710B2 (en) | 2009-06-29 | 2016-05-26 | Cameron Health, Inc. | Adaptive confirmation of treatable arrhythmia in implantable cardiac stimulus devices |
| US8265737B2 (en) | 2009-10-27 | 2012-09-11 | Cameron Health, Inc. | Methods and devices for identifying overdetection of cardiac signals |
| US8744555B2 (en) | 2009-10-27 | 2014-06-03 | Cameron Health, Inc. | Adaptive waveform appraisal in an implantable cardiac system |
| US8548573B2 (en) | 2010-01-18 | 2013-10-01 | Cameron Health, Inc. | Dynamically filtered beat detection in an implantable cardiac device |
| US8903490B2 (en) * | 2010-03-03 | 2014-12-02 | Cardiac Pacemakers, Inc. | Methods and systems for recognizing arrhythmias using neural stimulation |
| JP2013535236A (en) * | 2010-07-01 | 2013-09-12 | カーディアック ペースメイカーズ, インコーポレイテッド | Rhythm correlation diagnostic measurement |
| US8403830B2 (en) * | 2010-08-06 | 2013-03-26 | Cardiac Pacemakers, Inc. | Rhythm discrimination enhancement—AV drive |
| US9211414B2 (en) | 2011-05-12 | 2015-12-15 | Biotronik Se & Co Kg | Implantable heart stimulator and method for trending analysis of ventricular activation time |
| US8718750B2 (en) | 2011-05-26 | 2014-05-06 | Biotronik Se & Co. Kg | Heart stimulator and method for A-V delay optimization |
| EP2589333A1 (en) | 2011-11-04 | 2013-05-08 | BIOTRONIK SE & Co. KG | Apparatus and system for long-term cutaneous cardiac monitoring |
| US20140200486A1 (en) * | 2013-01-17 | 2014-07-17 | Quaerimus, Inc. | System and method for continuous monitoring of a human foot for signs of ulcer development |
| US9050013B2 (en) | 2013-01-22 | 2015-06-09 | Biotronik Se & Co. Kg | Device and method for fusion beat detection |
| EP2967404B1 (en) | 2013-03-11 | 2019-05-22 | Cameron Health, Inc. | Device implementing dual criteria for arrhythmia detection |
| US9554714B2 (en) | 2014-08-14 | 2017-01-31 | Cameron Health Inc. | Use of detection profiles in an implantable medical device |
| US10433749B2 (en) * | 2016-08-10 | 2019-10-08 | Biosense Webster (Israel) Ltd. | Identifying ECG signals having the same morphology |
| WO2018166136A1 (en) * | 2017-03-14 | 2018-09-20 | 华为技术有限公司 | Method and apparatus for processing waveform signal |
Citations (4)
| Publication number | Priority date | Publication date | Assignee | Title |
|---|---|---|---|---|
| US20030181818A1 (en) * | 2002-03-25 | 2003-09-25 | Jaeho Kim | Method and system for characterizing a representative cardiac beat using multiple templates |
| US6636764B1 (en) * | 2000-11-28 | 2003-10-21 | Pacesetter, Inc. | Safety backup in arrhythmia discrimination algorithm |
| US20060270937A1 (en) * | 2001-04-25 | 2006-11-30 | Koyrakh Lev A | Automated Template Generation Algorithm for Implantable Device |
| EP1803485A2 (en) * | 2003-05-29 | 2007-07-04 | Cameron Health, Inc. | Method for discriminating between ventricular and supraventricular arrhythmias |
Family Cites Families (5)
| Publication number | Priority date | Publication date | Assignee | Title |
|---|---|---|---|---|
| EP1178855B1 (en) * | 1999-05-12 | 2006-08-02 | Medtronic, Inc. | Monitoring apparatus using wavelet transforms for the analysis of heart rhythms |
| DE10159296A1 (en) | 2001-12-04 | 2003-06-12 | Arc Seibersdorf Res Gmbh Wien | Method for evaluation of ECG signals to detect heart beat irregularities, whereby the measured heart beat is compared with stored templates and a probability analysis undertaken to determine the risk of conditions such as PAF |
| US7430446B2 (en) * | 2005-01-20 | 2008-09-30 | Cardiac Pacemakers, Inc. | Methods and apparatuses for cardiac arrhythmia classification using morphology stability |
| US7474916B2 (en) * | 2005-04-28 | 2009-01-06 | Medtronic, Inc. | Method and apparatus for discriminating ventricular and supraventricular tachyarrhythmias |
| EP1995685A3 (en) | 2007-05-21 | 2012-08-01 | Biotronik CRM Patent AG | Medical device for monitoring biological signal |
-
2008
- 2008-09-11 AT AT08164155T patent/ATE503417T1/en not_active IP Right Cessation
- 2008-09-11 EP EP08164155A patent/EP2103253B1/en active Active
- 2008-09-11 DE DE602008005841T patent/DE602008005841D1/en active Active
- 2008-09-15 US US12/210,381 patent/US8082028B2/en not_active Expired - Fee Related
-
2009
- 2009-02-10 EP EP09001816A patent/EP2103254B1/en not_active Not-in-force
Patent Citations (4)
| Publication number | Priority date | Publication date | Assignee | Title |
|---|---|---|---|---|
| US6636764B1 (en) * | 2000-11-28 | 2003-10-21 | Pacesetter, Inc. | Safety backup in arrhythmia discrimination algorithm |
| US20060270937A1 (en) * | 2001-04-25 | 2006-11-30 | Koyrakh Lev A | Automated Template Generation Algorithm for Implantable Device |
| US20030181818A1 (en) * | 2002-03-25 | 2003-09-25 | Jaeho Kim | Method and system for characterizing a representative cardiac beat using multiple templates |
| EP1803485A2 (en) * | 2003-05-29 | 2007-07-04 | Cameron Health, Inc. | Method for discriminating between ventricular and supraventricular arrhythmias |
Non-Patent Citations (4)
| Title |
|---|
| CEBRIAN A ET AL: "Optimization of three morphologic algorithms for arrhythmia discrimination in implantable cardioverter defibrillators", COMPUTERS IN CARDIOLOGY, 2005 LYON, FRANCE SEPT. 25-28, 2005, PISCATAWAY, NJ, USA,IEEE, 25 September 2005 (2005-09-25), pages 187 - 190, XP010889803, ISBN: 978-0-7803-9337-0 * |
| SINHA ET AL.: "Clinical experience with a new detection algorithm for differentiation of supraventricular from ventricular tachycardia in a dual-chamber defibrillator", JCE, vol. 15, 2004, pages 646 - 652 |
| THEUNS ET AL.: "Initial clinical experience with a new arrhythmia detection algorithm in dual chamber implantable cardioverter defibrillators", EUROPACE, vol. 3, 2001, pages 181 - 186 |
| WILKINS J: "Correlation-based pattern recognition for implantable defibrillators.", PROCEEDINGS : A CONFERENCE OF THE AMERICAN MEDICAL INFORMATICS ASSOCIATION / ... AMIA ANNUAL FALL SYMPOSIUM. AMIA FALL SYMPOSIUM 1996, 1996, pages 289 - 293, XP002514472, ISSN: 1091-8280 * |
Cited By (3)
| Publication number | Priority date | Publication date | Assignee | Title |
|---|---|---|---|---|
| CN102835954A (en) * | 2012-09-07 | 2012-12-26 | 深圳市邦健电子有限公司 | Method for generating heart beating waveform template and treating ventricular premature beat detection and device |
| CN102835954B (en) * | 2012-09-07 | 2015-03-11 | 深圳邦健生物医疗设备股份有限公司 | Method for generating heart beating waveform template and treating ventricular premature beat detection and device |
| CN110251228A (en) * | 2014-01-29 | 2019-09-20 | 韦伯斯特生物官能(以色列)有限公司 | Dual bi-polar configuration for atrial fibrillation annotation |
Also Published As
| Publication number | Publication date |
|---|---|
| ATE503417T1 (en) | 2011-04-15 |
| EP2103254A1 (en) | 2009-09-23 |
| DE602008005841D1 (en) | 2011-05-12 |
| US8082028B2 (en) | 2011-12-20 |
| EP2103254B1 (en) | 2012-08-15 |
| EP2103253B1 (en) | 2011-03-30 |
| US20090240300A1 (en) | 2009-09-24 |
Similar Documents
| Publication | Publication Date | Title |
|---|---|---|
| EP2103253B1 (en) | Device and computer-readable storage medium for SVT and VT Classification | |
| US8090434B2 (en) | Device, method and computer-readable storage medium for enhanced sense event classification in implantable devices by means of morphology analysis | |
| US8244348B2 (en) | Method and apparatus for cardiac arrhythmia classification using template band-based morphology analysis | |
| US8145301B2 (en) | Blending cardiac rhythm detection processes | |
| US8409107B2 (en) | Tachyarrhythmia detection and discrimination based on curvature parameters | |
| US6490478B1 (en) | System and method for complexity analysis-based cardiac tachyarrhythmia detection | |
| US20180000410A1 (en) | Methods and devices for accurately classifying cardiac activity | |
| US7908001B2 (en) | Automatic multi-level therapy based on morphologic organization of an arrhythmia | |
| US9314210B2 (en) | Method and apparatus for rate-dependent morphology-based cardiac arrhythmia classification | |
| US8260409B2 (en) | Self-adjusting ECG morphological feature correlation threshold | |
| US8521276B2 (en) | Use of significant point methodology to prevent inappropriate therapy | |
| US20120004567A1 (en) | Rhythm correlation diagnostic measurement | |
| US20070142736A1 (en) | Discriminating polymorphic and monomorphic cardiac rhythms using template generation | |
| US8812094B2 (en) | Cardioverter/defibrillator and signal processing device for classifying intracardiac signals | |
| US10213125B2 (en) | Atrial arrhythmia episode detection in a cardiac medical device | |
| EP2157910B1 (en) | Systems for tachyarrhythmia discrimination | |
| US10004418B2 (en) | Atrial arrhythmia episode detection in a cardiac medical device | |
| US20160213273A1 (en) | Atrial arrhythmia episode detection in a cardiac medical device | |
| US8204581B2 (en) | Method to discriminate arrhythmias in cardiac rhythm management devices | |
| Rieta et al. | Fibrillatory waves automatic delineation in atrial fibrillation surface recordings based on mathematical morphology |
Legal Events
| Date | Code | Title | Description |
|---|---|---|---|
| PUAI | Public reference made under article 153(3) epc to a published international application that has entered the european phase |
Free format text: ORIGINAL CODE: 0009012 |
|
| 17P | Request for examination filed |
Effective date: 20090515 |
|
| AK | Designated contracting states |
Kind code of ref document: A1 Designated state(s): AT BE BG CH CY CZ DE DK EE ES FI FR GB GR HR HU IE IS IT LI LT LU LV MC MT NL NO PL PT RO SE SI SK TR |
|
| AX | Request for extension of the european patent |
Extension state: AL BA MK RS |
|
| AKX | Designation fees paid |
Designated state(s): AT BE BG CH CY CZ DE DK EE ES FI FR GB GR HR HU IE IS IT LI LT LU LV MC MT NL NO PL PT RO SE SI SK TR |
|
| GRAP | Despatch of communication of intention to grant a patent |
Free format text: ORIGINAL CODE: EPIDOSNIGR1 |
|
| GRAJ | Information related to disapproval of communication of intention to grant by the applicant or resumption of examination proceedings by the epo deleted |
Free format text: ORIGINAL CODE: EPIDOSDIGR1 |
|
| GRAP | Despatch of communication of intention to grant a patent |
Free format text: ORIGINAL CODE: EPIDOSNIGR1 |
|
| RTI1 | Title (correction) |
Free format text: DEVICE AND COMPUTER-READABLE STORAGE MEDIUM FOR SVT AND VT CLASSIFICATION |
|
| GRAS | Grant fee paid |
Free format text: ORIGINAL CODE: EPIDOSNIGR3 |
|
| GRAA | (expected) grant |
Free format text: ORIGINAL CODE: 0009210 |
|
| AK | Designated contracting states |
Kind code of ref document: B1 Designated state(s): AT BE BG CH CY CZ DE DK EE ES FI FR GB GR HR HU IE IS IT LI LT LU LV MC MT NL NO PL PT RO SE SI SK TR |
|
| REG | Reference to a national code |
Ref country code: GB Ref legal event code: FG4D |
|
| REG | Reference to a national code |
Ref country code: CH Ref legal event code: EP |
|
| REG | Reference to a national code |
Ref country code: IE Ref legal event code: FG4D |
|
| REF | Corresponds to: |
Ref document number: 602008005841 Country of ref document: DE Date of ref document: 20110512 Kind code of ref document: P |
|
| REG | Reference to a national code |
Ref country code: DE Ref legal event code: R096 Ref document number: 602008005841 Country of ref document: DE Effective date: 20110512 |
|
| REG | Reference to a national code |
Ref country code: SE Ref legal event code: TRGR |
|
| REG | Reference to a national code |
Ref country code: NL Ref legal event code: VDEP Effective date: 20110330 |
|
| PG25 | Lapsed in a contracting state [announced via postgrant information from national office to epo] |
Ref country code: LT Free format text: LAPSE BECAUSE OF FAILURE TO SUBMIT A TRANSLATION OF THE DESCRIPTION OR TO PAY THE FEE WITHIN THE PRESCRIBED TIME-LIMIT Effective date: 20110330 Ref country code: HR Free format text: LAPSE BECAUSE OF FAILURE TO SUBMIT A TRANSLATION OF THE DESCRIPTION OR TO PAY THE FEE WITHIN THE PRESCRIBED TIME-LIMIT Effective date: 20110330 Ref country code: LV Free format text: LAPSE BECAUSE OF FAILURE TO SUBMIT A TRANSLATION OF THE DESCRIPTION OR TO PAY THE FEE WITHIN THE PRESCRIBED TIME-LIMIT Effective date: 20110330 Ref country code: GR Free format text: LAPSE BECAUSE OF FAILURE TO SUBMIT A TRANSLATION OF THE DESCRIPTION OR TO PAY THE FEE WITHIN THE PRESCRIBED TIME-LIMIT Effective date: 20110701 |
|
| LTIE | Lt: invalidation of european patent or patent extension |
Effective date: 20110330 |
|
| PG25 | Lapsed in a contracting state [announced via postgrant information from national office to epo] |
Ref country code: AT Free format text: LAPSE BECAUSE OF FAILURE TO SUBMIT A TRANSLATION OF THE DESCRIPTION OR TO PAY THE FEE WITHIN THE PRESCRIBED TIME-LIMIT Effective date: 20110330 Ref country code: SI Free format text: LAPSE BECAUSE OF FAILURE TO SUBMIT A TRANSLATION OF THE DESCRIPTION OR TO PAY THE FEE WITHIN THE PRESCRIBED TIME-LIMIT Effective date: 20110330 Ref country code: FI Free format text: LAPSE BECAUSE OF FAILURE TO SUBMIT A TRANSLATION OF THE DESCRIPTION OR TO PAY THE FEE WITHIN THE PRESCRIBED TIME-LIMIT Effective date: 20110330 Ref country code: CY Free format text: LAPSE BECAUSE OF FAILURE TO SUBMIT A TRANSLATION OF THE DESCRIPTION OR TO PAY THE FEE WITHIN THE PRESCRIBED TIME-LIMIT Effective date: 20110330 Ref country code: NO Free format text: LAPSE BECAUSE OF FAILURE TO SUBMIT A TRANSLATION OF THE DESCRIPTION OR TO PAY THE FEE WITHIN THE PRESCRIBED TIME-LIMIT Effective date: 20110630 |
|
| PG25 | Lapsed in a contracting state [announced via postgrant information from national office to epo] |
Ref country code: BE Free format text: LAPSE BECAUSE OF FAILURE TO SUBMIT A TRANSLATION OF THE DESCRIPTION OR TO PAY THE FEE WITHIN THE PRESCRIBED TIME-LIMIT Effective date: 20110330 |
|
| PG25 | Lapsed in a contracting state [announced via postgrant information from national office to epo] |
Ref country code: EE Free format text: LAPSE BECAUSE OF FAILURE TO SUBMIT A TRANSLATION OF THE DESCRIPTION OR TO PAY THE FEE WITHIN THE PRESCRIBED TIME-LIMIT Effective date: 20110330 Ref country code: PT Free format text: LAPSE BECAUSE OF FAILURE TO SUBMIT A TRANSLATION OF THE DESCRIPTION OR TO PAY THE FEE WITHIN THE PRESCRIBED TIME-LIMIT Effective date: 20110801 |
|
| PG25 | Lapsed in a contracting state [announced via postgrant information from national office to epo] |
Ref country code: RO Free format text: LAPSE BECAUSE OF FAILURE TO SUBMIT A TRANSLATION OF THE DESCRIPTION OR TO PAY THE FEE WITHIN THE PRESCRIBED TIME-LIMIT Effective date: 20110330 Ref country code: ES Free format text: LAPSE BECAUSE OF FAILURE TO SUBMIT A TRANSLATION OF THE DESCRIPTION OR TO PAY THE FEE WITHIN THE PRESCRIBED TIME-LIMIT Effective date: 20110711 Ref country code: IS Free format text: LAPSE BECAUSE OF FAILURE TO SUBMIT A TRANSLATION OF THE DESCRIPTION OR TO PAY THE FEE WITHIN THE PRESCRIBED TIME-LIMIT Effective date: 20110730 Ref country code: SK Free format text: LAPSE BECAUSE OF FAILURE TO SUBMIT A TRANSLATION OF THE DESCRIPTION OR TO PAY THE FEE WITHIN THE PRESCRIBED TIME-LIMIT Effective date: 20110330 Ref country code: CZ Free format text: LAPSE BECAUSE OF FAILURE TO SUBMIT A TRANSLATION OF THE DESCRIPTION OR TO PAY THE FEE WITHIN THE PRESCRIBED TIME-LIMIT Effective date: 20110330 |
|
| PG25 | Lapsed in a contracting state [announced via postgrant information from national office to epo] |
Ref country code: NL Free format text: LAPSE BECAUSE OF FAILURE TO SUBMIT A TRANSLATION OF THE DESCRIPTION OR TO PAY THE FEE WITHIN THE PRESCRIBED TIME-LIMIT Effective date: 20110330 |
|
| PLBE | No opposition filed within time limit |
Free format text: ORIGINAL CODE: 0009261 |
|
| STAA | Information on the status of an ep patent application or granted ep patent |
Free format text: STATUS: NO OPPOSITION FILED WITHIN TIME LIMIT |
|
| PG25 | Lapsed in a contracting state [announced via postgrant information from national office to epo] |
Ref country code: PL Free format text: LAPSE BECAUSE OF FAILURE TO SUBMIT A TRANSLATION OF THE DESCRIPTION OR TO PAY THE FEE WITHIN THE PRESCRIBED TIME-LIMIT Effective date: 20110330 Ref country code: DK Free format text: LAPSE BECAUSE OF FAILURE TO SUBMIT A TRANSLATION OF THE DESCRIPTION OR TO PAY THE FEE WITHIN THE PRESCRIBED TIME-LIMIT Effective date: 20110330 |
|
| 26N | No opposition filed |
Effective date: 20120102 |
|
| REG | Reference to a national code |
Ref country code: DE Ref legal event code: R097 Ref document number: 602008005841 Country of ref document: DE Effective date: 20120102 |
|
| PG25 | Lapsed in a contracting state [announced via postgrant information from national office to epo] |
Ref country code: MC Free format text: LAPSE BECAUSE OF NON-PAYMENT OF DUE FEES Effective date: 20110930 |
|
| PG25 | Lapsed in a contracting state [announced via postgrant information from national office to epo] |
Ref country code: IT Free format text: LAPSE BECAUSE OF FAILURE TO SUBMIT A TRANSLATION OF THE DESCRIPTION OR TO PAY THE FEE WITHIN THE PRESCRIBED TIME-LIMIT Effective date: 20110330 |
|
| PGFP | Annual fee paid to national office [announced via postgrant information from national office to epo] |
Ref country code: GB Payment date: 20120920 Year of fee payment: 5 Ref country code: SE Payment date: 20120920 Year of fee payment: 5 |
|
| PG25 | Lapsed in a contracting state [announced via postgrant information from national office to epo] |
Ref country code: MT Free format text: LAPSE BECAUSE OF FAILURE TO SUBMIT A TRANSLATION OF THE DESCRIPTION OR TO PAY THE FEE WITHIN THE PRESCRIBED TIME-LIMIT Effective date: 20110330 |
|
| PG25 | Lapsed in a contracting state [announced via postgrant information from national office to epo] |
Ref country code: LU Free format text: LAPSE BECAUSE OF NON-PAYMENT OF DUE FEES Effective date: 20110911 |
|
| PG25 | Lapsed in a contracting state [announced via postgrant information from national office to epo] |
Ref country code: BG Free format text: LAPSE BECAUSE OF FAILURE TO SUBMIT A TRANSLATION OF THE DESCRIPTION OR TO PAY THE FEE WITHIN THE PRESCRIBED TIME-LIMIT Effective date: 20110630 |
|
| PG25 | Lapsed in a contracting state [announced via postgrant information from national office to epo] |
Ref country code: TR Free format text: LAPSE BECAUSE OF FAILURE TO SUBMIT A TRANSLATION OF THE DESCRIPTION OR TO PAY THE FEE WITHIN THE PRESCRIBED TIME-LIMIT Effective date: 20110330 |
|
| PG25 | Lapsed in a contracting state [announced via postgrant information from national office to epo] |
Ref country code: HU Free format text: LAPSE BECAUSE OF FAILURE TO SUBMIT A TRANSLATION OF THE DESCRIPTION OR TO PAY THE FEE WITHIN THE PRESCRIBED TIME-LIMIT Effective date: 20110330 |
|
| REG | Reference to a national code |
Ref country code: SE Ref legal event code: EUG |
|
| PG25 | Lapsed in a contracting state [announced via postgrant information from national office to epo] |
Ref country code: SE Free format text: LAPSE BECAUSE OF NON-PAYMENT OF DUE FEES Effective date: 20130912 |
|
| GBPC | Gb: european patent ceased through non-payment of renewal fee |
Effective date: 20130911 |
|
| PG25 | Lapsed in a contracting state [announced via postgrant information from national office to epo] |
Ref country code: GB Free format text: LAPSE BECAUSE OF NON-PAYMENT OF DUE FEES Effective date: 20130911 |
|
| REG | Reference to a national code |
Ref country code: DE Ref country code: DE Ref legal event code: R082 Ref document number: 602008005841 Country of ref document: DE Representative=s name: RANDOLL, SOEREN, DIPL.-CHEM. UNIV. DR. RER. NA, DE |
|
| REG | Reference to a national code |
Ref country code: FR Ref legal event code: PLFP Year of fee payment: 9 |
|
| REG | Reference to a national code |
Ref country code: FR Ref legal event code: PLFP Year of fee payment: 10 |
|
| REG | Reference to a national code |
Ref country code: DE Ref legal event code: R082 Ref document number: 602008005841 Country of ref document: DE Ref country code: DE Ref legal event code: R081 Ref document number: 602008005841 Country of ref document: DE Owner name: BIOTRONIK SE & CO. KG, DE Free format text: FORMER OWNER: BIOTRONIK CRM PATENT AG, BAAR, CH |
|
| REG | Reference to a national code |
Ref country code: FR Ref legal event code: PLFP Year of fee payment: 11 |
|
| REG | Reference to a national code |
Ref country code: FR Ref legal event code: TP Owner name: BIOTRONIK SE & CO. KG, DE Effective date: 20180907 |
|
| REG | Reference to a national code |
Ref country code: DE Ref legal event code: R079 Ref document number: 602008005841 Country of ref document: DE Free format text: PREVIOUS MAIN CLASS: A61B0005045200 Ipc: A61B0005349000 |
|
| PGFP | Annual fee paid to national office [announced via postgrant information from national office to epo] |
Ref country code: IE Payment date: 20220919 Year of fee payment: 15 Ref country code: DE Payment date: 20220926 Year of fee payment: 15 |
|
| PGFP | Annual fee paid to national office [announced via postgrant information from national office to epo] |
Ref country code: FR Payment date: 20220921 Year of fee payment: 15 |
|
| PGFP | Annual fee paid to national office [announced via postgrant information from national office to epo] |
Ref country code: CH Payment date: 20220928 Year of fee payment: 15 |