EP2722720A1 - Estimation of process control parameters over predefined travel segments - Google Patents
Estimation of process control parameters over predefined travel segments Download PDFInfo
- Publication number
- EP2722720A1 EP2722720A1 EP14151305.1A EP14151305A EP2722720A1 EP 2722720 A1 EP2722720 A1 EP 2722720A1 EP 14151305 A EP14151305 A EP 14151305A EP 2722720 A1 EP2722720 A1 EP 2722720A1
- Authority
- EP
- European Patent Office
- Prior art keywords
- segment
- data
- process control
- specific
- parameter
- Prior art date
- Legal status (The legal status is an assumption and is not a legal conclusion. Google has not performed a legal analysis and makes no representation as to the accuracy of the status listed.)
- Granted
Links
- 238000004886 process control Methods 0.000 title claims abstract description 116
- 238000000034 method Methods 0.000 claims abstract description 125
- 238000007619 statistical method Methods 0.000 claims abstract description 25
- 230000004044 response Effects 0.000 claims abstract description 20
- 238000000638 solvent extraction Methods 0.000 claims abstract description 9
- 238000004590 computer program Methods 0.000 claims description 12
- 230000008569 process Effects 0.000 description 52
- 238000005259 measurement Methods 0.000 description 33
- 230000000875 corresponding effect Effects 0.000 description 27
- 230000002829 reductive effect Effects 0.000 description 16
- 238000013459 approach Methods 0.000 description 9
- 230000008859 change Effects 0.000 description 9
- 239000012530 fluid Substances 0.000 description 6
- 238000004458 analytical method Methods 0.000 description 5
- 238000004422 calculation algorithm Methods 0.000 description 5
- 238000010219 correlation analysis Methods 0.000 description 4
- 230000007423 decrease Effects 0.000 description 4
- 238000012423 maintenance Methods 0.000 description 4
- 230000002085 persistent effect Effects 0.000 description 4
- 238000012545 processing Methods 0.000 description 4
- 238000004891 communication Methods 0.000 description 3
- 230000001276 controlling effect Effects 0.000 description 3
- 230000007246 mechanism Effects 0.000 description 3
- 238000004540 process dynamic Methods 0.000 description 3
- 238000003860 storage Methods 0.000 description 3
- 238000012360 testing method Methods 0.000 description 3
- 230000001594 aberrant effect Effects 0.000 description 2
- 230000001351 cycling effect Effects 0.000 description 2
- 238000013461 design Methods 0.000 description 2
- 238000010586 diagram Methods 0.000 description 2
- 230000000694 effects Effects 0.000 description 2
- 230000006870 function Effects 0.000 description 2
- 230000036541 health Effects 0.000 description 2
- 238000007689 inspection Methods 0.000 description 2
- 238000012544 monitoring process Methods 0.000 description 2
- 238000012856 packing Methods 0.000 description 2
- 238000005192 partition Methods 0.000 description 2
- 230000000007 visual effect Effects 0.000 description 2
- 238000012935 Averaging Methods 0.000 description 1
- 230000005355 Hall effect Effects 0.000 description 1
- 230000009471 action Effects 0.000 description 1
- 238000007792 addition Methods 0.000 description 1
- 238000003491 array Methods 0.000 description 1
- 230000009286 beneficial effect Effects 0.000 description 1
- 238000004364 calculation method Methods 0.000 description 1
- 239000003990 capacitor Substances 0.000 description 1
- 238000012777 commercial manufacturing Methods 0.000 description 1
- 230000002596 correlated effect Effects 0.000 description 1
- 230000007812 deficiency Effects 0.000 description 1
- 230000000593 degrading effect Effects 0.000 description 1
- 238000012217 deletion Methods 0.000 description 1
- 230000037430 deletion Effects 0.000 description 1
- 238000001514 detection method Methods 0.000 description 1
- 230000006866 deterioration Effects 0.000 description 1
- 230000007717 exclusion Effects 0.000 description 1
- 230000002452 interceptive effect Effects 0.000 description 1
- 230000000670 limiting effect Effects 0.000 description 1
- 230000010355 oscillation Effects 0.000 description 1
- 230000036961 partial effect Effects 0.000 description 1
- 230000000737 periodic effect Effects 0.000 description 1
- 230000002093 peripheral effect Effects 0.000 description 1
- 230000002035 prolonged effect Effects 0.000 description 1
- 238000007670 refining Methods 0.000 description 1
- 230000008439 repair process Effects 0.000 description 1
- 238000012552 review Methods 0.000 description 1
- 239000000565 sealant Substances 0.000 description 1
- 230000003068 static effect Effects 0.000 description 1
- 230000003442 weekly effect Effects 0.000 description 1
Images


Classifications
-
- G—PHYSICS
- G05—CONTROLLING; REGULATING
- G05B—CONTROL OR REGULATING SYSTEMS IN GENERAL; FUNCTIONAL ELEMENTS OF SUCH SYSTEMS; MONITORING OR TESTING ARRANGEMENTS FOR SUCH SYSTEMS OR ELEMENTS
- G05B23/00—Testing or monitoring of control systems or parts thereof
- G05B23/02—Electric testing or monitoring
- G05B23/0205—Electric testing or monitoring by means of a monitoring system capable of detecting and responding to faults
- G05B23/0218—Electric testing or monitoring by means of a monitoring system capable of detecting and responding to faults characterised by the fault detection method dealing with either existing or incipient faults
- G05B23/0224—Process history based detection method, e.g. whereby history implies the availability of large amounts of data
- G05B23/0227—Qualitative history assessment, whereby the type of data acted upon, e.g. waveforms, images or patterns, is not relevant, e.g. rule based assessment; if-then decisions
- G05B23/0235—Qualitative history assessment, whereby the type of data acted upon, e.g. waveforms, images or patterns, is not relevant, e.g. rule based assessment; if-then decisions based on a comparison with predetermined threshold or range, e.g. "classical methods", carried out during normal operation; threshold adaptation or choice; when or how to compare with the threshold
-
- F—MECHANICAL ENGINEERING; LIGHTING; HEATING; WEAPONS; BLASTING
- F16—ENGINEERING ELEMENTS AND UNITS; GENERAL MEASURES FOR PRODUCING AND MAINTAINING EFFECTIVE FUNCTIONING OF MACHINES OR INSTALLATIONS; THERMAL INSULATION IN GENERAL
- F16K—VALVES; TAPS; COCKS; ACTUATING-FLOATS; DEVICES FOR VENTING OR AERATING
- F16K37/00—Special means in or on valves or other cut-off apparatus for indicating or recording operation thereof, or for enabling an alarm to be given
- F16K37/0075—For recording or indicating the functioning of a valve in combination with test equipment
- F16K37/0083—For recording or indicating the functioning of a valve in combination with test equipment by measuring valve parameters
-
- F—MECHANICAL ENGINEERING; LIGHTING; HEATING; WEAPONS; BLASTING
- F16—ENGINEERING ELEMENTS AND UNITS; GENERAL MEASURES FOR PRODUCING AND MAINTAINING EFFECTIVE FUNCTIONING OF MACHINES OR INSTALLATIONS; THERMAL INSULATION IN GENERAL
- F16K—VALVES; TAPS; COCKS; ACTUATING-FLOATS; DEVICES FOR VENTING OR AERATING
- F16K37/00—Special means in or on valves or other cut-off apparatus for indicating or recording operation thereof, or for enabling an alarm to be given
- F16K37/0075—For recording or indicating the functioning of a valve in combination with test equipment
- F16K37/0091—For recording or indicating the functioning of a valve in combination with test equipment by measuring fluid parameters
-
- G—PHYSICS
- G05—CONTROLLING; REGULATING
- G05B—CONTROL OR REGULATING SYSTEMS IN GENERAL; FUNCTIONAL ELEMENTS OF SUCH SYSTEMS; MONITORING OR TESTING ARRANGEMENTS FOR SUCH SYSTEMS OR ELEMENTS
- G05B2219/00—Program-control systems
- G05B2219/20—Pc systems
- G05B2219/24—Pc safety
- G05B2219/24077—Module detects wear, changes of controlled device, statistical evaluation
Definitions
- the present invention relates generally to process control networks and, more particularly, to a method of statistically determining an estimate of a process control loop parameter over a predetermined segment of travel or operation.
- Each set of such process control devices, valves, and sensor devices form what is generally referred to as a process control loop.
- each valve or other device may, in turn, include an inner loop wherein, for example, a valve positioner controls a valve actuator to move a control element, such as a valve plug, in response to a control signal and obtains feedback from a sensor, such as a position sensor, to control movement of the valve plug.
- This inner loop is sometimes called a servo loop.
- control element of a process control device may move in response to changing fluid pressure on a spring biased diaphragm or in response to the rotation of a shaft, each of which may be caused by a change in the command signal.
- a command signal with a magnitude varying in the range of 4 to 20 mA (milliamperes) causes a positioner to alter the amount of fluid and thus, the fluid pressure, within a pressure chamber in proportion to the magnitude of the command signal.
- Changing fluid pressure in the pressure chamber causes a diaphragm to move against a bias spring which, in turn, causes movement of a valve plug.
- Process control devices usually develop or produce a feedback signal, indicative of the response of the device to the command signal, and provide this feedback signal (or response indication) to the process control system or to the valve actuator for use in controlling the process or the valve.
- valve mechanisms typically produce a feedback signal indicative of the position (e.g., travel) of a valve plug, the pressure within a fluid chamber of the valve or the value of some other phenomena related to the actual position of the valve plug.
- problems associated with one or more of the individual process control devices cannot be tuned out of the control loop by the process control system and, as a result, the poorly performing control loops are placed in manual or are detuned to the point where they are effectively in manual control.
- plant personnel can track down individual loops that are cycling and will detune the associated controller or place the faulty loop into manual. If the system settles down, they know that it is a tuning problem, not a hardware problem.
- fast dynamics such as a flow loop
- operators will correlate the controller output with the process variable. If the output of the controller is a triangle wave and the process variable is a square wave, they will often conclude that the control valve is sticking.
- the first procedure requires the operator to put the system into manual control, which may not be allowed, especially on runaway processes.
- the second procedure is good for identifying limit cycles induced by the process control loop but is not capable of tracking down instabilities in the servo loop.
- correlation between a command signal and a process variable is not always straightforward due to complications such as integrating process dynamics, nonlinear process dynamics, cross-coupled process dynamics, and process disturbances.
- Instabilities in the servo loop can be particularly difficult to discern because plant personnel do not have access to the internal state variables of a control valve. Additional problems arise when instabilities are influenced by the process fluid, as is the case with negative gradients. In these situations, a valve can oscillate when in service, but becomes well behaved when it is taken off line.
- Poor control loop performance can usually be overcome by monitoring the operational condition or the "health" of each of the process control devices connected within the loop, or at least the most critical process control devices connected within the loop, and repairing or replacing the poorly performing process control devices.
- the health of a process control device can be determined by measuring one or more parameters associated with the process control device and determining if the one or more parameters is outside of an acceptable range.
- One of the problems that may be monitored is the detection of instabilities in a process loop or a control device.
- U.S. Patent No. 5,687,098 to Grumstrup et al. discloses a system that collects device data and constructs and displays the response characteristic of the device.
- U.S. Patent No. 5,966,679 to Latcher et al. entitled "Method of and Apparatus for Nonobtrusively Obtaining On-Line Measurements of a Process Control Device Parameter” discloses a system that collects device data on-line and uses this data to directly calculate certain device parameters, such as dead band, dead time, etc. The entire disclosure of the '679 patent is hereby expressly incorporated by reference herein.
- the '893 patent discloses a method of statistically determining estimates of one or more process loop parameters, such as friction, dead band, dead time, oscillation, shaft windup or backlash of a process control device.
- the method involves collecting signal data related to an output parameter and to an input parameter, storing the signal data as a series of discrete points, eliminating some of the points in the series according to a predefmed algorithm, and performing a statistical analysis of the reduced series to obtain an average value of one or more process control parameters.
- the method allows estimating average actuator friction for a sliding stem valve, for example.
- the method discussed in the U.S. Patent No. 6,466,893 is limited to determining an average value of a process control parameter over an entire range covered by the available data.
- the method can yield an overall value of friction associated with a complete range of motion of a moveable element.
- high friction in a particular section may indicate that the valve is "sticking" and responding poorly to the control signal or unable to provide proper shutoff.
- low friction may indicate that the valve packing, which may used as a sealant between the stem and a wall of the valve, is degrading.
- the segments where friction significantly deviates from the norm or from the neighboring sections may require maintenance, replacement or, at the very least, close inspection.
- the average friction value effectively masks aberrant friction values of the potentially problematic sections. Understandably, if travel covers a range substantially wider than a problem region, the average value may filter out the unusually high or low values. Thus, the average value may simply fail to reflect that one or more segments is faulty.
- this value alone cannot point to the specific segment of travel or range of operation that may require attention. For example, based on an unsatisfactory average value of friction of a sliding stem valve, one may decide that an entire component of the valve (or even the entire valve) may need to be replaced. Meanwhile, it may be desirable in many cases to know the precise or relatively precise location of the problem. This information may help to conduct a partial repair or, at least, to collect statistical data related to failures in order to determine which components are least reliable and possibly improve the design of these components in the future.
- a method of estimating a process control parameter of a device over a segment of travel of a moveable component of the device allows an operator or engineer to determine whether the moveable part operates improperly in one or more sections within the full range of operation of the moveable part.
- the method obtains measurements of a signal inside a process control loop, stores the measured signal as signal data, partitions the signal data into several sections corresponding to various segments of travel or operation, and performs an analysis on some or all of the sections of the signal data to determine parameter estimates for one or more segments.
- the sections of data correspond to non-overlapping segments of equal size to facilitate visual and statistical comparison between segments.
- the signal data may be partitioned into segments according to a specified percentage of travel, to a desired number of segments, or to a predefined amount of data contained in an individual segment.
- the method unobtrusively measures a signal within the process control loop while the process control loop is connected on-line within a process environment.
- the method can be applied in real time as data is collected from a process control loop. Additionally or alternatively, the method can be applied to offline data.
- the parameter estimate corresponding to each segment is rendered graphically on a display.
- software running on a device inside or outside the process control loop automatically processes parameter estimates for some or all of the segments and detects aberrant parameter values.
- the method may be implemented within a software package for configuring, monitoring, and displaying parameters related to valve operation, such as AMS ValveLink® from Fisher Controls International LLC of Marshalltown, Iowa.
- the method may be implemented on a device collecting on-line process control data.
- the method may be applied to signal data stored offline. The method may also include comparing historical data for the same segment in order to measure the trend over time of a selected process parameter.
- a certain parameter may be estimated for one or more selected segments at predefined intervals, such as once per week, for example.
- the weekly estimates may be rendered on a single graph or processed automatically to detect a change in value over time.
- the method may utilize statistical techniques such as calculating the standard deviation, mean and average values for the entire range of travel, and other parameters useful in comparing individual segments of travel to other segments or the entire range of travel.
- the parameter estimate may be an estimate of the friction of a device (such as a valve or other device) having an actuator (which may be any moveable part of the device) that moves in response to actuator pressure.
- the method measures a first signal indicative of actuator pressure, measures a second signal indicative of actuator position and then stores a series of data points, each data point having an actuator pressure component derived from the actuator pressure signal and an actuator position component derived from the actuator position signal. For each segment, the method may create a reduced data set from the corresponding section of the series of data points and determine the friction estimate from the reduced data set.
- each of the series of data points in the section is analyzed to determine if the data point is outside of a friction zone of the device and is placed within the reduced data set if the point is outside of the friction zone.
- the difference between the actuator position components of two data points may be compared to a threshold, the difference between the actuator pressure components of two data points may be compared to a threshold or the slope at a data point may be compared to a slope threshold.
- the reduced data set may be detrended to remove linear trends, the actuator pressure components of the detrended data set may be histogrammed and a pressure difference based on the results of the histogram may be used to determine the friction estimate.
- the parameter estimate may also be a dead band estimate which can be determined from the friction estimate for a particular segment and the open loop gain associated with the process control loop.
- the parameter estimate may be a dead time estimate which can be developed by performing a cross-correlation analysis or a sum squared error analysis on the stored signal data for a particular segment and selecting a time delay associated with the cross-correlation analysis or the sum squared error analysis as the dead time estimate.
- the parameter estimate may also be a segment-specific shaft windup estimate of a device that has an actuator.
- the stored signal may be an indication of the actuator position and the shaft windup estimate for each segment may be determined by identifying a plurality of consecutive data points that lie within a shaft windup span at a particular position, computing the shaft windup based on a difference between the actuator position of the end points of the plurality of consecutive data points, and repeating the procedure at the next position within the same segment of travel, and calculating the shaft windup value for a particular segment by averaging shaft windup measurements for all positions within the segment.
- the plurality of consecutive data points that lie within a shaft windup span may be also determined by computing the slope at each of the consecutive data points and comparing the computed slope to a slope threshold.
- a single-input, single-output process control loop 10 is illustrated as including a process control system 12 that sends, for example, a 4 to 20 mA command signal to a process control device 13 such as a control valve assembly.
- the process control device 13 is illustrated as including a current-to-pressure transducer (I/P) 14 that (typically) sends a 3 to 15 psig pressure signal to a valve pneumatic stage 15 such as a pneumatic positioner and actuator or a pneumatic relay and/or an actuator which, in turn, pneumatically controls a valve 18 with a pressure signal (air).
- I/P current-to-pressure transducer
- Operation of the valve 18 controls the articulation of a movable valve member disposed therein (not shown) which, in turn, controls a process variable within a process 20.
- a transmitter 22 measures the process variable of the process 20 and transmits an indication of the measured process variable to a summing junction 24.
- the summing junction 24 compares the measured value of the process variable (converted into a normalized percentage) to a set point to produce an error signal indicative of the difference therebetween.
- the summing junction 24 then provides the calculated error signal to the process control system 12.
- the set point which may be generated by a user, an operator or another controller is typically normalized to be between 0 and 100 percent and indicates the desired value of the process variable.
- the process control system 12 uses the error signal to generate the command signal according to any desired technique and delivers the command signal to the process control device 13 to thereby effect control of the process variable.
- process control device 13 is illustrated as including a separate I/P unit 14, pneumatic stage 15 and valve 18, the process control device 13 may include any other type of valve mechanisms or elements instead of or in addition to those illustrated in Fig. 1 including, for example, an electro-pneumatic positioner having an I/P unit integrated therein. Additionally, an electro-pneumatic positioner may also integrate an array of one or more sensors, and/or a memory, and/or a parameter estimation unit therein. Furthermore, it should be understood that the process control device 13 may be any other type of device (besides a valve controlling device) that controls a process variable in any other desired or known manner. The process control device 13 may be, for example, a damper, etc.
- a parameter estimation unit 30 is coupled to the process control device 13 or to any other part of the process control loop 10 using known sensors.
- the parameter estimation unit 30, which may be a computer such as a microcomputer having a memory and a processor therein, collects data pertaining to the condition of the devices within the process control loop 10 and statistically determines from the collected data one or more process control loop parameters, such as friction, dead time, dead band, etc. using, for example, a computer program or algorithm. For example, as illustrated in Fig.
- the measurement unit 30 may detect one or more of the command signal delivered to the I/P unit 14 using a current sensor 32, the pressure output from the I/P unit 14 using a pressure sensor 34, the actuator command signal output by the pneumatic stage 15 using a pressure sensor 36, and the valve position at the output of the valve 18 using a position sensor 37.
- the estimation unit 30 may also or alternatively detect the set point signal, the error signal at the output of the summing junction 24, the process variable, the output of the transmitter 22 or any other signal or phenomena that causes or indicates movement or operation of the process control device 13 or process control loop 10. It should also be noted that other types of process control devices may have other signals or phenomena associated therewith that may be used by the parameter estimation unit 30.
- the parameter estimation unit 30 may also read an indication of the controller command signal, the pressure signal, the actuator command signal, or the valve position if the process control device 13 is configured to communicate those measurements. Likewise, the estimation unit 30 may detect signals generated by other sensors already within the process control device 13, such as the valve position indicated by the position sensor 37.
- the sensors used by the estimation unit 30 can be any known sensors and may be either analog or digital sensors.
- the position sensor 37 may be any desired motion or position measuring device including, for example, a potentiometer, a linear variable differential transformer (LVDT), a rotary variable differential transformer (RVDT), a Hall effect motion sensor, a magneto resistive motion sensor, a variable capacitor motion sensor, etc.
- the estimation unit 30 may include one or more analog-to-digital converters which samples the analog signal and stores the sampled signal in a memory within the estimation unit 30. However, if the sensors are digital sensors, they may supply digital signals directly to the estimation unit 30 which may then store those signals in memory in any desired manner. Moreover, if two or more signals are being collected, the estimation unit 30 may store these signals as components of data points associated with any particular time. For example, each data point at time T 1 , T 2 , ...T n may have an input command signal component, a pressure signal component, an actuator travel signal component, etc. Of course, these data points or components thereof may be stored in memory in any desired or known manner.
- estimation unit 30 has been indicated as being separate from the process control device 13 (such as, for example, being located in a host device), this unit can instead be internal to the process control device 13 or any other process control device (e.g., field device) in a process control network. If the process control device 13 is a micro-processor based device, the estimation unit 30 can share the same processor and memory as that already within the process control device 13. Alternatively, the estimation unit 30 may have its own processor and memory.
- the statistical analysis may be performed in the device in which the measurements are made (such as in any field device) with the results being sent to a user display or to a host device for use or, alternatively, the signal measurements may be made by a device (such as a field device) with such measurements then being sent to a remote location (such as a host device) where the statistical analysis is performed.
- the parameter estimation device 30 determines the friction, dead band, dead time or other process control loop parameter of one or more segments of travel of the process control device 13 (or other device within the process control loop 10) using a statistical analysis based on measurements taken while the process control device 13 is operating on-line within a process environment.
- the estimation unit 30 samples one or more signals within, for example, the process control device 13 and stores the sampled data in memory 44. If desired, the estimation unit 30 may manipulate the data to eliminate unneeded data, outliers, etc. either before or after storing the collected data in memory.
- the estimation unit 30 uses a statistical analysis routine, which may be stored in the memory 44 associated with the estimation unit 30 and implemented on a microprocessor within the estimation unit 30, to calculate an estimate of the process parameter for each of the segments.
- a statistical analysis routine which may be stored in the memory 44 associated with the estimation unit 30 and implemented on a microprocessor within the estimation unit 30, to calculate an estimate of the process parameter for each of the segments.
- the estimation unit 30 may use any desired statistical analysis routine or procedure.
- the estimation unit 30 may display the estimates on a display device 38 which may be, for example, a CRT screen, a printer, a voice generator, an alarm, or any other desired communication device. Of course, the estimation unit 30 may alert the user to the values of the estimates in any other desired manner.
- a user input unit 40 may be connected to the estimation unit 30 in a wired or wireless manner.
- the user input unit 40 may be a full or a limited keyboard, a pointing device such as mouse, or any other means of entering data known in the art.
- an operator or a technician may specify such parameters as the number of segments of travel, the size of a segment, the time interval for periodic signal capture, and the duration of a period during which signal data is collected by the parameter estimation unit 30.
- an operator, a technician, or an otherwise authorized user may use a computer workstation 42 to enter one or more parameters listed above (number of segments, segment size, etc).
- the computer workstation may be connected to the parameter estimation 30 and may include an inputting means such as a keyboard and a display. It will be appreciated that the analysis of the data and other work related to processing data collected from the sensors 32-37, sensor 22, as well from process 20 may be carried out by the parameter estimation unit 30 in cooperation with the workstation 42, or by one of the parameter estimation unit 30 or the workstation 42.
- the estimation unit 30 does not require the process control device 13 to be taken off-line or out of the normal operating environment.
- the estimation unit 30 because the estimation unit 30 is connected to the process control loop 10 and measures the signals necessary to make the statistical estimation of certain process parameters during normal operation of the process control loop 10, the estimation unit 30 determines the process control device parameters continuously without interfering with the operation of the process 20 or the process control loop 10.
- the estimation unit 30 may estimate segment-specific process parameters by processing online data in post-time, or even by processing offline data.
- the estimation unit 30 may process data corresponding to the measurements of one or several parameters of the control loop 10 collected over a period of time and stored in a memory.
- some of the embodiments of the estimation unit 30 may include additional interface with such peripheral devices as a CD/DVD drive, for example, in order to enable the estimation unit 30 to efficiently access offline data. Further, the estimation unit 30 may cooperate with a persistent storage device such as the memory unit 44. Because some of the contemplated embodiments of the estimation unit 30 may include little or no internal memory, the memory unit 44 may store real time and/or historical data related to the operation of the control loop 10.
- the parameter estimation unit 30 may reside inside a computer host such as a stationary or portable workstation which, in turn, may be disposed inside or outside the single-output process control loop 10.
- the parameter estimation unit 30 may be a software application stored in a memory of a workstation receiving measurement data from the transmitter 22 and at least some of the sensors 32-37 via any suitable communication means, including those known in the art. More specifically, some or all of the transmitter 22 and the sensors 32-37 may report measurements related to the operation of the process control loop 10 via a digital bus, a wireless link, or a combination thereof.
- the parameter estimation unit 30 may include both software and hardware components such as dedicated processors or memory, for example.
- the parameter estimation unit 30 may be a software application distributed over several hardware components.
- parameter estimation unit 30 may be programmed or configured to determine any desired process or device parameter using any desired statistical analysis, particularly useful statistical approaches for determining a friction estimate, a dead band estimate, a dead time estimate, and a shaft windup estimate are described in detail herein.
- the present invention is not limited to the use of any of these approaches and, furthermore, is not limited to the determination of segment-specific estimates for only these specific parameters; it being understood that other statistical approaches can by used to determine these or other device or process parameters according to the present invention.
- One approach to determining a friction estimate for a process control device, such as a sliding stem valve or a rotary valve, is to have the estimation unit 30 collect data pertaining to the actuator travel or position (sensed by, for example, the position sensor 37 of Fig. 1 ) and the actuator pressure (sensed by, for example, the pressure senor 34 or 36 of Fig. 1 ) for the valve over a particular time period.
- the collected data will be stored in memory as a series of data points, wherein each data point has an actuator pressure component derived from the measured actuator pressure signal and an actuator position component derived from the measured actuator position or travel signal.
- each data point has an actuator pressure component derived from the measured actuator pressure signal and an actuator position component derived from the measured actuator position or travel signal.
- the actuator pressure and actuator position components of any data point should relate to the same time.
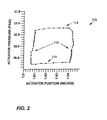
- Fig. 2 illustrates a plot 100 of actuator pressure versus actuator position for a typical sliding stem valve.
- each point of the plot 100 corresponds to a concurrent measurement of actuator pressure and actuator position.
- the plot 100 corresponds to a single cycle of operation during which the actuator operates through a friction zone.
- the moveable element of the valve operates through a friction zone in which the applied pressure increases or decreases a significant amount with little or no resulting movement of the moveable valve element.
- This friction zone which is caused by friction within the valve, is generally indicated by the more vertical lines 110 in Fig. 2 .
- the moveable valve member Upon exiting the friction zone, the moveable valve member then moves a significant amount with relatively little change in the applied pressure.
- actuator pressure and actuator position can be plotted separately versus time. By aligning the two resulting plots along the same timeline, the plots can be simultaneously analyzed to detect the amount of pressure required to enable the movement of the actuator.
- exemplary plots discussed herein are presented by way of illustration only.
- a single cycle of operation generally fails to provide sufficient indication of how well a sliding stem valve operates.
- the location of the friction zone of a valve depends upon the position of the moveable valve element with respect to the operating range of the element.
- a plot 120 represents the operation of the moveable valve element through 80% of the range of operation during a plurality of cycles.
- the plot 120 includes multiple vertical lines, each corresponding to a friction zone for a particular cycle of operation.
- the more horizontal lines of the plot 120 correspond to those regions of travel where the stem moves due to a relatively small change in pressure.
- the known methods of estimating process variables fail to indicate that the sliding stem of this valve does not encounter the same force of friction at different segments. For example, estimating the average friction for the entire 0% to 80% range of travel illustrated in Fig. 3 effectively filters out the difference between the friction in the 0-10% range of travel and the friction in the 10%-20% range. In other words, estimating the average friction value based on the data illustrated in Fig. 3 by the known means can only produce a single value. This single value fails to reflect the existence of one or more localized problems, much less the location of these problems within the available range of travel.
- the exemplary plot 120 includes the regions 121-128.
- the 0%-80% range of travel is divided into eight non-overlapping segments of equal size.
- some of the possible embodiments may involve regions having different sizes.
- certain ranges of travel may be associated with a higher probability of failure.
- operators or manufacturers may observe, based on either theoretical or empirical data, that a certain sliding stem valve is more likely to break in the 40-50% range of travel after a prolonged use. The operator may then decide to define segments in such a way that the 40-50% range of travel has more segments than all other ranges.
- the operator may partition the 40-50% range of travel in 5 separate regions while defining only 1 region for the 30-40% range of travel.
- the operator may define at least partially overlapping segments to improve the reliability of certain statistical inferences, for example.
- the range of travel may include overlapping segments, segments of variable size, or both.
- Fig. 4 illustrates a plot 150 of actuator pressure versus actuator position for a typical rotary valve.
- the moveable element of a rotary valve operates, upon a reversal of direction, through a friction zone in which the applied pressure increases or decreases a significant amount with little or no resulting movement of the moveable valve element.
- the plot of actuator pressure versus radial position of the actuator includes several substantially vertical lines. These lines correspond to friction zones in which there is little or no movement of the actuator in response to a change in pressure applied to the actuator.
- the data points associated with the entire available range of motion are processed to estimate the average friction.
- the rotary valve may encounter friction in the range between 10 and 12 degrees, illustrated as region 152 in Fig. 4 , which is significantly different from friction encountered in the range between 14 and 16 degrees, for example.
- each of the regions 152-158 may have a friction value significantly different from the average friction value associated with the plot 150.
- the friction in the region 152 may be too low while the friction in the region 156 may be too high.
- the average friction of the rotary valve, as obtained from the plot 150 viewed as a single undivided set of data may be equal or acceptably close to a value indicative of a healthy status of the valve.
- the parameter estimation unit 30 may separately calculate such parameters as friction, dead band, shaft windup, etc. for some or all of the segments 121-128 or 152-158.
- an authorized user may configure the parameter estimation unit 30 with the number of segments associated with the available range of travel.
- the user may specify the size and the boundaries of each segment.
- the user may also specify whether one or more segments to which the calculation should be restricted. However, it is expected that most operators would generally prefer to process the entire available set of data to reduce the probability of inadvertently overlooking a segment or sub-range of the travel in which a problem has developed.
- the parameter estimation unit 30 may iteratively step through the data corresponding to each of segments 121-128 or 152-158 to detect each segment-specific value of friction, dead band, dead time, shaft windup, etc. Referring again to the data points forming the plots 100 and 120, the more vertical sections of the plots represent regions of little or no actuator movement in response to a substantial change in actuator pressure. Thus, for the given segment of travel, the data points within the friction zone are discarded to thereby leave data generally corresponding to that which borders or to that which is outside the friction zone.
- the approach for selecting the reduced data set differs slightly depending upon whether the valve is a sliding stem valve or a rotary valve. For a sliding stem valve, the sliding stem is typically stationary within the friction zone.
- the reduced data set may be formed by including only those points at which actuator movement is actually occurring.
- a point may be included in this set, for example, if the difference between the actuator position of the point and the actuator position of the previous point exceeds a predetermined threshold. For example, when the difference between the actuator position of consecutive points exceeds 0.01% of full travel, the second point may be selected as a point within the reduced data set (i.e., wherein the actuator is actually moving).
- a predetermined threshold For example, when the difference between the actuator position of consecutive points exceeds 0.01% of full travel, the second point may be selected as a point within the reduced data set (i.e., wherein the actuator is actually moving).
- any other desired threshold may apply and any other method of determining actuator movement may be used instead to generate the reduced data set.
- the data that outlines or borders the friction zone may be determined by evaluating one or more conditions.
- the slope of the actuator pressure versus actuator position may be computed at each point and then compared to a threshold.
- the slope at a point may be computed by determining the point-to-point slope at a given point (i.e., the slope of a line drawn between the point in question and the previous or next point), by taking the slope of a best fit line (such as a line developed using a least squared error analysis) determined from the point in question and two or more surrounding points, or in any other desired manner. If the computed slope at a point is less than the threshold, then the point may be chosen for the reduced data set because that point is outside of the friction zone.
- the slope threshold may be predetermined or predefined (e.g., by an operator) or may be defined as a function of the slope of a best fit line (e.g., a least squared error line) through all of the collected data.
- the change in pressure between consecutive points may be calculated and, if the pressure change is greater than a predetermined threshold of, for example, 0.05%, then the point is considered to be within the friction zone.
- a predetermined threshold for example, 0.05%
- one or both of these conditions may be used to determine if a point is within the friction zone or not.
- the point may be considered to be within the friction zone and discarded.
- a point may be considered to be within the friction zone only when both the slope and the pressure threshold are exceeded.
- either one or both of these approaches may be used with sliding stem valves.
- the remaining data points typically fall within one of two clusters bordering the friction zone of the valve device.
- it is beneficial to detrend the data that is, remove any linear trends caused by, for example, the actuator spring force (which varies over the range of the actuator movement).
- detrending the data There are many approaches to estimating the best fit line to the data for detrending the data. For example, one approach is to calculate the best fit line through all of the data within the reduced data set. In other cases, it may be preferable to fit a separate line to the data on each side of the friction zone, i.e., use a separate line fit routine for each of the clusters.
- One of ordinary skill in the art will further appreciate that various alternative methods of reducing data sets, detrending data, calculating the best fit line, as well as other statistical techniques may be used to analyze the data.
- the parameter estimation unit 30 may estimate the segment-specific value of a process parameter. For example, the estimation unit 30 may obtain the friction of a sliding stem valve in the 20%-30% range of travel by applying the method disclosed in the U.S. Patent No. 6,466,893 , or by applying any other method to the complete or reduced data set. The estimation unit 30 may then transmit the results of calculating one or segment-specific estimates to the display 38 or to any other output device.
- Fig. 5 illustrates a histogram 200 which includes bars 201-208. Each of the bars 201-208 corresponds to one of the segments 151-158 of the plot 150 illustrated in Fig. 3 .
- each bar may represent the value of friction associated with one of the travel segments.
- the histogram 200 visually communicates segment-specific friction of the segments 151 to 158 in a clear, easy-to-understand manner. By quickly looking over the histogram 200, the operator may immediately suspect that the valve 18 may be sticking in the segment 204 or that the packing of the valve 18 may have degraded in regions 201-203 and 208. The operator may then physically inspect the valve, compare each of the potentially faulty segments to a predefined value, or take other suitable action to confirm or disprove the suspicion.
- the display unit 38 may display the plot 120 along with the histogram 200 in order for the operator to visually confirm the preliminary results he or she reaches by noticing a particularly high or low histogram bar.
- the operator or engineer may wish to confirm that the histogram bar 204 in fact corresponds to that portion of the plot 150 where the clusters of data points forming the more horizontal sections of the graph are spaced farther apart than in the other segments.
- the plot 150 illustrates the complete data set prior to exclusion of the more points associated with friction zones and prior to detrending the set.
- the operator may nevertheless recognize that the clusters of points that appear stretched in a vertical dimension tend to indicate higher values of friction (when the axis of ordinates is selected for pressure and the abscissa is selected for travel).
- the estimation unit 30 stores threshold values associated with some or all of the friction, dead band, dead time, or shaft windup.
- the estimation unit 30 stores a low threshold value and a high threshold value to detect both excessive and insufficient values of these process parameters.
- the estimation unit 30 may store a high threshold friction value of 1100 lb f and a low threshold friction value of 300 lb f .
- the estimation unit 30 may identify each of the histogram bars 201-208 having a height outside the 300-1100 lb f range. By analyzing the example histogram 200 illustrated in Fig. 5 , the estimation unit 30 may thus determine that the regions corresponding to the bars 201, 202, 204, and 207 have unacceptable friction values. In response to detecting one or more such values, the estimation unit 30 may trigger an alarm, create an entry in an even log, initiate a message to the operator, or perform a similar operation.
- the estimation unit 30 may additionally calculate the overall average associated with the range of travel including all segments 121-128 of a sliding stem valve and the segments 152-158 of a rotary valve. It is contemplated in some applications, it may be desirable to identify which sections of travel of a moveable part, if any, differ from the overall average by a certain number of standard deviations, for example. To this end, the estimation unit 30 may obtain the average friction value for the relevant range of travel, compare the friction of each individual segment to the average friction value to calculate the standard deviation, and identify those segments which significantly differ both from the average and from the rest of the segments. This approach may be useful in investigating the wear and tear characteristics of a device, for example.
- the display unit 38 may render the highest and lowest histogram in a color different from the rest of the histogram 200. In this manner, the display unit 38 may direct the operator's attention to the relevant (i.e., potentially problematic) sections of the histogram. Thus, an operator responsible for a large number of control loops 10, valves 18, or other devices having moveable components, may quickly notice the potential problems even when paying relatively little attention to a console monitor.
- the estimation unit 30, the display unit 38, and other components may also provide other visual or audio means of attracting human attention to values significantly deviating from a predefined norm or from the average associated with a particular device.
- Fig. 6 illustrates two plots of the actuator pressure versus actuator travel for movement of a rotary valve in one complete cycle through the friction zone.
- the plot 230 includes data points corresponding to approximately 10.2 to 10.7 degrees of travel of a particular rotary valve.
- the plot 250 illustrates the movement of the same valve between approximately 11.2 and 11.7 degrees of travel.
- shaft windup is the movement of the valve element which occurs before the actuator pressure reaches a maximum (or minimum) value which causes continued movement of the valve element.
- the plots 230 and 250 form different geometric shapes. Specifically, the plot 250 includes a steeper slope of the section in which the shaft windup occurs. Thus, an operator may recognize that the shape which appears more stretched out in the horizontal dimension corresponds to a greater windup value.
- the estimation unit 30 preferably collects or otherwise obtains data for multiple cycles of operation.
- the estimation unit 30 may compute the shaft windup at any particular occurrence and then estimate the shaft windup associated with a particular segment of travel as the average or median of all shaft windup occurrences within this segment. To determine the shaft windup in any particular instance, the estimation unit 30 may monitor the slope of the actuator pressure versus the actuator travel curve. Shaft windup generally starts where the magnitude of the slope increases significantly (or becomes greater than a certain amount) and ends where the magnitude of the slope decreases significantly (or becomes less than a certain amount). As will be understood, the actuator travel movement (typically expressed as a percent of full travel) between the start and end points is the shaft windup for the particular occurrence.
- the display unit 38, the computer workstation 42, or other unit having a display may represent the results graphically, as in a histogram 270, for example ( Fig. 7 ).
- Each of the bars 272-278 may correspond to a certain amount of travel. In the example illustrated in Fig. 7 , the bar 276 appears significantly lower that the bars 272, 274, and 278.
- an operator may immediately determine that, at the very least, shaft windup of the rotary valve is not the same for each section of travel. The operator may then manually check whether the bar 272 points to an unacceptably low windup in the section of travel between 14 and 16 degrees, or whether the bars 272, 274, and 278 indicate excessively high windup values.
- the method may be applied to dead time and dead band estimates for sliding stem valve, a rotary valve, or other device having a component which moves through a predefined range of travel.
- the estimation unit 30 may calculate the dead band associated with a particular section of travel by assuming that the dead band is mostly caused by friction and dividing the friction estimate for the segment by the open loop gain of the device. Segment-specific estimates of the dead band of the device may be similarly displayed in form of a histogram, automatically compared to one or more thresholds, and/or statistically processed to determine the average value and the standard deviation. Further, the estimate unit 30 may trigger an alarm for one or more segments significantly deviating either from the predefined values or from the calculated average.
- the estimation unit 30 may generate segment-specific dead time estimates for the valve 18 or other moveable component of a device operating in the control loop 10. To this end, the estimation unit 30 may perform cross-correlation analysis of the input signal (such as that produced by the controller 12 and measured by the current sensor 32 of Fig. 1 ) and the actuator travel or position signal (such as that measured by the position sensor 37 of Fig. 1 ). The estimation unit 30 may perform this or other type of statistical correlation analysis for a given segment travel of travel to determine a time shift between the output and the input signals.
- the estimation unit 30 may also generate trend data for one or more of these parameters. More specifically, the estimation unit 30 may store measurements related to one or more of friction, shaft windup, dead time, and dead band over a substantially long period of time (days, months, years, etc.). In some contemplated embodiments, the estimation unit 30 includes or cooperates with a persistent memory such as the memory unit 44. Upon obtaining a segment-specific measurement, the estimation unit 30 may store the measurement along with a timestamp in the persistent memory. Alternatively, the estimation unit 30 may periodically generate and store "snapshots" of some or all of the calculated segment-specific process parameters. Preferably, the estimation unit 30 stores friction and other parameters for each segment of travel to enable trending of multiple segments over time.
- the estimation unit 30 may then plot trend data for one or more segments in response to receiving a request from the operator via the input unit 40, for example.
- the estimation unit 30 may plot trend data upon timer expiration and according to some predefined schedule. It will be appreciated that average data for a particular segment may yield such non-obvious information about the valve actuator or some other moveable part as, for example, the average rate of deterioration over a predefined period, unexpectedly low or high changes over a period of time, etc. Additionally, trend data for several segments may be used to identify one or segments which may deteriorate at a faster rate than the rest of the segments or a predefined target rate. Referring to Fig.
- the plot 300 illustrates the measurements of friction for two segments of actuator travel trended over a six month period.
- the symbol 302 marks average measurements corresponding to a segment of travel between 30% and 40%
- the symbol 304 represents average measurements of the 20% to 30% travel for a certain sliding stem valve.
- the example plot 300 illustrates a faster loss of friction in the 30%-40% segment of travel.
- the initial measurement of friction for this segment appears to be significantly higher than the friction of the 20%-30% segment of travel.
- the friction of this segment drops from approximately 1900 lb f in January to about 500 lb f in July, whereas the decrease in friction associated with the 20%-30% segment of travel drops from about 1500 lb f to about 700 lb f .
- an operator or engineer may conclude, for example, that the wear of the moveable component (or of the static component interacting with the moveable component) is more pronounced in the 30%- 40% segment of travel.
- engineers may apply this data to improve the future design of the device or of the moveable components used in the device.
- trend data collected and plotted for a single segment of travel may also yield important information, such as an approximate measurement of the rate at which a parameter of a device changes over time.
- the estimation unit 30 may calculate the best fit line (not shown) for all measurements marked with the symbol 302 in Fig. 8 .
- the slope of the best fit line will yield an estimate of the rate of loss of friction associated with the 30%- 40% segment of travel.
- the estimation unit 30 may also apply other statistical methods to trend data associated with an individual segment to determine the rate of change and other characteristics of the corresponding trend.
- Fig. 9 illustrates a block diagram of a software routine 330 that may be executed on the estimation unit 30 to estimate friction for each of several travel segments of a valve actuator.
- the software routine 330 may also run on a workstation 42, on a computer communicatively coupled to the control loop 10, or on a standalone computer or other intelligent device capable of receiving process measurement data via a memory drive, a wired or wireless modem, or via any other communication or storage means known in the art.
- the software routine 330 may also be a part of a software package responsible for other control and maintenance functions of the control loop 10 or of the valve 18.
- the AMS ValveLink® software package may include the software routine 330 as a component. It will be further appreciated that the software routine 330 may process data arriving from the control loop 10 in substantially real time or, alternatively, may perform post-time processing of data received from the sensors 32-37 and stored in the memory unit 44, for example. Moreover, the software routine 330 may interact with an external storage device during operation to obtain measurement data.
- the software routine 330 may retrieve actuator pressure and position data from an array or a linked list.
- the estimation unit 30 or the memory unit 44 may store this data in a two dimensional array indexed by a relative or absolute time counter.
- the array may store a plurality of tuples, each tuple including a measurement of actuator pressure and actuator position collected at the same point in time.
- the software routine 330 may step through the array and update a corresponding segment-specific friction estimate with the information stored in the current array element.
- the software routine 330 may initialize an array counter, k, at a block 332. Next, the software routine may iterate through some or all of the blocks 334-348 as many times as the number of elements in the array storing the pressure in position data.
- the routine 330 may check whether the current value of the counter k has exceeded the size of the array.
- the routine 330 may read the pressure/position tuple from a single or multiple arrays in a block or step 336.
- actuator position data is stored in an array travel and actuator pressure data is stored in a similarly indexed array differential_pressure.
- both pressure and actuator data could also be stored in a single two-dimensional array.
- each tuple retrieved in the step 336 corresponds to the actuator position and actuator pressure measured after a constant interval relative to the previous tuple retrieved in the step 336.
- the estimation unit 30 preferably samples position and pressure data at a constant rate.
- the routine 330 initializes the segment counter s to 0.
- the procedure 300 then steps through the segments to determine to which segment the array element indexed by the current value of k belongs (blocks 340-344).
- each segment includes the same number of pressure/position tuples.
- the routine 330 may retrieve the definition of segments, including the number of segments and/or boundaries of each segment, from a persistent or volatile memory as part of configuration data.
- the routine 330 may receive the definition of segments as input parameters. A user may enter these parameters via the input device 40 or workstation 42.
- routine 330 may update the average segment-specific friction value with the data included in the tuple (block 346).
- the procedure 330 may apply of the methods discussed above in reference to Figs. 2-5 , for example.
- the routine 330 may then increment the value of k in a block 348 and return to the block 334 for the next iteration.
- the routine 330 exits (blocks 350 and 352).
- estimation unit 30 may calculate segment-specific values for dead band, dead time, and shaft windup by executing logic similar to the routine 330. To this end, the estimation unit 30 may include additional routines or may include the logic for estimating the dead band, dead time, and shaft windup as part of the routine 330.
Abstract
Description
- The present invention relates generally to process control networks and, more particularly, to a method of statistically determining an estimate of a process control loop parameter over a predetermined segment of travel or operation.
- Large scale commercial manufacturing and refining processes typically use a process controller system to control the operation of one or more process control devices such as valves, based on feedback from one or more sensors, such as position, flow, temperature or other types of sensors. Each set of such process control devices, valves, and sensor devices form what is generally referred to as a process control loop. Furthermore, each valve or other device may, in turn, include an inner loop wherein, for example, a valve positioner controls a valve actuator to move a control element, such as a valve plug, in response to a control signal and obtains feedback from a sensor, such as a position sensor, to control movement of the valve plug. This inner loop is sometimes called a servo loop. In any event, the control element of a process control device may move in response to changing fluid pressure on a spring biased diaphragm or in response to the rotation of a shaft, each of which may be caused by a change in the command signal. In one standard valve mechanism, a command signal with a magnitude varying in the range of 4 to 20 mA (milliamperes) causes a positioner to alter the amount of fluid and thus, the fluid pressure, within a pressure chamber in proportion to the magnitude of the command signal. Changing fluid pressure in the pressure chamber causes a diaphragm to move against a bias spring which, in turn, causes movement of a valve plug.
- Process control devices usually develop or produce a feedback signal, indicative of the response of the device to the command signal, and provide this feedback signal (or response indication) to the process control system or to the valve actuator for use in controlling the process or the valve. For example, valve mechanisms typically produce a feedback signal indicative of the position (e.g., travel) of a valve plug, the pressure within a fluid chamber of the valve or the value of some other phenomena related to the actual position of the valve plug.
- While a process control system generally uses these feedback signals, along with other signals, as inputs to a highly tuned, centralized control algorithm that effects overall control of a process, it has been discovered that poor control loop performance may still be caused by poor operating conditions of the individual control devices connected within the control loop including, for example, instabilities within the process control loop. A system experiences "instability" when it cannot reach an equilibrium point during operation. Plant personnel often refer to these instabilities as cycling, hunting, or swinging which is in contrast with normal operation in which the system reaches an equilibrium point or "lines-out."
- In many cases, problems associated with one or more of the individual process control devices cannot be tuned out of the control loop by the process control system and, as a result, the poorly performing control loops are placed in manual or are detuned to the point where they are effectively in manual control. In some cases, plant personnel can track down individual loops that are cycling and will detune the associated controller or place the faulty loop into manual. If the system settles down, they know that it is a tuning problem, not a hardware problem. In a similar fashion, if the process has well known, fast dynamics (such as a flow loop), operators will correlate the controller output with the process variable. If the output of the controller is a triangle wave and the process variable is a square wave, they will often conclude that the control valve is sticking. These ad-hoc procedures are used by many plant operators, but include several limitations. For example, the first procedure requires the operator to put the system into manual control, which may not be allowed, especially on runaway processes. The second procedure is good for identifying limit cycles induced by the process control loop but is not capable of tracking down instabilities in the servo loop. Moreover, correlation between a command signal and a process variable is not always straightforward due to complications such as integrating process dynamics, nonlinear process dynamics, cross-coupled process dynamics, and process disturbances. Instabilities in the servo loop can be particularly difficult to discern because plant personnel do not have access to the internal state variables of a control valve. Additional problems arise when instabilities are influenced by the process fluid, as is the case with negative gradients. In these situations, a valve can oscillate when in service, but becomes well behaved when it is taken off line.
- Poor control loop performance can usually be overcome by monitoring the operational condition or the "health" of each of the process control devices connected within the loop, or at least the most critical process control devices connected within the loop, and repairing or replacing the poorly performing process control devices. The health of a process control device can be determined by measuring one or more parameters associated with the process control device and determining if the one or more parameters is outside of an acceptable range. One of the problems that may be monitored is the detection of instabilities in a process loop or a control device.
- In the past, it was not easy to determine the source or cause of an instability within a process control loop without having a technician review and diagnose the system, which could be time consuming and costly. In some cases these persons had to remove a process control device from a control loop to bench test the device or, alternatively, the control loops themselves were provided with bypass valves and redundant process control devices to make it possible to bypass a particular process control device to thereby test a device while the process is operating. Alternatively, operators have had to wait until a process is halted or is undergoing a scheduled shut-down to test the individual process control devices within the process which might be the source of instability. Each of these options is time consuming, expensive, and only provides intermittent determination of instabilities in a system. Still further, none of these methods is particularly suited to determine the source or cause of instability while the process is operating on-line, i.e., without disturbing or shutting the process down.
- There have been some attempts to collect data from a process control device on-line and to obtain an indication of characteristics of a device therefrom. For example,
U.S. Patent No. 5,687,098 to Grumstrup et al. discloses a system that collects device data and constructs and displays the response characteristic of the device. Likewise,U.S. Patent No. 5,966,679 to Latwesen et al. entitled "Method of and Apparatus for Nonobtrusively Obtaining On-Line Measurements of a Process Control Device Parameter" discloses a system that collects device data on-line and uses this data to directly calculate certain device parameters, such as dead band, dead time, etc. The entire disclosure of the '679 patent is hereby expressly incorporated by reference herein. - Additionally, the entire disclosure of the
U.S. Patent No. 6,466,893 , entitled "Statistical Determination of Estimates of Process Control Loop Parameters," is also hereby expressly incorporated by reference herein. The '893 patent discloses a method of statistically determining estimates of one or more process loop parameters, such as friction, dead band, dead time, oscillation, shaft windup or backlash of a process control device. In particular, the method involves collecting signal data related to an output parameter and to an input parameter, storing the signal data as a series of discrete points, eliminating some of the points in the series according to a predefmed algorithm, and performing a statistical analysis of the reduced series to obtain an average value of one or more process control parameters. The method allows estimating average actuator friction for a sliding stem valve, for example. - However, the method discussed in the
U.S. Patent No. 6,466,893 is limited to determining an average value of a process control parameter over an entire range covered by the available data. For example, the method can yield an overall value of friction associated with a complete range of motion of a moveable element. Meanwhile, there may be a section, a sub-range, or segment of travel where friction is significantly higher or lower than in the other sections. As one of ordinary skill in the art will recognize, high friction in a particular section may indicate that the valve is "sticking" and responding poorly to the control signal or unable to provide proper shutoff. On the other hand, low friction may indicate that the valve packing, which may used as a sealant between the stem and a wall of the valve, is degrading. In either case, the segments where friction significantly deviates from the norm or from the neighboring sections may require maintenance, replacement or, at the very least, close inspection. Unfortunately, the average friction value effectively masks aberrant friction values of the potentially problematic sections. Understandably, if travel covers a range substantially wider than a problem region, the average value may filter out the unusually high or low values. Thus, the average value may simply fail to reflect that one or more segments is faulty. - Moreover, even when the average value properly indicates that a problem exists, this value alone cannot point to the specific segment of travel or range of operation that may require attention. For example, based on an unsatisfactory average value of friction of a sliding stem valve, one may decide that an entire component of the valve (or even the entire valve) may need to be replaced. Meanwhile, it may be desirable in many cases to know the precise or relatively precise location of the problem. This information may help to conduct a partial repair or, at least, to collect statistical data related to failures in order to determine which components are least reliable and possibly improve the design of these components in the future.
- A method of estimating a process control parameter of a device over a segment of travel of a moveable component of the device allows an operator or engineer to determine whether the moveable part operates improperly in one or more sections within the full range of operation of the moveable part. In particular, the method obtains measurements of a signal inside a process control loop, stores the measured signal as signal data, partitions the signal data into several sections corresponding to various segments of travel or operation, and performs an analysis on some or all of the sections of the signal data to determine parameter estimates for one or more segments. In one aspect, the sections of data correspond to non-overlapping segments of equal size to facilitate visual and statistical comparison between segments. In another aspect, the signal data may be partitioned into segments according to a specified percentage of travel, to a desired number of segments, or to a predefined amount of data contained in an individual segment.
- In one embodiment, the method unobtrusively measures a signal within the process control loop while the process control loop is connected on-line within a process environment. In at least some of the embodiments, the method can be applied in real time as data is collected from a process control loop. Additionally or alternatively, the method can be applied to offline data.
- In one embodiment, the parameter estimate corresponding to each segment is rendered graphically on a display. In another embodiment, software running on a device inside or outside the process control loop automatically processes parameter estimates for some or all of the segments and detects aberrant parameter values. In another aspect, the method may be implemented within a software package for configuring, monitoring, and displaying parameters related to valve operation, such as AMS ValveLink® from Fisher Controls International LLC of Marshalltown, Iowa. In another embodiment, the method may be implemented on a device collecting on-line process control data. In another aspect, the method may be applied to signal data stored offline. The method may also include comparing historical data for the same segment in order to measure the trend over time of a selected process parameter. In particular, a certain parameter may be estimated for one or more selected segments at predefined intervals, such as once per week, for example. In accordance with this embodiment, the weekly estimates may be rendered on a single graph or processed automatically to detect a change in value over time. In another aspect, the method may utilize statistical techniques such as calculating the standard deviation, mean and average values for the entire range of travel, and other parameters useful in comparing individual segments of travel to other segments or the entire range of travel.
- The parameter estimate may be an estimate of the friction of a device (such as a valve or other device) having an actuator (which may be any moveable part of the device) that moves in response to actuator pressure. In this case, the method measures a first signal indicative of actuator pressure, measures a second signal indicative of actuator position and then stores a series of data points, each data point having an actuator pressure component derived from the actuator pressure signal and an actuator position component derived from the actuator position signal. For each segment, the method may create a reduced data set from the corresponding section of the series of data points and determine the friction estimate from the reduced data set. To create the reduced data set, each of the series of data points in the section is analyzed to determine if the data point is outside of a friction zone of the device and is placed within the reduced data set if the point is outside of the friction zone. To determine if a data point is outside of the friction zone, the difference between the actuator position components of two data points may be compared to a threshold, the difference between the actuator pressure components of two data points may be compared to a threshold or the slope at a data point may be compared to a slope threshold. Thereafter, the reduced data set may be detrended to remove linear trends, the actuator pressure components of the detrended data set may be histogrammed and a pressure difference based on the results of the histogram may be used to determine the friction estimate.
- The parameter estimate may also be a dead band estimate which can be determined from the friction estimate for a particular segment and the open loop gain associated with the process control loop. Likewise, the parameter estimate may be a dead time estimate which can be developed by performing a cross-correlation analysis or a sum squared error analysis on the stored signal data for a particular segment and selecting a time delay associated with the cross-correlation analysis or the sum squared error analysis as the dead time estimate.
- The parameter estimate may also be a segment-specific shaft windup estimate of a device that has an actuator. In this case, the stored signal may be an indication of the actuator position and the shaft windup estimate for each segment may be determined by identifying a plurality of consecutive data points that lie within a shaft windup span at a particular position, computing the shaft windup based on a difference between the actuator position of the end points of the plurality of consecutive data points, and repeating the procedure at the next position within the same segment of travel, and calculating the shaft windup value for a particular segment by averaging shaft windup measurements for all positions within the segment. If desired, the plurality of consecutive data points that lie within a shaft windup span may be also determined by computing the slope at each of the consecutive data points and comparing the computed slope to a slope threshold.
-
-
Fig. 1 is a block diagram illustrating a process control loop including a device that statistically determines segment-specific estimates for one or more loop parameters according to the present invention. -
Fig. 2 illustrates a plot of actuator pressure versus actuator travel percentage for a typical sliding stem valve. -
Fig. 3 illustrates a plot corresponding to multiple measurements of actuator pressure versus actuator travel percentage for a typical sliding stem valve. -
Fig. 4 illustrates a plot corresponding to multiple measurements of actuator pressure versus actuator travel percentage for a typical rotary valve. -
Fig. 5 is a segment-based histogram representation of the data corresponding to the plot illustrated inFig. 3 . -
Fig. 6 illustrates plots of actuator pressure versus actuator position for two segments of travel of a typical rotary valve. -
Fig. 7 is a segment-based histogram representation of a data set which includes the subsets corresponding to the plots illustrated inFig. 4 . -
Fig. 8 is a graph illustrating trending of friction values measured for two distinct travel segments of a typical valve over a period of time. -
Fig. 9 is a flowchart illustrating one possible generalized algorithm of estimating segment-specific friction values. - Referring to
Fig. 1 , a single-input, single-outputprocess control loop 10 is illustrated as including aprocess control system 12 that sends, for example, a 4 to 20 mA command signal to aprocess control device 13 such as a control valve assembly. Theprocess control device 13 is illustrated as including a current-to-pressure transducer (I/P) 14 that (typically) sends a 3 to 15 psig pressure signal to a valvepneumatic stage 15 such as a pneumatic positioner and actuator or a pneumatic relay and/or an actuator which, in turn, pneumatically controls avalve 18 with a pressure signal (air). Operation of thevalve 18 controls the articulation of a movable valve member disposed therein (not shown) which, in turn, controls a process variable within aprocess 20. As is standard, atransmitter 22 measures the process variable of theprocess 20 and transmits an indication of the measured process variable to a summingjunction 24. The summingjunction 24 compares the measured value of the process variable (converted into a normalized percentage) to a set point to produce an error signal indicative of the difference therebetween. The summingjunction 24 then provides the calculated error signal to theprocess control system 12. The set point, which may be generated by a user, an operator or another controller is typically normalized to be between 0 and 100 percent and indicates the desired value of the process variable. Theprocess control system 12 uses the error signal to generate the command signal according to any desired technique and delivers the command signal to theprocess control device 13 to thereby effect control of the process variable. - While the
process control device 13 is illustrated as including a separate I/P unit 14,pneumatic stage 15 andvalve 18, theprocess control device 13 may include any other type of valve mechanisms or elements instead of or in addition to those illustrated inFig. 1 including, for example, an electro-pneumatic positioner having an I/P unit integrated therein. Additionally, an electro-pneumatic positioner may also integrate an array of one or more sensors, and/or a memory, and/or a parameter estimation unit therein. Furthermore, it should be understood that theprocess control device 13 may be any other type of device (besides a valve controlling device) that controls a process variable in any other desired or known manner. Theprocess control device 13 may be, for example, a damper, etc. - A
parameter estimation unit 30 is coupled to theprocess control device 13 or to any other part of theprocess control loop 10 using known sensors. Theparameter estimation unit 30, which may be a computer such as a microcomputer having a memory and a processor therein, collects data pertaining to the condition of the devices within theprocess control loop 10 and statistically determines from the collected data one or more process control loop parameters, such as friction, dead time, dead band, etc. using, for example, a computer program or algorithm. For example, as illustrated inFig. 1 , themeasurement unit 30 may detect one or more of the command signal delivered to the I/P unit 14 using acurrent sensor 32, the pressure output from the I/P unit 14 using apressure sensor 34, the actuator command signal output by thepneumatic stage 15 using apressure sensor 36, and the valve position at the output of thevalve 18 using aposition sensor 37. If desired, theestimation unit 30 may also or alternatively detect the set point signal, the error signal at the output of the summingjunction 24, the process variable, the output of thetransmitter 22 or any other signal or phenomena that causes or indicates movement or operation of theprocess control device 13 orprocess control loop 10. It should also be noted that other types of process control devices may have other signals or phenomena associated therewith that may be used by theparameter estimation unit 30. - As will be evident, the
parameter estimation unit 30 may also read an indication of the controller command signal, the pressure signal, the actuator command signal, or the valve position if theprocess control device 13 is configured to communicate those measurements. Likewise, theestimation unit 30 may detect signals generated by other sensors already within theprocess control device 13, such as the valve position indicated by theposition sensor 37. Of course, the sensors used by theestimation unit 30 can be any known sensors and may be either analog or digital sensors. For example, theposition sensor 37 may be any desired motion or position measuring device including, for example, a potentiometer, a linear variable differential transformer (LVDT), a rotary variable differential transformer (RVDT), a Hall effect motion sensor, a magneto resistive motion sensor, a variable capacitor motion sensor, etc. It will be understood that, if the sensors are analog sensors, theestimation unit 30 may include one or more analog-to-digital converters which samples the analog signal and stores the sampled signal in a memory within theestimation unit 30. However, if the sensors are digital sensors, they may supply digital signals directly to theestimation unit 30 which may then store those signals in memory in any desired manner. Moreover, if two or more signals are being collected, theestimation unit 30 may store these signals as components of data points associated with any particular time. For example, each data point at time T1, T2, ...Tn may have an input command signal component, a pressure signal component, an actuator travel signal component, etc. Of course, these data points or components thereof may be stored in memory in any desired or known manner. - Furthermore, while the
estimation unit 30 has been indicated as being separate from the process control device 13 (such as, for example, being located in a host device), this unit can instead be internal to theprocess control device 13 or any other process control device (e.g., field device) in a process control network. If theprocess control device 13 is a micro-processor based device, theestimation unit 30 can share the same processor and memory as that already within theprocess control device 13. Alternatively, theestimation unit 30 may have its own processor and memory. Thus, it is contemplated that the statistical analysis may be performed in the device in which the measurements are made (such as in any field device) with the results being sent to a user display or to a host device for use or, alternatively, the signal measurements may be made by a device (such as a field device) with such measurements then being sent to a remote location (such as a host device) where the statistical analysis is performed. - In one embodiment, the
parameter estimation device 30 determines the friction, dead band, dead time or other process control loop parameter of one or more segments of travel of the process control device 13 (or other device within the process control loop 10) using a statistical analysis based on measurements taken while theprocess control device 13 is operating on-line within a process environment. In general, to develop a parameter estimate, theestimation unit 30 samples one or more signals within, for example, theprocess control device 13 and stores the sampled data inmemory 44. If desired, theestimation unit 30 may manipulate the data to eliminate unneeded data, outliers, etc. either before or after storing the collected data in memory. After collecting enough data to be able to determine a statistical estimate of a desired process parameter for at least two segments of travel, theestimation unit 30 uses a statistical analysis routine, which may be stored in thememory 44 associated with theestimation unit 30 and implemented on a microprocessor within theestimation unit 30, to calculate an estimate of the process parameter for each of the segments. Of course, theestimation unit 30 may use any desired statistical analysis routine or procedure. Some example statistical analysis routines for certain parameters which may be implemented using an appropriately written computer program or algorithm stored within and implemented by theestimation unit 30 will be discussed in more detail herein. - After calculating a set of parameter estimates, the
estimation unit 30 may display the estimates on adisplay device 38 which may be, for example, a CRT screen, a printer, a voice generator, an alarm, or any other desired communication device. Of course, theestimation unit 30 may alert the user to the values of the estimates in any other desired manner. Auser input unit 40 may be connected to theestimation unit 30 in a wired or wireless manner. Theuser input unit 40 may be a full or a limited keyboard, a pointing device such as mouse, or any other means of entering data known in the art. By using theinput unit 40, an operator or a technician may specify such parameters as the number of segments of travel, the size of a segment, the time interval for periodic signal capture, and the duration of a period during which signal data is collected by theparameter estimation unit 30. - Additionally or optionally, an operator, a technician, or an otherwise authorized user may use a
computer workstation 42 to enter one or more parameters listed above (number of segments, segment size, etc). The computer workstation may be connected to theparameter estimation 30 and may include an inputting means such as a keyboard and a display. It will be appreciated that the analysis of the data and other work related to processing data collected from the sensors 32-37,sensor 22, as well fromprocess 20 may be carried out by theparameter estimation unit 30 in cooperation with theworkstation 42, or by one of theparameter estimation unit 30 or theworkstation 42. - In those embodiments where the
estimation unit 30 takes measurements of the required data while theprocess control device 13 is operating on-line, theestimation unit 30 does not require theprocess control device 13 to be taken off-line or out of the normal operating environment. In these embodiments, because theestimation unit 30 is connected to theprocess control loop 10 and measures the signals necessary to make the statistical estimation of certain process parameters during normal operation of theprocess control loop 10, theestimation unit 30 determines the process control device parameters continuously without interfering with the operation of theprocess 20 or theprocess control loop 10. Alternatively, theestimation unit 30 may estimate segment-specific process parameters by processing online data in post-time, or even by processing offline data. For example, theestimation unit 30 may process data corresponding to the measurements of one or several parameters of thecontrol loop 10 collected over a period of time and stored in a memory. To this end, some of the embodiments of theestimation unit 30 may include additional interface with such peripheral devices as a CD/DVD drive, for example, in order to enable theestimation unit 30 to efficiently access offline data. Further, theestimation unit 30 may cooperate with a persistent storage device such as thememory unit 44. Because some of the contemplated embodiments of theestimation unit 30 may include little or no internal memory, thememory unit 44 may store real time and/or historical data related to the operation of thecontrol loop 10. - In another embodiment, the
parameter estimation unit 30 may reside inside a computer host such as a stationary or portable workstation which, in turn, may be disposed inside or outside the single-outputprocess control loop 10. For example, theparameter estimation unit 30 may be a software application stored in a memory of a workstation receiving measurement data from thetransmitter 22 and at least some of the sensors 32-37 via any suitable communication means, including those known in the art. More specifically, some or all of thetransmitter 22 and the sensors 32-37 may report measurements related to the operation of theprocess control loop 10 via a digital bus, a wireless link, or a combination thereof. In some embodiments, theparameter estimation unit 30 may include both software and hardware components such as dedicated processors or memory, for example. In yet another embodiment, theparameter estimation unit 30 may be a software application distributed over several hardware components. - While the
parameter estimation unit 30 may be programmed or configured to determine any desired process or device parameter using any desired statistical analysis, particularly useful statistical approaches for determining a friction estimate, a dead band estimate, a dead time estimate, and a shaft windup estimate are described in detail herein. However, the present invention is not limited to the use of any of these approaches and, furthermore, is not limited to the determination of segment-specific estimates for only these specific parameters; it being understood that other statistical approaches can by used to determine these or other device or process parameters according to the present invention. - One approach to determining a friction estimate for a process control device, such as a sliding stem valve or a rotary valve, is to have the
estimation unit 30 collect data pertaining to the actuator travel or position (sensed by, for example, theposition sensor 37 ofFig. 1 ) and the actuator pressure (sensed by, for example, the pressure senor 34 or 36 ofFig. 1 ) for the valve over a particular time period. Typically, the collected data will be stored in memory as a series of data points, wherein each data point has an actuator pressure component derived from the measured actuator pressure signal and an actuator position component derived from the measured actuator position or travel signal. Of course, it will be understood that the actuator pressure and actuator position components of any data point should relate to the same time. Thus, it is preferable, when using two or more measured signals, to sample those signals at the same time to thereby produce time correlated data. -
Fig. 2 illustrates aplot 100 of actuator pressure versus actuator position for a typical sliding stem valve. In particular, each point of theplot 100 corresponds to a concurrent measurement of actuator pressure and actuator position. Theplot 100 corresponds to a single cycle of operation during which the actuator operates through a friction zone. Those skilled in the art will appreciate that upon a reversal of direction, the moveable element of the valve operates through a friction zone in which the applied pressure increases or decreases a significant amount with little or no resulting movement of the moveable valve element. This friction zone, which is caused by friction within the valve, is generally indicated by the morevertical lines 110 inFig. 2 . Upon exiting the friction zone, the moveable valve member then moves a significant amount with relatively little change in the applied pressure. This operation is generally indicated by the morehorizontal lines 114 inFig. 2 . Of course, other methods of representing the relationship between actuator pressure and actuator position are also available. For example, actuator pressure and actuator position can be plotted separately versus time. By aligning the two resulting plots along the same timeline, the plots can be simultaneously analyzed to detect the amount of pressure required to enable the movement of the actuator. Thus, one of ordinary skill in the art will appreciate that the exemplary plots discussed herein are presented by way of illustration only. - One of ordinary skill in the art will further appreciate that a single cycle of operation generally fails to provide sufficient indication of how well a sliding stem valve operates. In particular, the location of the friction zone of a valve depends upon the position of the moveable valve element with respect to the operating range of the element. Referring to
Fig. 3 , aplot 120 represents the operation of the moveable valve element through 80% of the range of operation during a plurality of cycles. As inFig. 2 , theplot 120 includes multiple vertical lines, each corresponding to a friction zone for a particular cycle of operation. Also as inFig. 2 , the more horizontal lines of theplot 120 correspond to those regions of travel where the stem moves due to a relatively small change in pressure. - As discussed above, the known methods of estimating process variables fail to indicate that the sliding stem of this valve does not encounter the same force of friction at different segments. For example, estimating the average friction for the entire 0% to 80% range of travel illustrated in
Fig. 3 effectively filters out the difference between the friction in the 0-10% range of travel and the friction in the 10%-20% range. In other words, estimating the average friction value based on the data illustrated inFig. 3 by the known means can only produce a single value. This single value fails to reflect the existence of one or more localized problems, much less the location of these problems within the available range of travel. - In one of the disclosed examples, these deficiencies are overcome by logically dividing the range of travel into several regions, each region having a particular size. It will be further understood that the size of a region may correspond to a number of data points associated with the region, percentage of travel associated with the region, an absolute measurement (e.g., degrees of rotation) associated with the region, amount of time during which process measurements were collected for the particular region, as well as other methods of dividing a range of travel known in the art. As illustrated in
Fig. 3 , theexemplary plot 120 includes the regions 121-128. In this particular example, the 0%-80% range of travel is divided into eight non-overlapping segments of equal size. However, some of the possible embodiments may involve regions having different sizes. For example, it is contemplated that in some applications, certain ranges of travel may be associated with a higher probability of failure. For example, operators or manufacturers may observe, based on either theoretical or empirical data, that a certain sliding stem valve is more likely to break in the 40-50% range of travel after a prolonged use. The operator may then decide to define segments in such a way that the 40-50% range of travel has more segments than all other ranges. Thus, the operator may partition the 40-50% range of travel in 5 separate regions while defining only 1 region for the 30-40% range of travel. Further, the operator may define at least partially overlapping segments to improve the reliability of certain statistical inferences, for example. Although the examples discussed below refer only to embodiments relying on non-overlapping, equal-sized segments, it is contemplated that in certain applications, the range of travel may include overlapping segments, segments of variable size, or both. - Meanwhile, the range of travel of a typical rotary valve may be divided into a plurality of regions based on a fixed or variable number of degrees.
Fig. 4 illustrates aplot 150 of actuator pressure versus actuator position for a typical rotary valve. Similarly to a sliding stem valve, the moveable element of a rotary valve operates, upon a reversal of direction, through a friction zone in which the applied pressure increases or decreases a significant amount with little or no resulting movement of the moveable valve element. As is also the case with a sliding stem valve, the plot of actuator pressure versus radial position of the actuator includes several substantially vertical lines. These lines correspond to friction zones in which there is little or no movement of the actuator in response to a change in pressure applied to the actuator. In accordance with the available method of measuring valve friction, the data points associated with the entire available range of motion are processed to estimate the average friction. However, the rotary valve may encounter friction in the range between 10 and 12 degrees, illustrated asregion 152 inFig. 4 , which is significantly different from friction encountered in the range between 14 and 16 degrees, for example. Moreover, each of the regions 152-158 may have a friction value significantly different from the average friction value associated with theplot 150. For example, the friction in theregion 152 may be too low while the friction in theregion 156 may be too high. Meanwhile, the average friction of the rotary valve, as obtained from theplot 150 viewed as a single undivided set of data, may be equal or acceptably close to a value indicative of a healthy status of the valve. - To properly detect localized problems, calculate a difference between various segments of travel, and obtain other indications of valve operation, the
parameter estimation unit 30 may separately calculate such parameters as friction, dead band, shaft windup, etc. for some or all of the segments 121-128 or 152-158. In some embodiments, an authorized user may configure theparameter estimation unit 30 with the number of segments associated with the available range of travel. Optionally, the user may specify the size and the boundaries of each segment. In some embodiments, the user may also specify whether one or more segments to which the calculation should be restricted. However, it is expected that most operators would generally prefer to process the entire available set of data to reduce the probability of inadvertently overlooking a segment or sub-range of the travel in which a problem has developed. - The
parameter estimation unit 30 may iteratively step through the data corresponding to each of segments 121-128 or 152-158 to detect each segment-specific value of friction, dead band, dead time, shaft windup, etc. Referring again to the data points forming theplots - For a rotary valve, the data that outlines or borders the friction zone may be determined by evaluating one or more conditions. First, the slope of the actuator pressure versus actuator position may be computed at each point and then compared to a threshold. The slope at a point may be computed by determining the point-to-point slope at a given point (i.e., the slope of a line drawn between the point in question and the previous or next point), by taking the slope of a best fit line (such as a line developed using a least squared error analysis) determined from the point in question and two or more surrounding points, or in any other desired manner. If the computed slope at a point is less than the threshold, then the point may be chosen for the reduced data set because that point is outside of the friction zone. On the other hand, if the slope is greater than the slope threshold, then the data point is within the friction zone and may discarded. If desired, the slope threshold may be predetermined or predefined (e.g., by an operator) or may be defined as a function of the slope of a best fit line (e.g., a least squared error line) through all of the collected data.
- Next, the change in pressure between consecutive points may be calculated and, if the pressure change is greater than a predetermined threshold of, for example, 0.05%, then the point is considered to be within the friction zone. It will be understood that one or both of these conditions may be used to determine if a point is within the friction zone or not. Thus, for example, if either the slope threshold or the pressure threshold of a point is exceeded, then the point may be considered to be within the friction zone and discarded. Alternatively, a point may be considered to be within the friction zone only when both the slope and the pressure threshold are exceeded. Furthermore, if desired, either one or both of these approaches may be used with sliding stem valves.
- After generating the reduced data set as described above, the remaining data points typically fall within one of two clusters bordering the friction zone of the valve device. After the reduced data set is formed, it is beneficial to detrend the data, that is, remove any linear trends caused by, for example, the actuator spring force (which varies over the range of the actuator movement). There are many approaches to estimating the best fit line to the data for detrending the data. For example, one approach is to calculate the best fit line through all of the data within the reduced data set. In other cases, it may be preferable to fit a separate line to the data on each side of the friction zone, i.e., use a separate line fit routine for each of the clusters. One of ordinary skill in the art will further appreciate that various alternative methods of reducing data sets, detrending data, calculating the best fit line, as well as other statistical techniques may be used to analyze the data.
- After the data associated with one or more segments is reduced and/or detrended, the
parameter estimation unit 30 may estimate the segment-specific value of a process parameter. For example, theestimation unit 30 may obtain the friction of a sliding stem valve in the 20%-30% range of travel by applying the method disclosed in theU.S. Patent No. 6,466,893 , or by applying any other method to the complete or reduced data set. Theestimation unit 30 may then transmit the results of calculating one or segment-specific estimates to thedisplay 38 or to any other output device.Fig. 5 illustrates ahistogram 200 which includes bars 201-208. Each of the bars 201-208 corresponds to one of the segments 151-158 of theplot 150 illustrated inFig. 3 . In particular, the height of each bar may represent the value of friction associated with one of the travel segments. It will be appreciated that thehistogram 200 visually communicates segment-specific friction of the segments 151 to 158 in a clear, easy-to-understand manner. By quickly looking over thehistogram 200, the operator may immediately suspect that thevalve 18 may be sticking in thesegment 204 or that the packing of thevalve 18 may have degraded in regions 201-203 and 208. The operator may then physically inspect the valve, compare each of the potentially faulty segments to a predefined value, or take other suitable action to confirm or disprove the suspicion. - Additionally, the
display unit 38 may display theplot 120 along with thehistogram 200 in order for the operator to visually confirm the preliminary results he or she reaches by noticing a particularly high or low histogram bar. To continue with the example discussed above, the operator or engineer may wish to confirm that thehistogram bar 204 in fact corresponds to that portion of theplot 150 where the clusters of data points forming the more horizontal sections of the graph are spaced farther apart than in the other segments. Of course, theplot 150 illustrates the complete data set prior to exclusion of the more points associated with friction zones and prior to detrending the set. However, as evidenced by the overall shape of theplot 150, the operator may nevertheless recognize that the clusters of points that appear stretched in a vertical dimension tend to indicate higher values of friction (when the axis of ordinates is selected for pressure and the abscissa is selected for travel). - In another embodiment, the
estimation unit 30 stores threshold values associated with some or all of the friction, dead band, dead time, or shaft windup. Preferably, theestimation unit 30 stores a low threshold value and a high threshold value to detect both excessive and insufficient values of these process parameters. For example, theestimation unit 30 may store a high threshold friction value of 1100 lbf and a low threshold friction value of 300 lbf. In operation, theestimation unit 30 may identify each of the histogram bars 201-208 having a height outside the 300-1100 lbf range. By analyzing theexample histogram 200 illustrated inFig. 5 , theestimation unit 30 may thus determine that the regions corresponding to thebars estimation unit 30 may trigger an alarm, create an entry in an even log, initiate a message to the operator, or perform a similar operation. - In some embodiments, the
estimation unit 30 may additionally calculate the overall average associated with the range of travel including all segments 121-128 of a sliding stem valve and the segments 152-158 of a rotary valve. It is contemplated in some applications, it may be desirable to identify which sections of travel of a moveable part, if any, differ from the overall average by a certain number of standard deviations, for example. To this end, theestimation unit 30 may obtain the average friction value for the relevant range of travel, compare the friction of each individual segment to the average friction value to calculate the standard deviation, and identify those segments which significantly differ both from the average and from the rest of the segments. This approach may be useful in investigating the wear and tear characteristics of a device, for example. - In yet another embodiment, the
display unit 38 may render the highest and lowest histogram in a color different from the rest of thehistogram 200. In this manner, thedisplay unit 38 may direct the operator's attention to the relevant (i.e., potentially problematic) sections of the histogram. Thus, an operator responsible for a large number ofcontrol loops 10,valves 18, or other devices having moveable components, may quickly notice the potential problems even when paying relatively little attention to a console monitor. Of course, theestimation unit 30, thedisplay unit 38, and other components may also provide other visual or audio means of attracting human attention to values significantly deviating from a predefined norm or from the average associated with a particular device. - As indicated earlier, the method discussed above with respect to estimating friction may be also applied to calculate other process variables such as shaft windup, for example.
Fig. 6 illustrates two plots of the actuator pressure versus actuator travel for movement of a rotary valve in one complete cycle through the friction zone. In particular, theplot 230 includes data points corresponding to approximately 10.2 to 10.7 degrees of travel of a particular rotary valve. Meanwhile, theplot 250 illustrates the movement of the same valve between approximately 11.2 and 11.7 degrees of travel. As illustrated inFig. 6 , shaft windup is the movement of the valve element which occurs before the actuator pressure reaches a maximum (or minimum) value which causes continued movement of the valve element. As one will easily notice through a cursory inspection ofFig. 6 , theplots plot 250 includes a steeper slope of the section in which the shaft windup occurs. Thus, an operator may recognize that the shape which appears more stretched out in the horizontal dimension corresponds to a greater windup value. Of course, as illustrated inFig. 4 , theestimation unit 30 preferably collects or otherwise obtains data for multiple cycles of operation. - Thus, after collecting actuator pressure versus actuator travel data for a valve, the
estimation unit 30 may compute the shaft windup at any particular occurrence and then estimate the shaft windup associated with a particular segment of travel as the average or median of all shaft windup occurrences within this segment. To determine the shaft windup in any particular instance, theestimation unit 30 may monitor the slope of the actuator pressure versus the actuator travel curve. Shaft windup generally starts where the magnitude of the slope increases significantly (or becomes greater than a certain amount) and ends where the magnitude of the slope decreases significantly (or becomes less than a certain amount). As will be understood, the actuator travel movement (typically expressed as a percent of full travel) between the start and end points is the shaft windup for the particular occurrence. - Upon estimating shaft windup values for one or more segments of travel, the
display unit 38, thecomputer workstation 42, or other unit having a display may represent the results graphically, as in ahistogram 270, for example (Fig. 7 ). Each of the bars 272-278 may correspond to a certain amount of travel. In the example illustrated inFig. 7 , thebar 276 appears significantly lower that thebars histogram 270, an operator may immediately determine that, at the very least, shaft windup of the rotary valve is not the same for each section of travel. The operator may then manually check whether thebar 272 points to an unacceptably low windup in the section of travel between 14 and 16 degrees, or whether thebars - In a similar manner, the method may be applied to dead time and dead band estimates for sliding stem valve, a rotary valve, or other device having a component which moves through a predefined range of travel. For example, the
estimation unit 30 may calculate the dead band associated with a particular section of travel by assuming that the dead band is mostly caused by friction and dividing the friction estimate for the segment by the open loop gain of the device. Segment-specific estimates of the dead band of the device may be similarly displayed in form of a histogram, automatically compared to one or more thresholds, and/or statistically processed to determine the average value and the standard deviation. Further, theestimate unit 30 may trigger an alarm for one or more segments significantly deviating either from the predefined values or from the calculated average. - Additionally, the
estimation unit 30 may generate segment-specific dead time estimates for thevalve 18 or other moveable component of a device operating in thecontrol loop 10. To this end, theestimation unit 30 may perform cross-correlation analysis of the input signal (such as that produced by thecontroller 12 and measured by thecurrent sensor 32 ofFig. 1 ) and the actuator travel or position signal (such as that measured by theposition sensor 37 ofFig. 1 ). Theestimation unit 30 may perform this or other type of statistical correlation analysis for a given segment travel of travel to determine a time shift between the output and the input signals. - In addition to calculating segment-specific process parameters of the
control loop 10 for a particular set of measurements, theestimation unit 30 may also generate trend data for one or more of these parameters. More specifically, theestimation unit 30 may store measurements related to one or more of friction, shaft windup, dead time, and dead band over a substantially long period of time (days, months, years, etc.). In some contemplated embodiments, theestimation unit 30 includes or cooperates with a persistent memory such as thememory unit 44. Upon obtaining a segment-specific measurement, theestimation unit 30 may store the measurement along with a timestamp in the persistent memory. Alternatively, theestimation unit 30 may periodically generate and store "snapshots" of some or all of the calculated segment-specific process parameters. Preferably, theestimation unit 30 stores friction and other parameters for each segment of travel to enable trending of multiple segments over time. - The
estimation unit 30 may then plot trend data for one or more segments in response to receiving a request from the operator via theinput unit 40, for example. Alternatively, theestimation unit 30 may plot trend data upon timer expiration and according to some predefined schedule. It will be appreciated that average data for a particular segment may yield such non-obvious information about the valve actuator or some other moveable part as, for example, the average rate of deterioration over a predefined period, unexpectedly low or high changes over a period of time, etc. Additionally, trend data for several segments may be used to identify one or segments which may deteriorate at a faster rate than the rest of the segments or a predefined target rate. Referring toFig. 8 , theplot 300 illustrates the measurements of friction for two segments of actuator travel trended over a six month period. In this example, thesymbol 302 marks average measurements corresponding to a segment of travel between 30% and 40%, and thesymbol 304 represents average measurements of the 20% to 30% travel for a certain sliding stem valve. - It will be appreciated that the
example plot 300 illustrates a faster loss of friction in the 30%-40% segment of travel. As illustrated inFig. 8 , the initial measurement of friction for this segment appears to be significantly higher than the friction of the 20%-30% segment of travel. However, the friction of this segment drops from approximately 1900 lbf in January to about 500 lbf in July, whereas the decrease in friction associated with the 20%-30% segment of travel drops from about 1500 lbf to about 700 lbf. By observing the trend illustrated by theplot 300, an operator or engineer may conclude, for example, that the wear of the moveable component (or of the static component interacting with the moveable component) is more pronounced in the 30%- 40% segment of travel. One of ordinary skill in the art will further appreciate that engineers may apply this data to improve the future design of the device or of the moveable components used in the device. - On the other hand, trend data collected and plotted for a single segment of travel may also yield important information, such as an approximate measurement of the rate at which a parameter of a device changes over time. To continue with the example of friction measurements illustrated in
Fig. 8 , theestimation unit 30 may calculate the best fit line (not shown) for all measurements marked with thesymbol 302 inFig. 8 . The slope of the best fit line will yield an estimate of the rate of loss of friction associated with the 30%- 40% segment of travel. Of course, theestimation unit 30 may also apply other statistical methods to trend data associated with an individual segment to determine the rate of change and other characteristics of the corresponding trend. -
Fig. 9 illustrates a block diagram of asoftware routine 330 that may be executed on theestimation unit 30 to estimate friction for each of several travel segments of a valve actuator. One of ordinary skill in the art will also appreciate that thesoftware routine 330 may also run on aworkstation 42, on a computer communicatively coupled to thecontrol loop 10, or on a standalone computer or other intelligent device capable of receiving process measurement data via a memory drive, a wired or wireless modem, or via any other communication or storage means known in the art. As indicated above, thesoftware routine 330 may also be a part of a software package responsible for other control and maintenance functions of thecontrol loop 10 or of thevalve 18. For example, the AMS ValveLink® software package, available from Emerson Process Management, may include thesoftware routine 330 as a component. It will be further appreciated that thesoftware routine 330 may process data arriving from thecontrol loop 10 in substantially real time or, alternatively, may perform post-time processing of data received from the sensors 32-37 and stored in thememory unit 44, for example. Moreover, thesoftware routine 330 may interact with an external storage device during operation to obtain measurement data. - In general, the
software routine 330 may retrieve actuator pressure and position data from an array or a linked list. In one contemplated embodiment, theestimation unit 30 or thememory unit 44 may store this data in a two dimensional array indexed by a relative or absolute time counter. For example, the array may store a plurality of tuples, each tuple including a measurement of actuator pressure and actuator position collected at the same point in time. As illustrated inFig. 9 , thesoftware routine 330 may step through the array and update a corresponding segment-specific friction estimate with the information stored in the current array element. In particular, thesoftware routine 330 may initialize an array counter, k, at ablock 332. Next, the software routine may iterate through some or all of the blocks 334-348 as many times as the number of elements in the array storing the pressure in position data. - In a
block 334, the routine 330 may check whether the current value of the counter k has exceeded the size of the array. Next, the routine 330 may read the pressure/position tuple from a single or multiple arrays in a block or step 336. In the example routine illustrated inFig. 9 , actuator position data is stored in an array travel and actuator pressure data is stored in a similarly indexed array differential_pressure. However, both pressure and actuator data could also be stored in a single two-dimensional array. Preferably but not necessarily, each tuple retrieved in thestep 336 corresponds to the actuator position and actuator pressure measured after a constant interval relative to the previous tuple retrieved in thestep 336. In other words, theestimation unit 30 preferably samples position and pressure data at a constant rate. - In a
block 338, the routine 330 initializes the segment counter s to 0. Theprocedure 300 then steps through the segments to determine to which segment the array element indexed by the current value of k belongs (blocks 340-344). In one possible embodiment of theprocedure 330, each segment includes the same number of pressure/position tuples. Alternatively, the routine 330 may retrieve the definition of segments, including the number of segments and/or boundaries of each segment, from a persistent or volatile memory as part of configuration data. As yet another alternative, the routine 330 may receive the definition of segments as input parameters. A user may enter these parameters via theinput device 40 orworkstation 42. - Once the routine 330 matches the pressure/position tuple with one of the segments, the routine 330 may update the average segment-specific friction value with the data included in the tuple (block 346). The
procedure 330 may apply of the methods discussed above in reference toFigs. 2-5 , for example. The routine 330 may then increment the value of k in ablock 348 and return to theblock 334 for the next iteration. When the counter k exceeds the size of the array or when the number of segments exceeds a predefined, predetermined, or otherwise specified limit, the routine 330 exits (blocks 350 and 352). - It will be also appreciated that the
estimation unit 30 may calculate segment-specific values for dead band, dead time, and shaft windup by executing logic similar to the routine 330. To this end, theestimation unit 30 may include additional routines or may include the logic for estimating the dead band, dead time, and shaft windup as part of the routine 330. - While the present invention has been described with reference to specific examples, which are intended to be illustrative only and not to be limiting of the invention, it will be apparent to those of ordinary skill in the art that changes, additions and/or deletions may be made to the disclosed embodiments without departing from the spirit and scope of the invention.
- The preferred aspects of the present disclosure may be summarized as follows:
- 1. A method of determining a segment-specific estimate of a parameter associated with a process control loop, the method comprising:
- measuring a signal within the process control loop when the process control loop is connected on-line within a process control environment, including:
- measuring an input signal indicative of an input parameter; and
- measuring an output signal indicative of an output parameter;
- storing the measured signal as a series of data points, each data point having a first component derived from the input signal and a second component derived from the output signal;
- partitioning the stored signal data into a plurality of data segments;
- performing a statistical analysis on at least some of the plurality of data segments; and
- generating a set of segment-specific estimates based on the performed statistical analysis.
- measuring a signal within the process control loop when the process control loop is connected on-line within a process control environment, including:
- 2. The method of
aspect 1, wherein partitioning the stored signal data into a plurality of data segments includes defining non-overlapping segments of equal size. - 3. The method of aspect 2, further comprising:
- comparing each of the segment-specific friction estimates to a threshold value;
- generating a problem indication in response to detecting that a particular segment-specific friction estimate exceeds the threshold value.
- 4. The method of aspect 2, further comprising:
- calculating an average of the set of segment-specific estimates;
- comparing each of the set of segment-specific estimates to the average of the set of segment-specific estimates; and
- generating a problem indication in response to detecting that at least one of the set of segment-specific estimates differs from the average of the set of segment-specific estimates by more than a certain amount.
- 5. The method of aspect 2, wherein the parameter associated with a process control loop is one of a friction, a dead time, a dead band, or shaft windup associated with a portion of the range of travel of the actuator.
- 6. The method of aspect 2, further comprising repeating the acts of measuring a signal within the process control loop, storing the signal data, partitioning the stored signal data, and performing a statistical analysis at a later point in time to generate a second set of segment-specific estimates; and
generating trend data by comparing the set of segment-specific estimates to the second set of segment-specific estimates. - 7. The method of
aspect 6, wherein comparing the first subset to the second subset to generate trend data includes generating segment-specific trend data. - 8. A method of determining a segment-specific estimate of a parameter associated with a process control loop, the method comprising:
- receiving signal data corresponding to a signal from a process control loop;
- storing the signal data;
- partitioning the stored signal data into a plurality of data segments;
- performing a statistical analysis on a first one of the plurality of data segments selected from the plurality of data segments; and
- generating a first segment-specific parameter estimate based on the performed statistical analysis of the first one of the plurality of data segments.
- 9. The method of aspect 8, wherein partitioning the stored signal data into a plurality of data segments includes partitioning the stored signal data into a plurality of non-overlapping segments of substantially equal size.
- 10. The method of aspect 8, further comprising performing a statistical analysis on a second one of the plurality of data segments to generate a second segment-specific parameter estimate.
- 11. The method of
aspect 10, further comprising providing the first and second segment-specific parameter estimates to a user via a display unit. - 12. The method of
aspect 11, wherein the first and second segment-specific parameter estimates to a user via a display unit includes displaying a histogram, wherein each bar in the histogram is associated with one of the segment-specific parameters. - 13. The method of aspect 8, wherein receiving signal data corresponding to a signal from a process control loop includes measuring the signal within the process control loop when the process control loop is connected on-line within a process control environment.
- 14. The method of aspect 8, wherein receiving signal data corresponding to a signal from a process control loop includes receiving measurements of an actuator pressure signal and an actuator position signal of a device having an actuator that moves in response to actuator pressure and has a range of travel; and
wherein storing the signal data includes storing a series of tuples, each tuple including an actuator pressure value derived from the actuator pressure signal and an actuator position value derived from the actuator position signal. - 15. The method of
aspect 14, wherein the first segment-specific estimate is one of a friction, a dead time, a dead band, or shaft windup associated with a portion of the range of travel of the actuator. - 16. The method of
aspect 15, further comprising comparing the first segment-specific estimate to a threshold value to conditionally generate a problem indication, wherein the problem indication is generated if the first segment-specific estimate is substantially higher or substantially lower than the threshold value. - 17. The method of aspect 8, wherein receiving signal data corresponding to a signal from a process control loop includes receiving signal data corresponding to the signal generated at a first point in time and a second point in time; and
wherein performing a statistical analysis on a first one of the plurality of data segments includes:- generating a first value corresponding to the first segment-specific parameter estimate at the first point in time;
- generating a second value corresponding to the first segment-specific parameter estimate at the second point in time; and
- comparing the first and the second values to determine a first trend in the segment-specific parameter.
- 18. The method of
aspect 17, wherein the first and the second points in time are selected in accordance with a maintenance cycle associated with the process control loop. - 19. The method of
aspect 18, wherein the maintenance cycle is 30 days or less. - 20. The method of
aspect 17, further comprising:- performing a statistical analysis on a second one of the plurality of data segments to generate a second segment-specific parameter estimate;
- generating a third value corresponding to the second segment-specific parameter estimate at the first point in time;
- generating a fourth value corresponding to the second segment-specific parameter estimate at the second point in time;
- comparing the first and the second values to determine a second trend in the second-specific parameter.
- 21. A computer program stored on a computer readable medium for use in controlling a processor based on data stored in a memory associated with the processor, the program performing the steps of:
- reading from a memory a data set indicative of a signal associated with a process control loop operating within a process control environment;
- dividing the data set into a plurality of sections, wherein each of the plurality of sections corresponds to a segment of a range of operation of a device operating in the process control loop; and
- performing a statistical analysis on data associated with a first one of the plurality of sections to produce a first segment-specific estimate of a parameter associated with the process control loop.
- 22. The computer program of aspect 21, further comprising the step of performing a statistical analysis on a second one of the plurality of sections to generate a second segment-specific estimate of the parameter.
- 23. The computer program of
aspect 22, further comprising the step of comparing the first segment-specific estimate of the parameter and the second segment-specific estimate of the parameter to a threshold value. - 24. The computer program of
aspect 22, further comprising the step of comparing the first segment-specific estimate of the parameter and the second segment-specific estimate of the parameter to an average value of the parameter associated with the complete data set. - 25. The computer program of aspect 21, wherein the step of performing a statistical analysis on a first one of the plurality of sections includes:
- generating a first value corresponding to the segment-specific parameter estimate at a first point in time;
- generating a second value corresponding to the first segment-specific parameter estimate at a second point in time; and
- comparing the first and the second values to determine a trend in the segment-specific parameter.
- 26. The computer program of aspect 21, wherein the process control loop includes a valve having a moveable actuator and wherein the parameter is one of a friction, a dead time, a dead band, or shaft windup.
Claims (10)
- A method of estimating a parameter of a process control loop, wherein the process control loop includes a valve controlled in accordance with an input command signal, the method comprising:measuring an output signal within the process control loop when the process control loop is connected on-line within a process control environment, wherein the input command signal is a pressure signal supplied to an actuator of the valve, and wherein the output signal is a position signal indicative of a position of the actuator of the valve;storing the measured output signal and the input command signal as a series of data points, each data point having a first component derived from the input command signal and a second component derived from the output signal;partitioning the stored series of data points into a plurality of non-overlapping data segments of equal size, each data segment corresponding to a particular range of travel of the actuator of the valve;performing a statistical analysis on at least some of the plurality of data segments to generate a set of two or more segment-specific estimates of the parameter of the process control loop, wherein each one of the two or more segment specific parameters corresponds to a respective data segment of the plurality of data segments;storing a threshold value associated with the parameter;comparing each of the two or more segment-specific parameters to the threshold value; andgenerating a problem indication in response to detecting that a certain segment-specific estimate is above the threshold value.
- The method of claim 1, further comprising:calculating an average of the set of segment-specific estimates;comparing each of the set of segment-specific estimates to the average of the set of segment-specific estimates; andgenerating a further problem indication in response to detecting that at least one of the set of segment-specific estimates differs from the average of the set of segment-specific estimates by more than a certain amount.
- The method of claim 1, wherein the parameter of process control loop is one of a friction, a dead time, a dead band, or a shaft windup; wherein each segment specific estimate corresponds to a respective portion of the range of travel of the actuator of the valve.
- The method of claim 1, further comprising repeating the acts of measuring a signal within the process control loop, storing the signal data, partitioning the stored signal data, and performing a statistical analysis at a later point in time to generate a second set of segment-specific estimates; and
generating trend data by comparing the set of segment-specific estimates to the second set of segment-specific estimates. - The method of 1, further comprising providing the set of segment-specific parameter estimates to a user via a display unit.
- The method of claim 5, wherein providing the set of segment-specific parameter estimates to a user via the display unit includes displaying a histogram, wherein each bar in the histogram is associated with a respective one of the set of segment-specific parameters.
- A computer program stored on a computer readable medium and executable by a processor, the program performing the steps of:reading, from a memory, a data set descriptive of an output position signal indicative of a position of an actuator of a valve operating within a process control loop of a process control system, wherein the output position signal is indicative of a response of the valve actuator to a pressure input command signal supplied to the valve actuator;dividing the data set into a plurality of non-overlapping data segments of equal size, each data segment corresponding to a particular range of travel of the actuator of the valve;performing a statistical analysis on at least some of the plurality of data segments to generate a set of two or more segment-specific estimates of the parameter of the process control loop, wherein each one of the two or more segment specific parameters corresponds to a respective data segment of the plurality of data segments;comparing each of the two or more segment-specific parameters to a threshold value associated with the parameter; andgenerating a problem indication in response to detecting that a certain segment-specific estimate is above the threshold value.
- The computer program of claim 7, further comprising the step of:determining an average value of the parameter based on all data in the data set; comparing the first segment-specific estimate of the parameter and the second segment-specific estimate of the parameter to the average value of the parameter; andgenerating a further problem indication in response to detecting that at least one of the first segment-specific estimate of the parameter and the second segment-specific estimate of the parameter differs from the average by more than a certain amount.
- The computer program of claim 7, wherein the step of performing a statistical analysis on a first one of the plurality of sections includes:generating a first value corresponding to the segment-specific parameter estimate at a first point in time;generating a second value corresponding to the first segment-specific parameter estimate at a second point in time; andcomparing the first and the second values to determine a trend in the segment-specific parameter.
- The computer program of claim 7, wherein the parameter is one of a friction, a dead time, a dead band, or shaft windup.
Applications Claiming Priority (3)
| Application Number | Priority Date | Filing Date | Title |
|---|---|---|---|
| US12/040,493 US7996096B2 (en) | 2008-02-29 | 2008-02-29 | Estimation of process control parameters over predefined travel segments |
| PCT/US2009/031272 WO2009108414A1 (en) | 2008-02-29 | 2009-01-16 | Estimation of process control parameters over predefined travel segments |
| EP09715265A EP2263132A1 (en) | 2008-02-29 | 2009-01-16 | Estimation of process control parameters over predefined travel segments |
Related Parent Applications (1)
| Application Number | Title | Priority Date | Filing Date |
|---|---|---|---|
| EP09715265A Division EP2263132A1 (en) | 2008-02-29 | 2009-01-16 | Estimation of process control parameters over predefined travel segments |
Publications (2)
| Publication Number | Publication Date |
|---|---|
| EP2722720A1 true EP2722720A1 (en) | 2014-04-23 |
| EP2722720B1 EP2722720B1 (en) | 2019-08-21 |
Family
ID=40549771
Family Applications (2)
| Application Number | Title | Priority Date | Filing Date |
|---|---|---|---|
| EP14151305.1A Active EP2722720B1 (en) | 2008-02-29 | 2009-01-16 | Estimation of process control parameters over predefined travel segments |
| EP09715265A Ceased EP2263132A1 (en) | 2008-02-29 | 2009-01-16 | Estimation of process control parameters over predefined travel segments |
Family Applications After (1)
| Application Number | Title | Priority Date | Filing Date |
|---|---|---|---|
| EP09715265A Ceased EP2263132A1 (en) | 2008-02-29 | 2009-01-16 | Estimation of process control parameters over predefined travel segments |
Country Status (10)
| Country | Link |
|---|---|
| US (1) | US7996096B2 (en) |
| EP (2) | EP2722720B1 (en) |
| JP (1) | JP5781309B2 (en) |
| CN (1) | CN101960402B (en) |
| AR (1) | AR070629A1 (en) |
| BR (1) | BRPI0908377A2 (en) |
| CA (1) | CA2713729C (en) |
| MX (1) | MX2010009515A (en) |
| RU (1) | RU2483340C2 (en) |
| WO (1) | WO2009108414A1 (en) |
Families Citing this family (35)
| Publication number | Priority date | Publication date | Assignee | Title |
|---|---|---|---|---|
| US8290631B2 (en) * | 2009-03-12 | 2012-10-16 | Emerson Process Management Power & Water Solutions, Inc. | Methods and apparatus to arbitrate valve position sensor redundancy |
| CN103038559B (en) * | 2010-04-30 | 2015-08-19 | 美卓自动化有限公司 | The diagnosis of control valve |
| GB2502209A (en) * | 2011-01-24 | 2013-11-20 | Abb Inc | Method for analyzing and diagnosing large scale process automation control systems |
| US9021086B2 (en) * | 2011-10-21 | 2015-04-28 | Comcast Cable Communications, Llc | System and method for network management |
| US9092019B2 (en) | 2012-04-20 | 2015-07-28 | Fisher Controls International Llc | Methods and apparatus for analyzing effects of friction on process control devices |
| US8710777B2 (en) * | 2012-04-20 | 2014-04-29 | Linestream Technologies | Method for automatically estimating inertia in a mechanical system |
| US9227738B2 (en) * | 2012-12-31 | 2016-01-05 | Textron Innovations Inc. | Automated diagnostic inspection of mechanical controls |
| US20150276086A1 (en) * | 2014-03-31 | 2015-10-01 | General Electric Company | System and method for performing valve diagnostics |
| KR20160108239A (en) * | 2015-03-06 | 2016-09-19 | 인피콘, 인크. | Monitoring operation of a reaction chamber |
| WO2016149584A1 (en) * | 2015-03-19 | 2016-09-22 | Fisher Controls International Llc | Pressure control for calibrating process control devices |
| US10152879B2 (en) * | 2015-11-10 | 2018-12-11 | Industrial Technology Research Institute | Method, apparatus, and system for monitoring manufacturing equipment |
| US10317855B2 (en) | 2016-05-31 | 2019-06-11 | Yokogawa Electric Corporation | Method for detection of diagnosing control valve stiction |
| US10619760B2 (en) * | 2016-10-24 | 2020-04-14 | Fisher Controls International Llc | Time-series analytics for control valve health assessment |
| US11275365B2 (en) * | 2016-10-24 | 2022-03-15 | Fisher Controls International Llc | Integration of online and offline control valve data |
| US11080660B2 (en) * | 2017-03-20 | 2021-08-03 | The Boeing Company | Data-driven unsupervised algorithm for analyzing sensor data to detect abnormal valve operation |
| US20190017626A1 (en) * | 2017-07-14 | 2019-01-17 | Dresser, Llc | Using short-range wireless connectivity to transmit data from a valve assembly |
| BR112020010227B1 (en) * | 2017-11-22 | 2023-04-11 | Illinois Tool Works Inc | VALVE MODULE STROKE DETECTION SYSTEM AND METHOD FOR MONITORING THE PERFORMANCE OF A VALVE MODULE |
| US11274850B2 (en) * | 2018-05-21 | 2022-03-15 | Johnson Controls Tyco IP Holdings LLP | Systems and methods for flow estimation using differential pressure sensor across valve |
| DE102018116048B4 (en) * | 2018-07-03 | 2020-10-01 | Samson Aktiengesellschaft | Diagnosis of possible causes for changes in a control valve |
| CN108873698B (en) * | 2018-07-07 | 2021-06-01 | 福州大学 | Anti-disturbance two-stage fixed-point servo control method |
| CN110823342B (en) * | 2018-08-10 | 2021-04-09 | 河南工业大学 | Granary detection method and system based on side single-circle standard deviation polynomial model |
| US10787079B2 (en) * | 2018-09-27 | 2020-09-29 | Ford Global Technologies, Llc | Vehicle ground path impedance difference detection |
| US11828307B2 (en) * | 2019-01-08 | 2023-11-28 | Thales Canada Inc. | Method and system for detecting, isolating and estimating a degradation of a corresponding component of an actuator |
| RU2713875C1 (en) * | 2019-04-05 | 2020-02-07 | Частное образовательное учреждение высшего образования "Московский Университет им. С.Ю. Витте" | Device for estimating parameters of disturbed processes using a maximum of generalized power |
| US10853219B2 (en) * | 2019-04-30 | 2020-12-01 | Intel Corporation | Real-time input/output bandwidth estimation |
| JP7417376B2 (en) * | 2019-07-31 | 2024-01-18 | アズビル株式会社 | Valve maintenance support device and support method |
| JP7376307B2 (en) * | 2019-10-08 | 2023-11-08 | アズビル株式会社 | Malfunction determination device and method |
| DE102019129368A1 (en) * | 2019-10-30 | 2021-05-06 | Samson Aktiengesellschaft | Establishing termination criteria for a partial stroke test on a fluidically driven safety valve and determining the functionality of a fluidically driven safety valve |
| US20230079290A1 (en) * | 2020-02-28 | 2023-03-16 | Illinois Tool Works Inc. | Piston monitoring assembly |
| JP6795231B1 (en) * | 2020-03-09 | 2020-12-02 | 金子産業株式会社 | solenoid valve |
| CN113821006B (en) * | 2020-05-07 | 2022-10-14 | 牧今科技 | Method and computing system for determining values of error parameters indicative of robot calibration quality |
| CN112000370B (en) | 2020-08-27 | 2022-04-15 | 北京百度网讯科技有限公司 | Processing method, device and equipment of loop instruction and storage medium |
| CN111983997B (en) * | 2020-08-31 | 2021-07-20 | 北京清大华亿科技有限公司 | Coupling analysis-based control loop performance monitoring method and system |
| CN114110249B (en) * | 2021-11-30 | 2023-12-05 | 重庆川仪自动化股份有限公司 | Method for diagnosing friction force of filling material of regulating valve |
| CN115435101B (en) * | 2022-11-03 | 2023-02-28 | 中国空气动力研究与发展中心设备设计与测试技术研究所 | Large electrically-driven rectangular vacuum gate valve and motion control method |
Citations (6)
| Publication number | Priority date | Publication date | Assignee | Title |
|---|---|---|---|---|
| US5687098A (en) | 1995-10-30 | 1997-11-11 | Fisher Controls International, Inc. | Device data acquisition |
| US5966679A (en) | 1995-10-30 | 1999-10-12 | Fisher Controls International, Inc. | Method of and apparatus for nonobtrusively obtaining on-line measurements of a process control device parameter |
| US6466893B1 (en) | 1997-09-29 | 2002-10-15 | Fisher Controls International, Inc. | Statistical determination of estimates of process control loop parameters |
| JP2003091620A (en) * | 2001-09-19 | 2003-03-28 | Kao Corp | Statistical information compiling device |
| US6609036B1 (en) * | 2000-06-09 | 2003-08-19 | Randall L. Bickford | Surveillance system and method having parameter estimation and operating mode partitioning |
| US20050107962A1 (en) * | 2003-11-19 | 2005-05-19 | Honeywell International Inc. | Apparatus and method for identifying possible defect indicators for a valve |
Family Cites Families (18)
| Publication number | Priority date | Publication date | Assignee | Title |
|---|---|---|---|---|
| US3805044A (en) * | 1971-04-07 | 1974-04-16 | Western Electric Co | Computerized process control system for the growth of synthetic quartz crystals |
| US5988856A (en) * | 1994-08-31 | 1999-11-23 | Massachusetts Institute Of Technology | Apparatus for real-time estimation of printing medium properties and method for the use thereof |
| US7949495B2 (en) * | 1996-03-28 | 2011-05-24 | Rosemount, Inc. | Process variable transmitter with diagnostics |
| US6168568B1 (en) * | 1996-10-04 | 2001-01-02 | Karmel Medical Acoustic Technologies Ltd. | Phonopneumograph system |
| US7010459B2 (en) * | 1999-06-25 | 2006-03-07 | Rosemount Inc. | Process device diagnostics using process variable sensor signal |
| JP2001166025A (en) * | 1999-12-14 | 2001-06-22 | Matsushita Electric Ind Co Ltd | Sound source direction estimating method, sound collection method and device |
| US6539343B2 (en) * | 2000-02-03 | 2003-03-25 | Xerox Corporation | Methods for condition monitoring and system-level diagnosis of electro-mechanical systems with multiple actuating components operating in multiple regimes |
| US6917839B2 (en) * | 2000-06-09 | 2005-07-12 | Intellectual Assets Llc | Surveillance system and method having an operating mode partitioned fault classification model |
| US8280533B2 (en) * | 2000-06-20 | 2012-10-02 | Fisher-Rosemount Systems, Inc. | Continuously scheduled model parameter based adaptive controller |
| US7119351B2 (en) * | 2002-05-17 | 2006-10-10 | Gsi Group Corporation | Method and system for machine vision-based feature detection and mark verification in a workpiece or wafer marking system |
| US7171561B2 (en) * | 2002-10-17 | 2007-01-30 | The United States Of America As Represented By The Secretary Of The Air Force | Method and apparatus for detecting and extracting fileprints |
| US7295944B2 (en) * | 2004-02-25 | 2007-11-13 | Analysis And Measurement Services Corporation | Cross-calibration of plant instruments with computer data |
| US7676287B2 (en) * | 2004-03-03 | 2010-03-09 | Fisher-Rosemount Systems, Inc. | Configuration system and method for abnormal situation prevention in a process plant |
| US7914468B2 (en) * | 2004-09-22 | 2011-03-29 | Svip 4 Llc | Systems and methods for monitoring and modifying behavior |
| EP1839151B1 (en) * | 2004-12-17 | 2012-07-18 | Korea Research Institute of Standards and Science | A trend monitoring and diagnostic analysis method for a vacuum pump and a trend monitoring and diagnostic analysis system therefor and computer-readable storage media including a computer program which performs the method |
| US20070058554A1 (en) * | 2005-09-14 | 2007-03-15 | Alcatel | Method of networking systems reliability estimation |
| US7478012B2 (en) * | 2006-06-30 | 2009-01-13 | Fisher Controls International Llc | Computerized evaluation of valve signature graphs |
| JP4846499B2 (en) * | 2006-09-22 | 2011-12-28 | 株式会社日本自動車部品総合研究所 | Driving position adjustment system |
-
2008
- 2008-02-29 US US12/040,493 patent/US7996096B2/en active Active
-
2009
- 2009-01-16 EP EP14151305.1A patent/EP2722720B1/en active Active
- 2009-01-16 RU RU2010138454/08A patent/RU2483340C2/en active
- 2009-01-16 BR BRPI0908377-4A patent/BRPI0908377A2/en not_active Application Discontinuation
- 2009-01-16 WO PCT/US2009/031272 patent/WO2009108414A1/en active Application Filing
- 2009-01-16 MX MX2010009515A patent/MX2010009515A/en active IP Right Grant
- 2009-01-16 JP JP2010548753A patent/JP5781309B2/en not_active Expired - Fee Related
- 2009-01-16 CN CN200980106772.0A patent/CN101960402B/en active Active
- 2009-01-16 EP EP09715265A patent/EP2263132A1/en not_active Ceased
- 2009-01-16 CA CA2713729A patent/CA2713729C/en active Active
- 2009-02-24 AR ARP090100628A patent/AR070629A1/en active IP Right Grant
Patent Citations (6)
| Publication number | Priority date | Publication date | Assignee | Title |
|---|---|---|---|---|
| US5687098A (en) | 1995-10-30 | 1997-11-11 | Fisher Controls International, Inc. | Device data acquisition |
| US5966679A (en) | 1995-10-30 | 1999-10-12 | Fisher Controls International, Inc. | Method of and apparatus for nonobtrusively obtaining on-line measurements of a process control device parameter |
| US6466893B1 (en) | 1997-09-29 | 2002-10-15 | Fisher Controls International, Inc. | Statistical determination of estimates of process control loop parameters |
| US6609036B1 (en) * | 2000-06-09 | 2003-08-19 | Randall L. Bickford | Surveillance system and method having parameter estimation and operating mode partitioning |
| JP2003091620A (en) * | 2001-09-19 | 2003-03-28 | Kao Corp | Statistical information compiling device |
| US20050107962A1 (en) * | 2003-11-19 | 2005-05-19 | Honeywell International Inc. | Apparatus and method for identifying possible defect indicators for a valve |
Non-Patent Citations (2)
| Title |
|---|
| "Valve Monitor Diagnostics for Positioners SRD960 / SRD991", 2006, USA, pages 1 - 8, XP002524693, Retrieved from the Internet <URL:http://www.ips.invensys.com/en/products/measurement/Documents/Valve%20Positioner/valve_positioner_brochure.pdf> [retrieved on 20090422] * |
| I. NIEMELÄ: "Open FDT/DTM software technology enhances diagnostics and optimises control valve performance", October 2005 (2005-10-01), pages 79 - 85, XP002524692, Retrieved from the Internet <URL:http://www.metsoautomation.com/automation/web_articles_valves.nsf/WebWID/WTB-051128-22570-14043/$File/Open%20FDT-DTM.pdf> [retrieved on 20090422] * |
Also Published As
| Publication number | Publication date |
|---|---|
| CN101960402A (en) | 2011-01-26 |
| WO2009108414A1 (en) | 2009-09-03 |
| MX2010009515A (en) | 2010-09-28 |
| EP2722720B1 (en) | 2019-08-21 |
| JP5781309B2 (en) | 2015-09-16 |
| US7996096B2 (en) | 2011-08-09 |
| AR070629A1 (en) | 2010-04-21 |
| BRPI0908377A2 (en) | 2015-08-04 |
| CA2713729C (en) | 2016-03-15 |
| CN101960402B (en) | 2014-08-27 |
| RU2483340C2 (en) | 2013-05-27 |
| JP2011513729A (en) | 2011-04-28 |
| EP2263132A1 (en) | 2010-12-22 |
| CA2713729A1 (en) | 2009-09-03 |
| RU2010138454A (en) | 2012-04-10 |
| US20090222124A1 (en) | 2009-09-03 |
Similar Documents
| Publication | Publication Date | Title |
|---|---|---|
| US7996096B2 (en) | Estimation of process control parameters over predefined travel segments | |
| CA2467340C (en) | Detection and discrimination of instabilities in control valves | |
| CA2380413C (en) | Statistical determination of estimates of process control loop parameters | |
| EP1019790B1 (en) | Method of and apparatus for nonobtrusively obtaining on-line measurements of a process control device parameter | |
| US9727433B2 (en) | Control valve diagnostics | |
| US7702401B2 (en) | System for preserving and displaying process control data associated with an abnormal situation | |
| US7660701B2 (en) | System and method for detecting an abnormal situation associated with a process gain of a control loop | |
| US11385616B2 (en) | Maximum force logging and operational performance prognostics for process control devices | |
| WO2008085706A1 (en) | Method and system for modeling behavior in a process plant | |
| US11275365B2 (en) | Integration of online and offline control valve data |
Legal Events
| Date | Code | Title | Description |
|---|---|---|---|
| PUAI | Public reference made under article 153(3) epc to a published international application that has entered the european phase |
Free format text: ORIGINAL CODE: 0009012 |
|
| AC | Divisional application: reference to earlier application |
Ref document number: 2263132 Country of ref document: EP Kind code of ref document: P |
|
| AK | Designated contracting states |
Kind code of ref document: A1 Designated state(s): AT BE BG CH CY CZ DE DK EE ES FI FR GB GR HR HU IE IS IT LI LT LU LV MC MK MT NL NO PL PT RO SE SI SK TR |
|
| 17P | Request for examination filed |
Effective date: 20141022 |
|
| RBV | Designated contracting states (corrected) |
Designated state(s): AT BE BG CH CY CZ DE DK EE ES FI FR GB GR HR HU IE IS IT LI LT LU LV MC MK MT NL NO PL PT RO SE SI SK TR |
|
| 17Q | First examination report despatched |
Effective date: 20160215 |
|
| STAA | Information on the status of an ep patent application or granted ep patent |
Free format text: STATUS: EXAMINATION IS IN PROGRESS |
|
| GRAP | Despatch of communication of intention to grant a patent |
Free format text: ORIGINAL CODE: EPIDOSNIGR1 |
|
| STAA | Information on the status of an ep patent application or granted ep patent |
Free format text: STATUS: GRANT OF PATENT IS INTENDED |
|
| INTG | Intention to grant announced |
Effective date: 20190228 |
|
| GRAS | Grant fee paid |
Free format text: ORIGINAL CODE: EPIDOSNIGR3 |
|
| GRAA | (expected) grant |
Free format text: ORIGINAL CODE: 0009210 |
|
| STAA | Information on the status of an ep patent application or granted ep patent |
Free format text: STATUS: THE PATENT HAS BEEN GRANTED |
|
| AC | Divisional application: reference to earlier application |
Ref document number: 2263132 Country of ref document: EP Kind code of ref document: P |
|
| AK | Designated contracting states |
Kind code of ref document: B1 Designated state(s): AT BE BG CH CY CZ DE DK EE ES FI FR GB GR HR HU IE IS IT LI LT LU LV MC MK MT NL NO PL PT RO SE SI SK TR |
|
| REG | Reference to a national code |
Ref country code: GB Ref legal event code: FG4D |
|
| REG | Reference to a national code |
Ref country code: CH Ref legal event code: EP |
|
| REG | Reference to a national code |
Ref country code: DE Ref legal event code: R096 Ref document number: 602009059582 Country of ref document: DE |
|
| REG | Reference to a national code |
Ref country code: AT Ref legal event code: REF Ref document number: 1170462 Country of ref document: AT Kind code of ref document: T Effective date: 20190915 |
|
| REG | Reference to a national code |
Ref country code: IE Ref legal event code: FG4D |
|
| REG | Reference to a national code |
Ref country code: LT Ref legal event code: MG4D |
|
| REG | Reference to a national code |
Ref country code: NL Ref legal event code: MP Effective date: 20190821 |
|
| PG25 | Lapsed in a contracting state [announced via postgrant information from national office to epo] |
Ref country code: LT Free format text: LAPSE BECAUSE OF FAILURE TO SUBMIT A TRANSLATION OF THE DESCRIPTION OR TO PAY THE FEE WITHIN THE PRESCRIBED TIME-LIMIT Effective date: 20190821 Ref country code: FI Free format text: LAPSE BECAUSE OF FAILURE TO SUBMIT A TRANSLATION OF THE DESCRIPTION OR TO PAY THE FEE WITHIN THE PRESCRIBED TIME-LIMIT Effective date: 20190821 Ref country code: SE Free format text: LAPSE BECAUSE OF FAILURE TO SUBMIT A TRANSLATION OF THE DESCRIPTION OR TO PAY THE FEE WITHIN THE PRESCRIBED TIME-LIMIT Effective date: 20190821 Ref country code: HR Free format text: LAPSE BECAUSE OF FAILURE TO SUBMIT A TRANSLATION OF THE DESCRIPTION OR TO PAY THE FEE WITHIN THE PRESCRIBED TIME-LIMIT Effective date: 20190821 Ref country code: PT Free format text: LAPSE BECAUSE OF FAILURE TO SUBMIT A TRANSLATION OF THE DESCRIPTION OR TO PAY THE FEE WITHIN THE PRESCRIBED TIME-LIMIT Effective date: 20191223 Ref country code: BG Free format text: LAPSE BECAUSE OF FAILURE TO SUBMIT A TRANSLATION OF THE DESCRIPTION OR TO PAY THE FEE WITHIN THE PRESCRIBED TIME-LIMIT Effective date: 20191121 Ref country code: NL Free format text: LAPSE BECAUSE OF FAILURE TO SUBMIT A TRANSLATION OF THE DESCRIPTION OR TO PAY THE FEE WITHIN THE PRESCRIBED TIME-LIMIT Effective date: 20190821 Ref country code: NO Free format text: LAPSE BECAUSE OF FAILURE TO SUBMIT A TRANSLATION OF THE DESCRIPTION OR TO PAY THE FEE WITHIN THE PRESCRIBED TIME-LIMIT Effective date: 20191121 |
|
| PG25 | Lapsed in a contracting state [announced via postgrant information from national office to epo] |
Ref country code: ES Free format text: LAPSE BECAUSE OF FAILURE TO SUBMIT A TRANSLATION OF THE DESCRIPTION OR TO PAY THE FEE WITHIN THE PRESCRIBED TIME-LIMIT Effective date: 20190821 Ref country code: LV Free format text: LAPSE BECAUSE OF FAILURE TO SUBMIT A TRANSLATION OF THE DESCRIPTION OR TO PAY THE FEE WITHIN THE PRESCRIBED TIME-LIMIT Effective date: 20190821 Ref country code: IS Free format text: LAPSE BECAUSE OF FAILURE TO SUBMIT A TRANSLATION OF THE DESCRIPTION OR TO PAY THE FEE WITHIN THE PRESCRIBED TIME-LIMIT Effective date: 20191221 Ref country code: GR Free format text: LAPSE BECAUSE OF FAILURE TO SUBMIT A TRANSLATION OF THE DESCRIPTION OR TO PAY THE FEE WITHIN THE PRESCRIBED TIME-LIMIT Effective date: 20191122 |
|
| REG | Reference to a national code |
Ref country code: AT Ref legal event code: MK05 Ref document number: 1170462 Country of ref document: AT Kind code of ref document: T Effective date: 20190821 |
|
| PG25 | Lapsed in a contracting state [announced via postgrant information from national office to epo] |
Ref country code: TR Free format text: LAPSE BECAUSE OF FAILURE TO SUBMIT A TRANSLATION OF THE DESCRIPTION OR TO PAY THE FEE WITHIN THE PRESCRIBED TIME-LIMIT Effective date: 20190821 |
|
| PG25 | Lapsed in a contracting state [announced via postgrant information from national office to epo] |
Ref country code: DK Free format text: LAPSE BECAUSE OF FAILURE TO SUBMIT A TRANSLATION OF THE DESCRIPTION OR TO PAY THE FEE WITHIN THE PRESCRIBED TIME-LIMIT Effective date: 20190821 Ref country code: AT Free format text: LAPSE BECAUSE OF FAILURE TO SUBMIT A TRANSLATION OF THE DESCRIPTION OR TO PAY THE FEE WITHIN THE PRESCRIBED TIME-LIMIT Effective date: 20190821 Ref country code: EE Free format text: LAPSE BECAUSE OF FAILURE TO SUBMIT A TRANSLATION OF THE DESCRIPTION OR TO PAY THE FEE WITHIN THE PRESCRIBED TIME-LIMIT Effective date: 20190821 Ref country code: PL Free format text: LAPSE BECAUSE OF FAILURE TO SUBMIT A TRANSLATION OF THE DESCRIPTION OR TO PAY THE FEE WITHIN THE PRESCRIBED TIME-LIMIT Effective date: 20190821 Ref country code: RO Free format text: LAPSE BECAUSE OF FAILURE TO SUBMIT A TRANSLATION OF THE DESCRIPTION OR TO PAY THE FEE WITHIN THE PRESCRIBED TIME-LIMIT Effective date: 20190821 Ref country code: IT Free format text: LAPSE BECAUSE OF FAILURE TO SUBMIT A TRANSLATION OF THE DESCRIPTION OR TO PAY THE FEE WITHIN THE PRESCRIBED TIME-LIMIT Effective date: 20190821 |
|
| PG25 | Lapsed in a contracting state [announced via postgrant information from national office to epo] |
Ref country code: SK Free format text: LAPSE BECAUSE OF FAILURE TO SUBMIT A TRANSLATION OF THE DESCRIPTION OR TO PAY THE FEE WITHIN THE PRESCRIBED TIME-LIMIT Effective date: 20190821 Ref country code: IS Free format text: LAPSE BECAUSE OF FAILURE TO SUBMIT A TRANSLATION OF THE DESCRIPTION OR TO PAY THE FEE WITHIN THE PRESCRIBED TIME-LIMIT Effective date: 20200224 Ref country code: CZ Free format text: LAPSE BECAUSE OF FAILURE TO SUBMIT A TRANSLATION OF THE DESCRIPTION OR TO PAY THE FEE WITHIN THE PRESCRIBED TIME-LIMIT Effective date: 20190821 |
|
| REG | Reference to a national code |
Ref country code: DE Ref legal event code: R097 Ref document number: 602009059582 Country of ref document: DE |
|
| PLBE | No opposition filed within time limit |
Free format text: ORIGINAL CODE: 0009261 |
|
| STAA | Information on the status of an ep patent application or granted ep patent |
Free format text: STATUS: NO OPPOSITION FILED WITHIN TIME LIMIT |
|
| PG2D | Information on lapse in contracting state deleted |
Ref country code: IS |
|
| REG | Reference to a national code |
Ref country code: DE Ref legal event code: R119 Ref document number: 602009059582 Country of ref document: DE |
|
| 26N | No opposition filed |
Effective date: 20200603 |
|
| PG25 | Lapsed in a contracting state [announced via postgrant information from national office to epo] |
Ref country code: SI Free format text: LAPSE BECAUSE OF FAILURE TO SUBMIT A TRANSLATION OF THE DESCRIPTION OR TO PAY THE FEE WITHIN THE PRESCRIBED TIME-LIMIT Effective date: 20190821 Ref country code: MC Free format text: LAPSE BECAUSE OF FAILURE TO SUBMIT A TRANSLATION OF THE DESCRIPTION OR TO PAY THE FEE WITHIN THE PRESCRIBED TIME-LIMIT Effective date: 20190821 |
|
| REG | Reference to a national code |
Ref country code: CH Ref legal event code: PL |
|
| REG | Reference to a national code |
Ref country code: BE Ref legal event code: MM Effective date: 20200131 |
|
| PG25 | Lapsed in a contracting state [announced via postgrant information from national office to epo] |
Ref country code: DE Free format text: LAPSE BECAUSE OF NON-PAYMENT OF DUE FEES Effective date: 20200801 Ref country code: LU Free format text: LAPSE BECAUSE OF NON-PAYMENT OF DUE FEES Effective date: 20200116 |
|
| PG25 | Lapsed in a contracting state [announced via postgrant information from national office to epo] |
Ref country code: LI Free format text: LAPSE BECAUSE OF NON-PAYMENT OF DUE FEES Effective date: 20200131 Ref country code: CH Free format text: LAPSE BECAUSE OF NON-PAYMENT OF DUE FEES Effective date: 20200131 Ref country code: BE Free format text: LAPSE BECAUSE OF NON-PAYMENT OF DUE FEES Effective date: 20200131 |
|
| PG25 | Lapsed in a contracting state [announced via postgrant information from national office to epo] |
Ref country code: IE Free format text: LAPSE BECAUSE OF NON-PAYMENT OF DUE FEES Effective date: 20200116 |
|
| PG25 | Lapsed in a contracting state [announced via postgrant information from national office to epo] |
Ref country code: MT Free format text: LAPSE BECAUSE OF FAILURE TO SUBMIT A TRANSLATION OF THE DESCRIPTION OR TO PAY THE FEE WITHIN THE PRESCRIBED TIME-LIMIT Effective date: 20190821 Ref country code: CY Free format text: LAPSE BECAUSE OF FAILURE TO SUBMIT A TRANSLATION OF THE DESCRIPTION OR TO PAY THE FEE WITHIN THE PRESCRIBED TIME-LIMIT Effective date: 20190821 |
|
| PG25 | Lapsed in a contracting state [announced via postgrant information from national office to epo] |
Ref country code: MK Free format text: LAPSE BECAUSE OF FAILURE TO SUBMIT A TRANSLATION OF THE DESCRIPTION OR TO PAY THE FEE WITHIN THE PRESCRIBED TIME-LIMIT Effective date: 20190821 |
|
| P01 | Opt-out of the competence of the unified patent court (upc) registered |
Effective date: 20230526 |
|
| PGFP | Annual fee paid to national office [announced via postgrant information from national office to epo] |
Ref country code: GB Payment date: 20231219 Year of fee payment: 16 |
|
| PGFP | Annual fee paid to national office [announced via postgrant information from national office to epo] |
Ref country code: FR Payment date: 20231219 Year of fee payment: 16 |