US5545887A - Method and apparatus for decoding bar code symbols using subpixel scan lines - Google Patents
Method and apparatus for decoding bar code symbols using subpixel scan lines Download PDFInfo
- Publication number
- US5545887A US5545887A US08/328,518 US32851894A US5545887A US 5545887 A US5545887 A US 5545887A US 32851894 A US32851894 A US 32851894A US 5545887 A US5545887 A US 5545887A
- Authority
- US
- United States
- Prior art keywords
- symbol
- pixel
- bar code
- scan line
- bar
- Prior art date
- Legal status (The legal status is an assumption and is not a legal conclusion. Google has not performed a legal analysis and makes no representation as to the accuracy of the status listed.)
- Expired - Lifetime
Links
Images


Classifications
-
- G—PHYSICS
- G06—COMPUTING; CALCULATING OR COUNTING
- G06K—GRAPHICAL DATA READING; PRESENTATION OF DATA; RECORD CARRIERS; HANDLING RECORD CARRIERS
- G06K7/00—Methods or arrangements for sensing record carriers, e.g. for reading patterns
- G06K7/10—Methods or arrangements for sensing record carriers, e.g. for reading patterns by electromagnetic radiation, e.g. optical sensing; by corpuscular radiation
- G06K7/10544—Methods or arrangements for sensing record carriers, e.g. for reading patterns by electromagnetic radiation, e.g. optical sensing; by corpuscular radiation by scanning of the records by radiation in the optical part of the electromagnetic spectrum
- G06K7/10821—Methods or arrangements for sensing record carriers, e.g. for reading patterns by electromagnetic radiation, e.g. optical sensing; by corpuscular radiation by scanning of the records by radiation in the optical part of the electromagnetic spectrum further details of bar or optical code scanning devices
- G06K7/10851—Circuits for pulse shaping, amplifying, eliminating noise signals, checking the function of the sensing device
Landscapes
- Physics & Mathematics (AREA)
- Electromagnetism (AREA)
- Engineering & Computer Science (AREA)
- Health & Medical Sciences (AREA)
- General Health & Medical Sciences (AREA)
- Toxicology (AREA)
- Artificial Intelligence (AREA)
- Computer Vision & Pattern Recognition (AREA)
- General Physics & Mathematics (AREA)
- Theoretical Computer Science (AREA)
- Image Processing (AREA)
- Compression Of Band Width Or Redundancy In Fax (AREA)
Abstract
A bar code reader decodes a bar code symbol in a pixel image by transforming the data corresponding to the symbol along a first scan line, where the transformation comprises rotation and stretching. The reader generates a composite vector and a count vector from the transformed data. The reader then transforms (by rotating and stretching) another set of data corresponding to the symbol along a second scan line. The reader updates the composite and count vectors using the second set of transformed data. The reader then generates a one-dimensional composite signal from the composite and count vectors. The reader decodes the symbol by decoding the composite signal.
Description
This is a divisional of copending application Ser. No. 08/011,642 filed on Jul. 29, 1993 now U.S. Pat. No. 5,384,451.
1. Field of the Invention
The present invention relates to image processing, and, in particular, to a method and apparatus for locating and decoding bar code symbols in pixel images.
2. Statement of Related Art
Reading bar code symbols with one-dimensional laser scanning systems is well known. Less well known are image processing systems for locating and decoding bar code symbols in two-dimensional pixel images. Decoding bar code symbols requires accurate measurement of edge-to-edge distances, where an edge corresponds to a transition from a bar to a space or from a space to a bar within a bar code symbol.
Of particular difficulty is the reading of high-density bar code symbols in facsimile-quality images, that is, images of bar code symbols generated by facsimile machines and the like. A bar code reader that can locate and decode bar code symbols in an image generated by a facsimile machine should be able to be adapted to read bar code symbols in an image generated by any other image source such as a scanner or a camera.
In a preferred embodiment, the present invention is a method and apparatus for reading a bar code symbol in a pixel image. According to this embodiment, a first scan line substantially parallel to the bars and spaces of the symbol is selected. The symbol is then scanned along the first scan line to generate a first value. A second scan line substantially parallel to the bars and spaces of the symbol is then selected, where the distance between the first and second scan lines is less than the width of a pixel of the image. The symbol is then scanned along the second scan line to generate a second value. The symbol is then decoded in accordance with the first and second values.
In an alternative preferred embodiment, the present invention is a method and apparatus for reading a bar code symbol in a pixel image. According to this embodiment, a first scan line crossing at least a first portion of the symbol is selected. The first portion is then transformed by rotating the first portion to an angle substantially parallel to either a row or column of pixels in the image and stretching the first portion. A composite signal is generated in accordance with the transformed first portion. A second scan line crossing at least a second portion of the symbol is selected. The second portion is then transformed by rotating the second portion to an angle substantially parallel to either a row or column of pixels in the image and stretching the second portion. The composite signal is updated in accordance with the transformed second portion and the symbol is decoded in accordance with the composite signal.
In another alternative preferred embodiment, the present invention is a method and apparatus for reading a bar code symbol in a pixel image. According to this embodiment, the symbol is transformed by rotating the symbol to an angle substantially parallel to either a row or column of pixels in the image and stretching the symbol. First and second scan lines substantially perpendicular to the bars and spaces of the transformed symbol are selected. A composite signal is then generated in accordance with the first and second scan lines and the symbol is decoded in accordance with the composite signal.
FIG. 1 is a functional block diagram of a bar code symbol reading system according to a preferred embodiment of the present invention;
FIG. 2 is a block flow diagram of processing implemented by the symbol locator of the system of FIG. 1 to locate bar code symbols in a pixel image;
FIG. 3 is a block flow diagram of processing implemented by the symbol locator of FIG. 2 to locate candidate bar code symbols in binary images;
FIG. 4 is an image of a bar code symbol located by the symbol locator of FIG. 2;
FIG. 5 is an image of a bar code symbol in which the trailing bar is broken into two segments;
FIG. 6 is a block flow diagram of a slow method implemented by a preferred embodiment of the composite signal generator of the system of FIG. 1 for generating a composite signal of a bar code symbol;
FIG. 7 is an image of a bar code symbol showing the sample rectangle over which the symbol is analyzed by the composite and gradient signal generators of the system of FIG. 1;
FIG. 8 is an image of a portion of the bar code symbol of FIG. 7 showing some of the scan lines used by the composite signal generator of the system of FIG. 1 in implementing the slow method of FIG. 6;
FIG. 9 is a block flow diagram of a slow method implemented by a preferred embodiment of the composite signal generator of the system of FIG. 1 for generating a composite signal of a bar code symbol;
FIG. 10 is an image of the bar code symbol of FIG. 7 showing scan lines used by the composite signal generator of the system of FIG. 1 in implementing the fast method of FIG. 9;
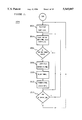
FIG. 11 is a block flow diagram of the processing implemented by the composite signal thresholder of the system of FIG. 1 to threshold the composite signal of a bar code symbol;
FIG. 12 depicts the binary representation of part of a bar code symbol signal with a spurious bar;
FIG. 13 depicts the binary representation of part of a bar code symbol signal with either a spurious bar or a spurious space;
FIG. 14 is a block flow diagram of the processing implemented by the composite signal decoder of the system of FIG. 1 to decode the characters of a Code 39 bar code symbol;
FIG. 15 is a block flow diagram of the processing implemented by the gradient signal generator of the system of FIG. 1 to generate whitening and blackening gradient signals for a bar code symbol; and
FIG. 16 is a block flow diagram of the processing implemented by the gradient signal processor of the system of FIG. 1 to process whitening and blackening gradient signals.
Referring to FIG. 1, there is shown a functional block diagram of bar code symbol reading system 100 according to a preferred embodiment of the present invention. System 100 locates and decodes bar code symbols with unknown positions and orientations in two-dimensional pixel images. System 100 may be designed to locate and decode bar code symbols in either binary images or gray-scale images.
According to one process, composite signal generator 106 generates a composite signal corresponding to the bar code symbol. Composite signal thresholder 108 then thresholds and filters the composite signal to generate a binary signal corresponding to the composite signal. Composite signal decoder 110 then decodes the bar code symbol by decoding the binary signal. If signal decoder 110 successfully decodes the bar code symbol, decoder 110 transmits the decoded signal to output selector 118. Otherwise, signal decoder 110 transmits a signal to output selector 118 indicating that the decoding was unsuccessful.
According to the other process for decoding each located bar code symbol, gradient signal generator 112 generates two gradient signals from the located bar code symbol. Gradient signal processor 114 processes the two gradient signals to generate a binary reconstructed signal. Gradient signal decoder 116 then decodes the bar code symbol by decoding the reconstructed signal. If signal decoder 116 successfully decodes the bar code symbol, decoder 116 transmits the decoded signal to output selector 118. Otherwise, signal decoder 116 transmits a signal to output selector 118 indicating that the decoding was unsuccessful.
In a preferred embodiment, composite signal decoder 110 and gradient signal decoder 116 perform identical decoding algorithms on the binary signals received from composite signal thresholder 108 and gradient signal processor 114, respectively.
Referring now to FIG. 2, there is shown a block flow diagram for the processing implemented by symbol locator 104 of system 100. Symbol locator 104 locates a bar code symbol in a pixel image by searching for a bar code symbol quiet zone that is followed by a minimum number of transitions between symbol bars and spaces. On each end of a bar code symbol in a pixel image is a region of bright pixels called a quiet zone. The symbol itself is comprised of a sequence of dark bars separated by bright spaces.
According to a preferred embodiment, means 202 of symbol locator 104 selects a new search line in the pixel image. A search line may be either a row or column of the pixel image. Means 202 may select search lines employing a binary search such as that described U.S. patent application Ser. No. 07/927,910, U.S. Pat. No. 5,343,028 entitled "Method and Apparatus for Detecting and Decoding Bar Code Symbols," filed on Aug. 10, 1992, which is commonly owned by the present assignee and the disclosure of which is incorporated herein in its entirety by reference. A suitable system for selecting search lines using a binary search is described in the section of the '910 application entitled "Detecting and Decoding Bar Code Symbols." In general, since a bar code symbol typically spans multiple rows and columns in the pixel image, means 202 preferably selects rows in a sequence employing a broad pattern that gets finer as processing proceeds.
Table I presents a preferred sequence for selecting rows (or analogously columns) in a pixel image having, for example, 2048 columns and 4096 rows. In the preferred sequence, the selection of rows as search lines starts at row number 64 with a step size of 64. After selecting rows (64, 128, 192, . . . , 4032, 4096), the sequence returns to row number 32 with the same 64-row step size. The selection continues as indicated in Table I. After selecting rows (4, 12, 20, . . . , 4084, 4092), the entire sequence will have selected every fourth row in the image without repeating any row twice.
              TABLE I
______________________________________
Row Step    Starting Row
                       Sequence of
Size        Number     Rows
______________________________________
64          64         (64, 128,. . . ,4096)
64          32         (32, 96,. . . ,4064)
32          16         (16, 48,. . . ,4080)
16          8           (8, 24,. . . ,4088)
8           4           (4, 12,. . . ,4092)
______________________________________
A sequence of selecting search rows such as that in Table I typically increases the speed and efficiency of system 100. Those skilled in the art will understand that such a sequence may be varied depending on the characteristics of the pixel images to be processed.
In a preferred embodiment, if the pixel image contains a known number of bar code symbols, the search sequence is terminated after the requisite number of bar code symbols have been located and decoded. In addition, system 100 preferably keeps track of the areas of the image that contain bar code symbols that have already been located and decoded. Symbol locator 104 preferably ignores those areas that have already been processed.
After locating the first dark pixel following a candidate quiet zone, means 204 checks whether that dark pixel is contained in a bar code symbol that has already been located and decoded by system 100. If so, then the candidate bar code symbol is rejected, since it has already been processed.
In addition, while counting the number of bright/dark transitions, means 204 checks the width of each candidate bar and space. If any candidate bar/space is too wide (i.e., exceeds a specified maximum bar/space threshold), then the candidate symbol is rejected and a new search for a candidate bar code symbol quiet zone is started.
After locating a candidate bar code symbol along a selected search line (i.e., after locating a candidate quiet zone followed by a minimum number of candidate bars and spaces), means 204 verifies the candidate symbol by repeating the quiet-zone searching and bar/space transition counting along one or more neighboring rows/columns in the pixel image.
Referring now to FIG. 3, there is shown a block flow diagram of the processing implemented by means 204 of symbol locator 104 to locate candidate bar code symbols when the pixel image is a binary image. In a binary image, each pixel is represented by a single bit, where, for example, a "1" corresponds to a bright pixel and a "0" corresponds to a dark pixel. In a preferred embodiment, means 204 performs byte-based searching for quiet zones and byte-based counting of bar/space transitions, where eight consecutive binary pixels in the pixel image are treated as a single byte of image data.
Each entry in each table represents three values: (a) the number of lead (left-most) pixels that are the same "color" (i.e., black or white) as the previous pixel, (b) the number of trailing (right-most) pixels (including the last pixel) that are the same color as the last pixel in the byte, and (c) the number of transitions within the eight-pixel byte (including any transition from the previous pixel).
For example, in the (previous pixel=1) table, the byte "01100110" has (a) "0" as the number of lead pixels that are the same color as the previous pixel, (b) "1" as the number of trailing pixels that are the same color as the last pixel, and (c) "5" as the number of transitions within the byte. In the (previous pixel=0) table, the byte "01100110" has (a) "1" as the number of lead pixels that are the same color as the previous bit, (b) "1" as the number of trailing pixels that are the same color as the last pixel, and (c) "4" as the number of transitions within the byte.
For example, assume that a sequence of image bytes along a selected search line is ("00011011", "01101101", "11001100", "00000111"). Assume further that the previous pixel for the first byte in the sequence was "0". After the first byte, the running count of the number of transitions is 3. The second byte adds another 6 transitions to the running count, for a total of 9. The third byte adds another 3 transitions, for a total of 12. The fourth byte adds another 1 transition, for a total of 13.
As each byte is processed, means 308 determines whether any bar or space is too wide by continuously incrementing and monitoring a current bar/space size counter. For any given pixel along a selected search line, this size counter represents the number of consecutive pixels sharing the same color as the given pixel and which also immediately precede the given pixel along the search line. If a bar/space width is greater than a specified maximum bar/space width (i.e., if the size counter exceeds a specified threshold), then the candidate symbol is rejected and means 308 directs processing to return to means 302 to restart byte-based searching for a candidate quiet zone. Otherwise, processing continues to means 310.
Referring again to the exemplary sequence of image bytes described two paragraphs above, when the color changes from bright to dark in between the end of the first byte and the beginning of the second byte, the current bar/space size counter is reset to zero at this point along the search line. When the fourth byte is processed, the number of trailing pixels of the same color (2) from the third byte is increased by the number of leading pixels of the same color as the previous pixel (5) to yield a current bar/space size of 7 pixels.
If, in a particular application, the specified maximum bar/space width is greater than five pixels, then the preceding discussion applies. If, however, the specified maximum bar/space width is five pixels or less, then special processing may be required. For example, if the maximum bar width is five pixels, then the byte "10000001" would correspond to a bar six pixels wide. Those skilled in the art will understand that this situation may be handled by manipulating the entries in the two tables for that byte. For example, if the numbers of leading pixels of the same color as the previous pixel stored in both tables for byte "10000001" were stored as six, then the processing described above would handle this particular situation.
As each byte is processed, means 310 determines whether the running count of the number of transitions exceeds a specified threshold, for example, 30. If so, then a candidate bar code symbol is recognized and processing continues to means 312; otherwise, processing returns to means 306 to continue the byte-based counting of transitions.
Processing reaches means 312 when a candidate bar code symbol is recognized. Means 312 verifies the candidate symbol by repeating the byte-based quiet-zone searching and transition counting of means 302 through means 310 along selected neighboring search lines. Means 312 preferably selects three parallel neighboring search lines on each side of the original search line.
When the original search line is an image row, the neighboring search lines are preferably every second or third row. For example, if row 40 is the original search line, means 312 may select rows 31, 34, 37, 43, 46, 49 as the six neighboring search lines.
Similarly, means 312 selects the ending column for each neighboring search line by moving from the first dark pixel to the right by a distance equivalent to the length of the maximum expected bar code symbol plus two minimum quiet zones. Continuing with the previous example, if the maximum symbol length is 300 pixels, then means 312 will end searching at column (1000+300+64) or 1364 of each neighboring search line. In a preferred embodiment, a candidate bar code symbol is verified if at least three of the six neighboring search lines contain the same candidate symbol. For a neighboring search line to contain the same candidate symbol, the first black pixel in the neighboring search line must be at a column within one-half of a minimum quiet zone from the column that contained the first black pixel along the original search line.
Those skilled in the art will understand that means 312 makes analogous selections when search lines are columns. It will also be understood that this preferred process of selecting neighboring search lines is designed to process images having bar code symbols of random orientation. Those skilled in the art will recognize that byte-based quiet-zone searching and transition counting can be implemented in systems having other than eight bits (i.e., pixels) per byte.
Referring again to FIG. 2, if a bar code symbol is located and verified, means 206 of symbol locator 104 directs processing to corner locator 208; otherwise, processing continues to means 214.
The particular embodiment of byte-based searching for bar code symbols in pixel images described in this section of this specification pertains to the processing of only binary pixel images. Those skilled in the art will understand that all other features of system 100 disclosed in this specification pertain to the processing of either binary or gray-scale pixel images.
Referring now to FIG. 4, there is shown an image of bar code symbol 400 located by means 204, where pixel 402 is the first dark pixel along the original search line. Briefly put, the corner-finding algorithm described in U.S. patent application Ser. No. 07/927,910 comprises the following steps:
(1) "Crawling" clockwise along outside edge 406 of leading bar 410 of bar code symbol 400 from first dark pixel 402 until the end of bar 410 is detected. The end of a bar is detected as a change in the crawling direction greater than a specified threshold. Such a change corresponds to crawling around a corner rather than along a line. This step locates upper left-hand corner 408 of symbol 400;
(2) Crawling counter-clockwise along leading bar 410 to locate lower left-hand corner 426 of symbol 400;
(3) Projecting perpendicular line 412 from center pixel 404 of leading bar 410 across symbol 400, as determined from corners 408 and 426;
(4) Searching along perpendicular line 412 from left to right starting at center pixel 404 for quiet zone 418 at the far end of symbol 400;
(5) Searching along perpendicular line 412 from right to left starting in quiet zone 418 for last dark pixel 420 at the far end of symbol 400;
(6) Crawling counter-clockwise along outer edge 422 of trailing bar 414 to locate upper right-hand corner 416 of symbol 400; and
(7) Crawling clockwise along trailing bar 414 to locate lower right-hand corner 424 of symbol 400.
In addition to these seven steps of the corner-finding algorithm disclosed in the '910 application, corner locator 208 preferably verifies the accuracy of the located corners by performing the following additional steps, not disclosed in the '910 application:
(8) Verifying that the line segment defined by first dark pixel 402 and corner 408 and the line segment defined by first dark pixel 402 and corner 426 are sufficiently co-linear;
(9) Verifying that the line segment defined by last dark pixel 420 and corner 416 and the line segment defined by last dark pixel 420 and corner 424 are sufficiently co-linear; and
(10) Verifying that the line segment defined by corners 408 and 426 and the line segment defined by corners 416 and 424 are sufficiently parallel.
The candidate bar code symbol is rejected if the relevant line segments in steps (8), (9), or (10) are not sufficiently parallel. Two line segments are sufficiently parallel if the difference between their slopes is within a specified threshold. Since the relevant line segments of steps (8) and (9) share a common point (i.e., first dark pixel 402 and last dark pixel 420, respectively), the test for parallelism is equivalent to the test for co-linearity. In a preferred embodiment, corner locator 208 determines the (row, column) coordinates in the pixel image of the four located corners 408, 426, 416, and 424 of bar code symbol 400.
After corner locator 208 locates four corners for the bar code symbol, means 210 corrects the location of at least one of the four corners. The four corners selected by corner locator 208 define a quadrilateral. However, a bar code symbol is ideally defined by a rectangle--a particular type of quadrilateral. For one or more reasons, the quadrilateral defined by the four corners identified by corner locator 208 may not be a rectangle.
For example, if the leading or trailing bar is broken into two or more segments in the image, one side of the located quadrilateral may be shorter than the opposite side. Line noise in the transmission of a run-length-encoded facsimile may result in such breaks in the bars. Such line noise may also result in extensions to the bars. In either case, the location of corners may be inaccurate. Alternatively, the actual label containing the imaged bar code symbol may be physically degraded such that the bars are not complete.
Referring now to FIG. 5, there is shown an image of a bar code symbol in which the trailing bar is broken into two segments. Corner locator 208 locates corners A, B, C, and D having coordinates (Xa,Ya), (Xb,Yb), (Xc,Yc), and (Xd,Yd), respectively. Means 210 corrects the location of at least one of the located corners by constructing the "best" rectangle based on at least two of the other four located corners.
For each of the four corners, means 210 computes an error value E. For example, for corner B, the error value Eb is determined by: ##EQU1## where AC is the distance between corners A and C, AB is the distance between corners A and B, and BC is the distance between corners B and C. The greater the deviation from a ninety-degree right angle at corner B, the greater the error value Eb. Using similar equations, means 210 also calculates error values Ea, Ec, and Ed for corners A, C, and D, respectively.
Those skilled in the art will understand that means 210 may be used to correct the location of at least two corners. Where, as in the previous example, means 210 uses corners A and C to correct the location of corner B, means 210 may also use corners A and C to correct the location of corner D, if desired, using an equation analogous to Equation (1). In general, means 210 may correct any two diagonal corners using the remaining two corners.
Those skilled in the art will understand that alternative methods for correcting the locations of one or more corners are within the scope of the present invention. These alternative methods may rely on one or more of the following properties of rectangles (i.e., the ideal bar code symbol shape):
Opposite sides of a rectangle are parallel;
Opposite sides are of equal length;
Diagonals are of equal length;
Corner angles are 90 degrees; and
Diagonals and their corresponding sides satisfy the Pythagorean theorem.
In addition, means 210 preferably performs geometry tests to verify that the size and shape of the squared bar code symbol are within specified thresholds. These geometry tests are based on the relative locations of the four symbol corners.
After means 210 squares the symbol, means 212 transmits the (row, column) coordinates of the four corners of the "corrected" symbol to composite signal generator 106 and gradient-based signal generator 112 of FIG. 1. Processing of symbol locator 104 then continues to means 214 to determine whether the end of the current search line has been reached. If so, processing returns to means 202 to select a new search line. Otherwise, processing returns to means 204 to continue the search along the current search line. Symbol locator 104 continues to attempt to locate bar code symbols until the specified search line sequence has been exhausted or some other stop condition is satisfied.
Referring now to FIG. 6, there is shown a block flow diagram of a slow method implemented by composite signal generator 600. Composite signal generator 600 is a preferred embodiment of composite signal generator 106 of system 100 depicted in FIG. 1, where generator 600 is designed to implement the slow method for generating composite signals of bar code symbols. According to a preferred embodiment of the slow method, the bar code symbol is scanned along multiple scan lines.
The scan lines are determined from the symbol corners determined by symbol locator 104. For the slow method of generating composite signals, each scan line is parallel to the bars and spaces of the symbol. In addition, successive scan lines are separated from each other by a distance of less than one pixel width. When a bar code symbol is not aligned with the rows and columns of the pixel image, the scan lines will not correspond to image rows or columns. Thus, scan lines for the slow method of generating composite signals generally differ from the "search lines" used by symbol locator 104, which always correspond to either a row or column in the pixel image.
For each scan line, generator 600 averages the pixel intensities along the scan line to generate a pixel in a one-dimensional composite signal. By making the distance between successive scan lines less than one pixel, generator 600 oversamples the pixel image when generating the composite signal.
Referring now to FIG. 7, there is shown an image of bar code symbol 700 processed by composite signal generator 600. Generator 600 receives the coordinates of corners 702, 704, 706, and 708 from symbol locator 104. To avoid sampling errors common at the ends of symbol bars, generator 600 identifies a sample rectangle 710 defined by corners 712, 714, 716, and 718. Sample rectangle 710 is defined to be slightly (e.g., 3%) lower than the top of symbol 700, slightly (e.g., 3%) higher than the bottom of symbol 700, and slightly longer than symbol 700 (e.g., by a specified distance into each quiet zone). The lengths of each scan line are then defined by the boundaries of sample rectangle 710 and, as a result, each scan line (which, by definition, is parallel to the bars and spaces of symbol 700) starts above the bottom and below the top of symbol 700.
Referring again to FIG. 6, means 602 of composite signal generator 600 selects a sequence of parallel scan lines based on sample rectangle 710. Means 602 starts with the scan line defined by corners 712 and 718 at one end of sample rectangle 710 and selects each new scan line by shifting from the previous scan line toward the other end of sample rectangle 710 by a specified distance, where the specified distance is less than the width of a pixel.
Referring now to FIG. 8, a portion of bar code symbol 700 is shown with several scan lines 802 superimposed thereon. For each scan line 802, means 604 scans the symbol image along the currently selected scan line and means 606 generates the average pixel intensity value of the pixels that lie along that scan line. Means 608 saves the average value as a pixel in a one-dimensional composite signal. Means 610 determines whether the current scan line is the last scan line, i.e., whether the opposite end of sample rectangle 710 defined by corners 714 and 716 has been reached. If not, then processing returns to means 602 to select the next scan line. Otherwise, means 612 transmits the complete composite signal to composite signal thresholder 108 of system 100 for further processing. The processing of thresholder 108 is described later in this specification in conjunction with FIG. 11.
Referring now to FIG. 9, there is shown a block flow diagram of a fast method implemented by composite signal generator 900. Composite signal generator 900 is a preferred embodiment of composite signal generator 106 of system 100 depicted in FIG. 1, where generator 900 is designed to implement the fast method for generating composite signals of bar code symbols. The fast method is a preferred alternative to the slow method described earlier in this specification in conjunction with FIGS. 6, 7, and 8.
According to a preferred embodiment of the fast method, generator 900 selects a set of scan lines from the rows/columns in the pixel image that cross the bar code symbol. Note that, for the fast method, scan lines always correspond to either a row or column of the pixel image. As described earlier in this specification in conjunction with FIG. 6, for the slow methods, scan lines need not and generally will not coincide with a row or column of the pixel image.
For each scan line, generator 900 rotates and stretches the scan line data. Using the stretched, rotated data, generator 900 updates a one-dimensional composite vector and a one-dimensional count vector. After all the selected scan lines have been processed, generator 900 "normalizes" the one-dimensional vector to yield a one-dimensional composite signal for the bar code symbol.
Referring now to FIG. 10, there is shown an image of the bar code symbol of FIG. 7 with scan lines 1-6 used by composite signal generator 900 to implement the fast method of generating a composite signal superimposed thereon. Means 902 selects a sequence of scan lines. As shown in FIG. 10, each scan line crosses the bar code symbol and is part of a row (or column) of the pixel image. Means 902 need not select every row (or column) that crosses the bar code symbol. Thus, successive scan lines may be separated by more than one pixel. In addition, a scan line need not cross the entire bar code symbol. For example, in FIG. 10, only scan lines 3 and 4 cross the entire symbol.
The degree to which means 904 stretches the scan line data is determined by the oversampling rate, a specified parameter value, for example, three. Stretching the data in the fast method is similar to the selection of scan lines in the slow method that are separated by subpixel distances. Both the fast and slow methods are designed to oversample the original pixel image data.
Tables II through VI present an example of the processing performed by composite signal generator 900. The purpose of the discussion of these tables is to demonstrate the processing implemented by generator 900 and is not necessarily intended to represent a realistic situation. Note that lists (I), (J), (K), and (L) of Tables III, IV, and V will be discussed later in this specification in conjunction with the discussion of FIG. 15 and gradient signal generator 112.
Table II contains the original pixel intensity data for three scan lines of a gray-scale pixel image, where scan line # 1 corresponds to row 0 of the image, scan line # 2 corresponds to row 2, and scan line # 3 corresponds to row 4. In this example, the higher the pixel intensity value, the brighter the pixel. Each scan line of Table II begins at column 0 and ends at column 9 of the pixel image. Thus, for example, the intensity of the pixel at (row=2) and (column=5) is 3. In this example, it has been determined, based upon the four corners located by symbol locator 104, that the bar code symbol is oriented at a counter-clockwise 45-degree angle to the image rows.
TABLE II
______________________________________
Original Image Data.
Scan Line
# 1 #2 #3
Row Row Row
Col 0 2 4
______________________________________
0 21 22 22
1 23 21 19
2 22 22 5
3 21 5 4
4 22 6 3
5 18 3 15
6 6 16 18
7 4 18 17
8 5 16 20
9 14 18 5
______________________________________
Table III presents the results from generator 900 processing scan line #1 (row 0). List (A) of Table III contains the original column number for each pixel in the pixel image along scan line # 1. List (B) contains the intensity of each original pixel. List (C) contains the rotated column number (a real value) after means 904 rotates each original pixel by θ degrees, where, in this example, θ is 45 degrees. The rotated column number Cr is determined by:
C.sub.r =C.sub.o cosθ+R.sub.o sinθ, (2)
where Co is the original column number and Ro is the original row number for the pixel in the pixel image.
                                  TABLE III
__________________________________________________________________________
Processing scan Line #1 (Row 0).
      (C)
         (D) (E)   (G)
                      (H)
                         (I)
                            (J)
                               (K)
                                  (L)
(A)
   (B)
      Rot
         Str Rnd
                (F)
                   Cmp
                      Ct Wht
                            Wht
                               Blk
                                  Blk
Col
   Int
      Col
         Col Col
                Int
                   Vec
                      Vec
                         Grad
                            Vec
                               Grad
                                  Vec
__________________________________________________________________________
0  21 0.00
         0.00
             0  21 21 1  0  0  0  0
             1  21 21 1  0  0  0  0
1  23 0.71
         2.12
             2  23 23 1  2  2  0  0
             3  23 23 1  2  2  0  0
2  22 1.41
         4.24
             4  22 22 1  0  0  1  1
             5  22 22 1  0  0  1  1
3  21 2.12
         6.36
             6  21 21 1  0  0  1  1
             7  21 21 1  0  0  1  1
4  22 2.83
         8.49
             8  22 22 1  1  1  0  0
             9  22 22 1  1  1  0  0
             10 22 22 1  1  1  0  0
5  18 3.54
         10.61
             11 18 18 1  0  0  4  4
             12 18 18 1  0  0  4  4
6  6  4.24
         12.73
             13 6  6  1  0  0  12 12
             14 6  6  1  0  0  12 12
7  4  4.95
         14.85
             15 4  4  1  0  0  2  2
             16 4  4  1  0  0  2  2
8  5  5.66
         16.97
             17 5  5  1  1  1  0  0
             18 5  5  1  1  1  0  0
9  14 6.36
         19.09
             19 14 14 1  9  9  0  0
             20 14 14 1  9  9  0  0
__________________________________________________________________________
 KEY
 (A): Column of pixel in original image
 (B): Intensity of pixel in original image
 (C): Column (real value) of pixel after rotation
 (D): Column (real value) of pixel after rotation and stretching
 (E): Column (rounded value) of rotated, stretched pixel
 (F): Intensity of rotated, stretched pixel
 (G): Corresponding value in composite vector
 (H): Corresponding value in count vector
 (I): Whitening gradient for current scan line
 (J): Corresponding value in whitening gradient vector
 (K): Blackening gradient for current scan line
 (L): Corresponding value in blackening gradient vector
List (D) of Table III contains the stretched column number (a real value) after means 904 stretches each rotated pixel by the oversampling rate. This example is based on an oversampling rate of three. List (D) is the product of list (C) and the oversampling rate (three, in this example). List (E) contains the rounded column numbers (integer values) for the stretched and rotated data, as generated by means 904. For example, stretched column 8.49 from list (D) is rounded to rounded column 8 in list (E). Similarly, stretched column 10.61 from list (D) is rounded to rounded column 11 in list (E). List (E) also contains the column numbers falling between the rounded columns. Thus, column 7 falls between rounded columns 6 and 8, while columns 9 and 10 fall between rounded columns 8 and 11. For purposes of the following discussion, all of the elements of list (E) are collectively referred to as rounded columns.
List (F) contains an intensity value for each rounded column in list (E). For each rounded column of list (E), means 904 repeats the intensity value from the original column of list (A) corresponding thereto. For example, rounded columns 6 and 7 of list (E) correspond to column 3 of list (A) and, therefore, the corresponding intensities of list (F) for those rounded columns are 21.
In an alternative preferred embodiment, means 904 interpolates between rounded columns to determine the intensity values in list (F). In that embodiment, the intensity in list (F) corresponding to rounded column 7 of list (E) would be 21.5, the midpoint of the intensities corresponding to rounded columns 6 and 8 of list (E).
Those skilled in the art will understand that the rotating and stretching implemented by means 904 may be performed in a single computation based on matrix multiplication where the rotation matrix is modified to include the oversampling rate.
As means 904 rotates and stretches the data for each scan line, means 906 updates a one-dimensional composite vector and means 908 updates a one-dimensional count vector based on the stretched, rotated data. The composite vector represents the "sum" of all the previously stretched, rotated scan lines. The count vector keeps track of how many times each element of the composite vector has been updated. Referring again to the example of Table III, list (G) represents the composite vector and list (H) represents the count vector after scan line # 1 is processed.
After means 908 updates the count vector, means determines whether the current scan line is the last scan line to be processed. If so, processing continues to means 912; otherwise, processing returns to means 902 to select the next scan line. Since, in the example of Table II, row 0 (i.e., scan line #1) is not the last scan line, means 910 directs processing to return to means 902 to select row 2 as the new scan line.
Table IV presents the results from generator 900 processing scan line #2 (row 2) of Table II. Lists (A) through (H) of Table IV are analogous to those of Table III. Means 906 forms an updated composite vector (list (G) of Table IV) by summing pixel values from the prior composite vector (list (G) of Table III) with corresponding intensity values from list (F) of Table IV. Means 908 updates the count vector of list (H) by incrementing those elements that correspond to elements of the composite vector of list (G) that were updated.
                                  TABLE IV
__________________________________________________________________________
Processing scan Line #2 (Row 2).
      (C)
         (D) (E)   (G)
                      (H)
                         (I)
                            (J)
                               (K)
                                  (L)
(A)
   (B)
      Rot
         Str Rnd
                (F)
                   Cmp
                      Ct Wht
                            Wht
                               Blk
                                  Blk
Col
   Int
      Col
         Col Col
                Int
                   Vec
                      Vec
                         Grad
                            Vec
                               Grad
                                  Vec
__________________________________________________________________________
             0     21 1     0     0
             1     21 1     0     0
             2     23 1     2     0
             3     23 1     2     0
0  22 1.41
         4.24
             4  22 44 2  0  0  0  1
             5  22 44 2  0  0  0  1
1  21 2.12
         6.36
             6  21 42 2  0  0  1  2
             7  21 42 2  0  0  1  2
2  22 2.83
         8.49
             8  22 44 2  1  2  0  0
             9  22 44 2  1  2  0  0
             10 22 44 2  1  2  0  0
3  5  3.54
         10.61
             11 5  23 2  0  0  17 21
             12 5  23 2  0  0  17 21
4  6  4.24
         12.73
             13 6  12 2  1  1  0  12
             14 6  12 2  1  1  0  12
5  3  4.95
         14.85
             15 3  7  2  0  0  3  5
             16 3  7  2  0  0  3  5
6  16 5.66
         16.97
             17 16 21 2  13 14 0  0
             18 16 21 2  13 14 0  0
7  18 6.36
         19.09
             19 18 32 2  2  11 0  0
             20 18 32 2  2  11 0  0
8  16 7.07
         21.21
             21 16 16 1  0  0  2  2
             22 16 16 1  0  0  2  2
9  18 7.78
         23.33
             23 18 18 1  2  2  0  0
             24 18 18 1  2  2  0  0
__________________________________________________________________________
Note that none of the stretched, rotated data from scan line # 2 coincides with rounded columns 0-3, but that some of the data do coincide with new rounded columns 21-24. As a result, some elements of the composite vector are not updated. The count vector is used to keep track of how many times each element of the composite vector is updated. Those skilled in the art will understand that this non-uniform updating of composite and count vectors will also occur when processing scan lines that do not cross the entire bar code symbol, for example, scan line 1 of FIG. 10.
After processing scan line # 2, means 910 directs processing to return to means 902 to select scan line #3 (row 4), the last scan line of Table II. Table V presents the results from generator 900 processing scan line #3 (row 4) of Table II. Once again, lists (A) through (H) of Table V are analogous to those of Tables III and IV.
                                  TABLE V
__________________________________________________________________________
Processing Scan Line #3 (Row 4).
      (C)
         (D) (E)   (G)
                      (H)
                         (I)
                            (J)
                               (K)
                                  (L)
(A)
   (B)
      Rot
         Str Rnd
                (F)
                   Cmp
                      Ct Wht
                            Wht
                               Blk
                                  Blk
Col
   Int
      Col
         Col Col
                Int
                   Vec
                      Vec
                         Grad
                            Vec
                               Grad
                                  Vec
__________________________________________________________________________
             0     21 1     0     0
             1     21 1     0     0
             2     23 1     2     0
             3     23 1     2     0
             4     44 2     0     1
             5     44 2     0     1
             6     42 2     0     2
             7     42 2     0     2
0  22 2.83
         8.49
             8  22 66 3  0  2  0  0
             9  22 66 3  0  2  0  0
             10 22 66 3  0  2  0  0
1  19 3.54
         10.61
             11 19 42 3  0  0  3  24
             12 19 42 3  0  0  3  24
2  5  4.24
         12.73
             13 5  17 3  0  1  14 36
             14 5  17 3  0  1  14 36
3  4  4.95
         14.85
             15 4  11 3  0  0  1  6
             16 4  11 3  0  0  1  6
4  3  5.66
         16.97
             17 3  24 3  0  14 1  1
             18 3  24 3  0  14 1  1
5  15 6.36
         19.09
             19 15 47 3  12 23 0  0
             20 15 47 3  12 23 0  0
6  18 7.07
         21.21
             21 18 34 2  3  3  0  2
             22 18 34 2  3  3  0  2
7  17 7.78
         23.33
             23 17 35 2  0  2  1  1
             24 17 35 2  0  2  1  1
8  20 8.49
         25.46
             25 20 20 1  3  3  0  0
             26 20 20 1  3  3  0  0
             27 20 20 1  3  3  0  0
9  5  9.19
         27.58
             28 5  5  1  0  0  15 15
             29 5  5  1  0  0  15 15
__________________________________________________________________________
After processing scan line # 3, means 910 directs processing to continue to means 912. Means 912 "normalizes" the composite vector to generate a one-dimensional composite signal by dividing each element in the composite vector by the corresponding element in the count vector. Means 914 then transmits this composite signal to composite signal thresholder 108 of system 100.
Table VI presents the one-dimensional composite signal generated by means 912. Lists (E), (G), and (H) are identical to those lists of Table V. List (M) represents the composite signal generated by means 912 by dividing the elements of the composite vector of list (G) by the corresponding elements of the count vector of list (H). Means 914 transmits the composite signal of list (M) to thresholder 108.
              TABLE VI
______________________________________
Processing Composite Signal.
(E)       (G)    (H)         (M)  (N)
Rnd       Cmp    Ct          Cmp  Thr
Col       Vec    Vec         Sig  Sig
______________________________________
0         21     1           21.0 1
1         21     1           21.0 1
2         23     1           23.0 1
3         23     1           23.0 1
4         44     2           22.0 1
5         44     2           22.0 1
6         42     2           21.0 1
7         42     2           21.0 1
8         66     3           22.0 1
9         66     3           22.0 1
10        66     3           22.0 1
11        42     3           14.0 1
12        42     3           14.0 1
13        17     3           5.7  0
14        17     3           5.7  0
15        11     3           3.7  0
16        11     3           3.7  0
17        24     3           8.0  0
18        24     3           8.0  0
19        47     3           15.7 1
20        47     3           15.7 1
21        34     2           17.0 1
22        34     2           17.0 1
23        35     2           17.5 1
24        35     2           17.5 1
25        20     1           20.0 1
26        20     1           20.0 1
27        20     1           20.0 1
28        5      1           5.0  0
29        5      1           5.0  0
______________________________________
 KEY
 (M): Normalized composite signal = composite vector/count vector
 (N): Thresholded composite signal (threshold value = 12.0)
Referring now to FIG. 11, there is shown a block flow diagram of the processing implemented by composite signal thresholder 108 of system 100 to threshold a one-dimensional composite signal of a bar code symbol. Thresholder 108 processes a composite signal, whether the composite signal was generated by generator 600 using the slow method described earlier in this specification in conjunction with FIG. 6 or by generator 900 using the fast method described earlier in this specification in conjunction with FIG. 9. Thresholder 108 thresholds the composite signal into binary black ("0") and white ("1") segments that correspond to the bars and spaces of the bar code symbol. Thresholder 108 then filters the thresholded signal to eliminate spurious bars and spaces. Thresholder 108 then transmits the filtered signal to composite signal decoder 110, which uses conventional bar code symbol decoding methods to decode the filtered signal.
Referring again to Table VI, list (N) represents the binary signal generated by means 1102 by thresholding the composite signal of list (M) using a fixed threshold value of 12. If an element of the composite signal is greater than 12, then the corresponding binary element is 1 (white); otherwise the corresponding binary element is 0 (black). In the example of Tables II through VI, the fast method of generating a composite signal indicates a bright-to-dark transition between rounded columns 12 and 13, a dark-to-bright transition between rounded columns 18 and 19, and another bright-to-dark transition between rounded columns 27 and 28. These transitions correspond to the edges of bars in the bar code symbol.
Referring again to Table VI, the first local maximum intensity value is 23.0 corresponding to rounded columns 2 and 3 and the first local minimum intensity value is 3.7 corresponding to rounded columns 15 and 16. In this example, means 1102 selects one-half the sum of the local maximum and minimum (0.5×(23.0+3.7)) or 13.4 as the threshold value to be applied between rounded column 2 and rounded column 16. Using that threshold value, means 1102 locates the bright-to-dark transition between rounded columns 12 and 13. If, in a particular situation, two or more consecutive elements in the composite signal are equal to the threshold value, the middle element of that series of consecutive elements is selected as the bright/dark transition.
To minimize the effect of noise, local maxima and minima are defined in terms of a specified significance value. If the difference between a local maximum and the next local minimum is not greater than the specified significance value, then means 1102 rejects them and continues to search for proper local minimum and maximum pixels in the composite signal.
For example, consider the composite signal having intensity values (5, 3, 6, 25, 22, 26, 10, 4, 7). Assume that the significance value is determined to be 5. Means 1102 scans from left to right to find a local minimum at 3. Means 1102 continues to scan to find a local maximum at 25. Since the difference between the local maximum (25) and the local minimum (3) is greater than the significance value (5), means 1102 retains these values.
The selected significance value determines the immunity of means 1102 to noise. High significance values provide substantial noise immunity, but may also result in the loss of true bright/dark transitions in the composite signal. Low significance values, on the other hand, may lead to the spurious recognition of transitions in noisy regions. It is preferable to use significance values that are too low rather than too high. This is true because subsequent filtering may be able to eliminate spurious transitions, but nothing can be done to recover from the loss of true transitions. In a preferred embodiment, the significance value is based on a fraction (e.g., one-eighth) of the dynamic range of the composite signal as defined by the overall minimum and maximum values within the composite signal.
Referring now to FIGS. 12 and 13, there are shown two common examples of spurious bright/dark transitions that may result from using relatively low significance values to threshold a noisy composite signal. FIG. 12 depicts the binary representation of a spurious bar 1 in what should be a single space. FIG. 13 depicts the binary representation of either a spurious bar 1 or a spurious space 2, where only one space and one bar should exist.
In FIG. 13, bar 1 and space 2 may both be narrower than the applicable thresholds. In such case, means 1104 eliminates the smaller of the two by merging the neighboring bars/spaces together. Thus, if bar 1 is narrower than space 2, then means 1104 removes bar 1 to yield a single space that ends at point 4. If, however, bar 1 is not narrower than space 2, then means 1104 removes space 2 to yield a single space that ends at point 3.
Referring again to FIG. 11, after means 1104 filters the thresholded signal, means 1106 transmits the filtered signal to composite signal decoder 110, which decodes the filtered signal using conventional bar code symbol decoding methods.
When decoding Code 128 bar code symbols, decoder 110 makes standard like-edge to like-edge measurements as described in the section entitled "Determining Character Choices from Subpixel Interpolation Results" of U.S. patent application Ser. No. 07/927,910, the disclosure of which is incorporated herein by reference. Decoder 110 calculates the standard t1, t2, t3, and t4 values, scans a mapping table, and performs Code 128 checksum computations to support decoding of all three character sets of Code 128.
Referring now to FIG. 14, there is shown a block flow diagram of the processing implemented by composite signal decoder 110 of system 100 to decode the characters of a Code 39 bar code symbol. Code 39 symbology is based on characters having five bars and four spaces. In Code 39, three of the bars/spaces must be wide and the other six bars/spaces must be narrow. In addition, a Code 39 character must have either two wide bars and one wide space, or three wide spaces. A character with exactly zero, two, or four wide spaces is not a valid Code 39 character. Similarly, if a character has exactly one wide space, but does not have exactly two wide bars, then it is not a valid Code 39 character. When decoding Code 39 bar code symbols, decoder 110 examines five bars and four spaces of the bar code symbol at a time, classifies them as wide or narrow, and decodes the character by referring to a look-up table.
To decode a Code 39 character, decoder 110 first analyzes the four spaces of the character. Means 1402 in FIG. 14 calculates a space-width threshold for the character, where the space-width threshold is the average of the width of the widest space and the width of the narrowest space in the character.
If means 1404 classifies three of the spaces as wide and one as narrow, then means 1406 directs processing to means 1416 to decode the character; otherwise, processing continues to means 1408. If decoder 110 determines that there are three wide spaces and one narrow space, then decoder 110 assumes that all five bars are narrow and that the character is a valid Code 39 character.
If means 1404 classifies one of the spaces as wide and three as narrow, then means 1408 directs processing to means 1410; otherwise, the character cannot be decoded. If decoder 110 determines that there are not exactly one or three wide spaces, then the character is not a valid Code 39 character and cannot be decoded as such.
If decoder 110 determines that there are three narrow spaces and one wide space, then decoder 110 analyzes the five bars of the character. Means 1410 calculates a bar-width threshold for the character, where the bar-width threshold is the average of the width of the widest bar and the width of the narrowest bar in the character.
If means 1412 classifies two of the bars as wide and three as narrow, then means 1414 directs processing to means 1416 to decode the character; otherwise, the character is not a valid 1416 Code 39 character and cannot be decoded as such. If, after determining that there is exactly one wide space, decoder 110 determines that there are two wide bars and three narrow bars, then decoder 110 assumes that the character is a valid Code 39 character.
After successfully locating the three wide bars/spaces and six narrow bars/spaces of the Code 39 character, means 1416 decodes the character by searching through a Code 39 look-up table for the appropriate alphanumeric character using the sequence of wide and narrow bars and spaces identified by means 1404 and 1412. In a preferred embodiment, decoder 110 also performs Code 39 checksum analysis.
In the preferred embodiment of FIG. 14, decoder 110 analyzes the widths of bars and spaces independently by calculating two different width thresholds--one for classifying spaces and one for classifying bars. Decoder 110 uses these different width thresholds for spaces and bars to reduce decoding errors that may result from pixel image bleeding.
When pixel images are generated using conventional imaging systems, dark regions in the images often tend to bleed into bright regions. As a result of this bleeding, the bars in imaged bar code symbols may appear wider and spaces may appear narrower than those in the true bar code symbol. At times, true narrow bars (that is, a bar that is narrow in the true bar code symbol) may even appear in the pixel image to be wider than true wide spaces. These apparent changes in the widths of bars and spaces may lead to errors in the decoding of the bar code symbols. When decoding Code 39 symbols, for example, decoder preferably classifies bars and spaces independently using different width thresholds to reduce the decoding errors that result from pixel image bleeding.
Those skilled in the art will understand that this independent classification of bars and spaces in bar code symbols to correct for the effects of bleeding may be employed to decode symbols other than those of the Code 39 symbology.
For example, decoder 110 preferably uses independent classification of bars and spaces to decode Interleaved Code 2 of 5 (I2of5) bar code symbols. In I2of5 characters, five bars and five spaces encode two decimal digits. The bars encode the first digit while the spaces encode the second digit. Each digit is represented by two wide bars (or spaces) and three narrow bars (or spaces). Decoder 110 takes thirteen bars and spaces of an I2of5 symbol at a time and classifies them as wide or narrow by independently classifying the bars and spaces, similar to the independent classification scheme implemented by decoder 110 for Code 39 symbols. The result is a 13-bit value where each bit represents the width of a corresponding bar/space.
After decoding the thresholded composite signal, decoder 110 transmits the decoded signal to output selector 118 of system 100.
Referring now to FIG. 15, there is shown a block flow diagram of the processing implemented by gradient signal generator 112 of system 100 to generate whitening and blackening gradient signals for a bar code symbol located by symbol locator 104. The gradient signals are used to find the transitions between bars and spaces (i.e., leading and trailing edges of bars) in the bar code symbol.
In a preferred embodiment, generator 112 selects scan lines from the set of rows or columns in the pixel image that cross the bar code symbol. These scan lines are preferably the same scan lines as those selected for the fast method for generating composite signals, described earlier in this specification in conjunction with FIG. 9.
For each scan line, generator 112 rotates and stretches the scan line data and updates two one-dimensional gradient vectors--a whitening gradient vector and a blackening gradient vector--and a one-dimensional count vector based on the stretched, rotated data. After all the selected scan lines have been processed, generator 112 normalizes the two gradient vectors to generate whitening and blackening gradient signals, smoothes the gradient signals, and transmits the smoothed gradient signals to gradient signal processor 114 for further processing.
Referring again to the example of Table II, the processing of means 1504 for each of the scan lines is identical to the processing performed by means 1504, as described earlier in this specification in conjunction with FIG. 9. Thus, lists (A) through (F) of Tables III, IV, and V may also be used describe the operation of gradient signal generator 112.
After means 1504 rotates and stretches the first scan line, means 1506 updates a whitening and a blackening gradient vector using the rotated, stretched data. In a preferred embodiment, the whitening gradient vector is a one-dimensional vector that accumulates the magnitudes of all the pixel-to-pixel changes in which the pixel intensity values increase. Analogously, the blackening gradient vector is a one-dimensional vector that accumulates the magnitudes of all the pixel-to-pixel changes in which the pixel intensity values decrease. For each gradient vector, the magnitude of the difference between adjacent image pixels is accumulated, not the absolute pixel values themselves. In an alternative preferred embodiment, the whitening and blackening gradient vectors accumulate the number of pixel-to-pixel changes that increase and decrease, respectively, as opposed to accumulating the magnitudes of those changes.
The whitening and blackening gradients may be defined in terms of the first derivative of the scan line data. The whitening gradients correspond to those first derivatives that are greater than zero, while the blackening gradients correspond to the magnitudes of the first derivatives that are less than zero.
Referring again to Table III, list (I) represents the whitening gradients for scan line # 1 and list (J) represents the whitening gradient vector after means 1506 processes scan line # 1. In general, the whitening gradient vector represents the sum of corresponding whitening gradients for all the scan lines that have been processed. Since scan line # 1 is the first scan line to be processed in the example, the whitening gradients of list (I) are identical to the whitening gradient vector of list (J).
Since the intensity increases from 21 to 23 from pixel (0,0) to pixel (0,1) in the original data, the corresponding whitening gradients in list (I) for rounded columns 2 and 3 are 2. If the change from the previous pixel to the current pixel in the original image is not positive, then there is no whitening gradient for that current pixel. For example, since the intensity decreases from 23 to 22 from pixel (0,1) to pixel (0,2) in the original data, the corresponding whitening gradients in list (I) for rounded columns 4 and 5 are 0.
Similarly, list (K) of Table III represents the blackening gradients for scan line # 1. For example, since the intensity decreases from 22 to 18 from pixel (0,4) to pixel (0,5) in the original data, the corresponding blackening gradients for rounded columns 11 and 12 are 4. If the change from the previous pixel to the current pixel in the original image is not negative, then there is no blackening gradient for that current pixel. For example, since the intensity increases from 4 to 5 from pixel (0,7) to pixel (0,8) in the original data, the corresponding blackening gradients for rounded columns 17 and 18 are 0. List (L) of Table III represents the blackening gradient vector (i.e., the accumulated blackening gradients) after means 1506 processes scan line # 1.
After means 1506 updates both gradient vectors and the count vector for the current scan line, means 1508 determines whether the current scan line is the last scan line for the bar code symbol. If not, then processing returns to means 1502 to select the next scan line. Otherwise, processing proceeds to means 1510.
In the example of Table II, after scan line # 1 is processed, processing returns to means 1502 to select scan line # 2 as the new scan line. Table IV presents the results of processing scan line # 2. Lists (I) and (K) of Table IV represent the whitening and blackening gradients, respectively, for scan line # 2. Lists (J) and (L) represent the updated gradient vectors. Means 1506 updates the gradient vectors by "adding" the gradients for scan line # 2 to the gradient vectors of Table III. Similarly, Table V presents the results of processing scan line # 3.
After the last scan line is processed, means 1508 directs processing to means 1510. Means 1510 normalizes the whitening and blackening gradient vectors by dividing the elements of each gradient vector by the corresponding elements of the count vector.
Tables VII and VIII present the results of processing the whitening and blackening gradient vectors, respectively. Lists (E), (H), and (J) of Table VII and lists (E), (H), and (L) of Table VIII are identical to the corresponding lists of Table V. List (O) of Table VII represents the whitening gradient signal that results from means 1510 normalizing the whitening gradient vector of list (J). Means 1510 determines each element in list (O) by dividing the corresponding element of list (J) by the corresponding element of list (H). Similarly, list (T) of Table VIII represents the blackening gradient signal that results from means 1510 normalizing the blackening gradient vector of list (L).
              TABLE VII
______________________________________
Processing Whitening Gradient.
(E)   (H)    (J)     (O)   (P)   (Q)   (R)   (S)
Rnd   Ct     Wht     Wht   Smth  Seg-  Seg   WhSeg
Col   Vec    Vec     Sig   WSig  #     Mass  Cntrd
______________________________________
0     1      0       0.0   0.0   --        0
1     1      0       0.0   0.5             0
2     1      2       2.0   1.5   1     4.0    0*
3     1      2       2.0   1.5               0
4     2      0       0.0   0.5               0
5     2      0       0.0   0.0   --        0
6     2      0       0.0   0.0             0
7     2      0       0.0   0.2             0
8     3      2       0.7   0.5             0
9     3      2       0.7   0.7   2     2.2    0*
10    3      2       0.7   0.5               0
11    3      0       0.0   0.2               0
12    3      0       0.0   0.1   --        0
13    3      1       0.3   0.2   3     0.6    0*
14    3      1       0.3   0.2               0
15    3      0       0.0   0.1   --        0
16    3      0       0.0   1.2             0
17    3      14      4.7   3.5             0
18    3      14      4.7   5.5             0
19    3      23      7.7   7.0   4     29.1  1
20    3      23      7.7   6.2               0
21    2      3       1.5   3.1               0
22    2      3       1.5   1.4               0
23    2      2       1.0   1.1   --        0
24    2      2       1.0   1.5             0
25    1      3       3.0   2.5             0
26    1      3       3.0   3.0   5     11.2   0*
27    1      3       3.0   2.3               0
28    1      0       0.0   0.8               0
29    1      0       0.0   0.0   --        0
______________________________________
 KEY
 (O): Normalized whitening gradient signal = whitening gradient vector /
 count vector
 (P): Smoothed whitening gradient signal = (previous pixel + (2 ×
 pixel) + next pixel)/4
 (Q): Segment number
 (R): Segment mass
 (S): Weighted centroid of whitening gradient segment
 *segment rejected because of low mass
              TABLE VIII
______________________________________
Processing Blackening Gradient.
(E)   (H)    (J)     (T)   (U)   (V)   (W)   (X)
Rnd   Ct     Wht     Blk   Smth  Seg   Seg   BlSeg
Col   Vec    Vec     Sig   BSig  #     Mass  Cntrd
______________________________________
0     1      0       0.0   0.0   --        0
1     1      0       0.0   0.0             0
2     1      0       0.0   0.0             0
3     1      0       0.0   0.1             0
4     2      1       0.5   0.4             0
5     2      1       0.5   0.6             0
6     2      2       1.0   0.9   1     3.1    0*
7     2      2       1.0   0.8               0
8     3      0       0.0   0.3               0
9     3      0       0.0   0.0   --        0
10    3      0       0.0   2.0             0
11    3      24      8.0   6.0             0
12    3      24      8.0   9.0             0
13    3      36      12.0  11.0  2     45.1  1
14    3      36      12.0  10.0              0
15    3      6       2.0   4.5               0
16    3      6       2.0   1.6               0
17    3      1       0.3   0.7               0
18    3      1       0.3   0.2               0
19    3      0       0.0   0.1   --        0
20    3      0       0.0   0.03            0
21    2      2       1.0   0.8             0
22    2      2       1.0   0.9   3     3.2    0*
23    2      1       0.5   0.6               0
24    2      1       0.5   0.4               0
25    1      0       0.0   0.1               0
26    1      0       0.0   0.0   --        0
27    1      0       0.0   3.8             0
28    1      15      15.0  11.3  4     26.4  1
29    1      15      15.0  11.3              0
______________________________________
 KEY
 (T): Normalized blackening gradient signal = blackening gradient vector /
 count vector
 (U): Smoothed normalized blackening gradient signal = (previous pixel + (
 × pixel) + next pixel)/4
 (V): Segment number
 (W): Segment mass
 (X): Weighted centroid of blackening gradient segment
 *segment rejected because of low mass
After means 1510 normalizes the gradient vectors, means 1512 smoothes the resulting whitening and blackening gradient signals. The smoothing filter employed by means 1512 preferably depends on the oversampling rate used to stretch the scan line data. Table IX presents the preferred filter parameters for different oversampling rates.
              TABLE IX
______________________________________
Oversampling    Filter
Rate            size    Weights
______________________________________
1, 2            1       1
3, 4            3       1,2,1
5, 6            5       1,2,4,2,1
>= 7            7       1,2,4,8,4,2,1
______________________________________
List (P) of Table VII presents the results of smoothing the whitening gradient signal of list (O) based on an oversampling rate of 3. For an oversampling rate of 3, each element Si in the smoothed whitening gradient signal of list (P) is calculated using: ##EQU2## where Wi is the element in the whitening gradient signal of list (O) corresponding to element Si, Wi-1 is the previous element in list (O), and Wi+1 is the next element in list (O). Similarly, list (U) of Table VIII presents the results of smoothing the blackening gradient signal of list (T) based on an oversampling rate of 3.
After means 1512 smoothes the two gradient signals, means 1514 transmits the smoothed gradient signals to gradient signal processor 114 of system 100. Those skilled in the art will understand that the smoothing of means 1512 is an optional processing step.
Referring now to FIG. 16, there is shown a block flow diagram of the processing implemented by gradient signal processor 114 of system 100 to process the smoothed whitening and blackening gradient signals generated by generator 112. The whitening and blackening gradient signals represent the locations of dark-to-bright and bright-to-dark transitions, respectively, in the bar code symbol. That is, they represent the trailing and leading edges, respectively, of bars in the bar code symbol. Processor 114 locates the bright/dark transitions in the gradient signals and generates a single one-dimensional reconstructed signal from those transition locations. Processor 114 transmits this reconstructed signal to gradient signal decoder 116, which decodes the signal using conventional bar code decoding methods.
In a preferred embodiment, processor 114 segments the two gradient signals, locates the centroids of the signal segments, and reconstructs a single binary signal from the centroid locations. In an alternative preferred embodiment (not shown), processor 114 selects the peaks in the two gradient signals as the locations of the transitions for the reconstructed signal.
To minimize erroneous segmentation, means 1602 preferably uses a significance-value test to determine the local minima that define the segments in the gradient signals, where the significance-value test is similar to that described earlier in this specification in conjunction with FIG. 11.
After means 1602 segments the smoothed gradient signals, means 1604 determines the mass of each segment. The mass of each segment is the sum of the smoothed gradient values for that segment. List (R) of Table VII presents the masses of the whitening gradient segments identified in list (Q). Similarly, list (W) of Table VIII presents the masses of the blackening gradient segments identified in list (V). Thus, for example, segment # 3 in Table VII has a mass of (0.1+0.2+0.2+0.1) or 0.6.
After means 1604 determines the mass of each segment, means 1606 locates the weighted centroid of those segments that have sufficient mass. Means 1606 ignores those segments whose masses are less than a specified mass threshold, indicating that they have insufficient mass. The mass threshold is preferably specified to be equivalent to a fraction, for example, one-eighth, of the product of the oversampling rate and the expected mass of a narrow bar or space in the original pixel image.
Noise in the pixel image may result in spurious segments in the gradient signals. If the image noise is not too great, the spurious segments will have masses typically lower than the masses of true segments (i.e., those corresponding to true bright/dark transitions in the pixel image). In that case, means 1606 may be used to "filter" out the spurious segments.
In Table VII, segments # 1, 2, 3, and 5 are rejected for having masses less than the specified mass threshold of 20. Segments # 1 and 3 of Table VIII are also rejected for similarly having masses less than the mass threshold.
After eliminating the segments having low mass, means 1606 locates the weighted centroids of the remaining segments. The weighted centroid of a segment is the location within the segment corresponding to a specified percentage of the mass of the segment. For example, a weighted centroid based on 50% corresponds to the center of mass of each segment. A weighted centroid based on 40% corresponds to the location within the segment wherein 40% of the mass is to the left and 60% of the mass is to the right.
In Table VII, a "1" in list (S) identifies the location of the weighted centroid of segment # 4, where 50% is the selected weighted-centroid percentage. Similarly, list (X) of Table VIII identifies the locations of the weighted centroids of segments # 2 and 4.
In an alternative preferred embodiment (not shown), different weighted-centroid percentages are used to locate the centroids in the whitening and blackening gradient segments. Since black bars tend to "bleed" into white spaces in bar code symbol images, bars tend to appear wider and spaces narrower in the images. Using a whitening-centroid percentage that is smaller than the blackening-centroid percentage may correct these bleeding effects. The exact weighted-centroid percentages may be selected empirically based on tests performed on images of known bar code symbols.
After means 1606 locates the whitening and blackening segment centroids, means 1608 reconstructs a single one-dimensional signal by interleaving the centroid locations from the two gradient signals. The centroid of each segment from the smoothed blackening gradient signal corresponds to the leading edge of a bar in the bar code symbol. Similarly, the centroid of each segment from the smoothed whitening gradient signal corresponds to the trailing edge of a bar in the bar code symbol.
Table X presents the results of means 1608 interleaving the whitening and blackening segment centroids of Tables VII and VIII. Lists (E), (S), and (X) of Table X are identical to the corresponding lists of Tables VII and VIII. List (Y) of Table X represents the one-dimensional reconstructed signal generated by means 1608. Note that the reconstructed signal of list (Y) of Table X is identical to the thresholded signal of list (N) of Table VI, indicating that the gradient signal processing of generator 112 and processor 114 of system 100 generates the same result as the composite signal processing generator 900 and thresholder 108 of system 100.
              TABLE X
______________________________________
Reconstructing Segmented Signal.
(E)      (S)           (X)     (Y)
Rnd      WhSeg         BlSeg   Rec
Col      Cntrd         Cntrd   Sig
______________________________________
0        0             0       1
1        0             0       1
2        0             0       1
3        0             0       1
4        0             0       1
5        0             0       1
6        0             0       1
7        0             0       1
8        0             0       1
9        0             0       1
10       0             0       1
11       0             0       1
12       0             0       1
13       0             1       0
14       0             0       0
15       0             0       0
16       0             0       0
17       0             0       0
18       0             0       0
19       1             0       1
20       0             0       1
21       0             0       1
22       0             0       1
23       0             0       1
24       0             0       1
25       0             0       1
26       0             0       1
27       0             0       1
28       0             1       0
29       0             0       0
______________________________________
 KEY
 (Y): Reconstructed signal
If the reconstructed signal has two consecutive leading bar edges, then either a trailing bar edge was missed or an extra leading bar edge was inserted. Similarly, if the reconstructed signal has two consecutive trailing bar edges, then either a bar leading edge was missed or an extra bar trailing edge was inserted. If true bar edges are being missed, then the segmentation procedure performed by means 1602 should be made more sensitive to smaller gradients. If spurious bar edges are being inserted, then the segmentation procedure should be made less sensitive to accommodate larger changes in the gradient signal without falsely splitting a segment in two. The sensitivity of the segmentation procedure may be controlled by varying the specified mass threshold used by means 1606 to determine whether segments have sufficient mass.
After means 1608 generates a reconstructed signal, means 1610 transmits the reconstructed signal to gradient signal decoder 116. In a preferred embodiment, the processing of decoder 116 is identical to that of composite signal decoder 110 described earlier in this specification in the section entitled "Decoding Composite Signals." After decoding the bar code symbol, decoder 116 transmits the decoded signal to output selector 118.
As described earlier in this specification in conjunction with the example of Table II, under a preferred embodiment of the present invention, the original pixel intensity values are repeated to "fill in the gaps" between the rounded columns that result from rotating, stretching, and rounding the original columns. In an alternative preferred embodiment (not shown), the original pixel intensity values are repeated according to the oversampling rate.
For example, referring to Table III, for an oversampling rate of three, system 100 would rotate and stretch original pixel (0,0) such that the intensity value of pixel (0,0) would be used three times to update the elements of the composite vector corresponding to rounded columns 0, 1, and 2. Similarly, system 100 would rotate and stretch original pixel (0,1) such that the intensity value of pixel (0,1) would be used three times to update the elements of the composite vector corresponding to rounded columns 2, 3, and 4.
Note that the intensity values of both original pixels (0,0) and (0,1) of scan line # 1 are used to update the element of the composite vector corresponding to rounded column 2. Thus, rather than "filling in the gaps" between rounded columns, in this preferred embodiment, the original pixel values are repeated according to the oversampling rate and "overlapping" may result. In this example, the element of the count vector corresponding to rounded column 2 is updated two times to reflect this overlapping effect.
Those skilled in the art will understand that preferred embodiments of system 100 may be designed to locate and decode bar code symbols in binary and/or gray-scale images.
Those skilled in the art will also understand that system 100 is preferably designed to be parameter-driven, where the values for various parameters may be changed depending on the particular application. It will also be understood that the selection of certain parameter values may be based on empirical analysis from processing known sample images.
It will be further understood that various changes in the details, materials, and arrangements of the parts which have been described and illustrated in order to explain the nature of this invention may be made by those skilled in the art without departing from the principle and scope of the invention as expressed in the following claims.
Claims (8)
1. A method for reading a bar code symbol in a pixel image, comprising the steps of:
(a) selecting a first scan line substantially parallel to the bars and spaces of said symbol;
(b) scanning said symbol along said first scan line to generate a first value based on intensity values of two or more pixels of the pixel image that are crossed by the first scan line;
(c) selecting a second scan line substantially parallel to the bars and spaces of said symbol, wherein the distance between said first and second scan lines is less than the width of a pixel of said image;
(d) scanning said symbol along said second scan line to generate a second value based on intensity values of two or more pixels of the pixel image that are crossed by the second scan line; and
(e) decoding said symbol in accordance with said first and second values.
2. The method of claim 1, wherein said first value comprises the average of intensity values of two or more pixels lying along said first scan line.
3. The method of claim 1, wherein step (a) further comprises the step of locating the four corners of said symbol, and wherein said first and second scan lines are selected in accordance with said four corners.
4. The method of claim 1, wherein step (e) comprises the steps of:
(1) generating a composite signal in accordance with said first and second values;
(2) thresholding said composite signal; and
(3) decoding said symbol in accordance with said thresholded composite signal.
5. An apparatus for reading a bar code symbol in a pixel image, comprising:
(a) means for selecting a first scan line substantially parallel to the bars and spaces of said symbol;
(b) means for scanning said symbol along said first scan line to generate a first value based on intensity values of two or more pixels of the pixel image that are crossed by the first scan line;
(c) means for selecting a second scan line substantially parallel to the bars and spaces of said symbol, wherein the distance between said first and second scan lines is less than the width of a pixel of said image;
(d) means for scanning said symbol along said second scan line to generate a second value based on intensity values of two or more pixels of the pixel image that are crossed by the second scan line; and
(e) means for decoding said symbol in accordance with said first and second values.
6. The apparatus of claim 5, wherein said first value comprises the average of intensity values of two or more pixels lying along said first scan line.
7. The apparatus of claim 5, wherein means (a) further comprises means for locating the four corners of said symbol, and wherein said first and second scan lines are selected in accordance with said four corners.
8. The apparatus of claim 5, wherein means (e) further comprises:
(1) means for generating a composite signal in accordance with said first and second values;
(2) means for thresholding said composite signal; and
(3) means for decoding said symbol in accordance with said thresholded composite signal.
Priority Applications (1)
| Application Number | Priority Date | Filing Date | Title |
|---|---|---|---|
| US08/328,518 US5545887A (en) | 1993-01-29 | 1994-10-25 | Method and apparatus for decoding bar code symbols using subpixel scan lines |
Applications Claiming Priority (2)
| Application Number | Priority Date | Filing Date | Title |
|---|---|---|---|
| US08/011,642 US5384451A (en) | 1993-01-29 | 1993-01-29 | Method and apparatus for decoding bar code symbols using composite signals |
| US08/328,518 US5545887A (en) | 1993-01-29 | 1994-10-25 | Method and apparatus for decoding bar code symbols using subpixel scan lines |
Related Parent Applications (1)
| Application Number | Title | Priority Date | Filing Date |
|---|---|---|---|
| US08/011,642 Division US5384451A (en) | 1993-01-29 | 1993-01-29 | Method and apparatus for decoding bar code symbols using composite signals |
Publications (1)
| Publication Number | Publication Date |
|---|---|
| US5545887A true US5545887A (en) | 1996-08-13 |
Family
ID=21751348
Family Applications (2)
| Application Number | Title | Priority Date | Filing Date |
|---|---|---|---|
| US08/011,642 Expired - Lifetime US5384451A (en) | 1993-01-29 | 1993-01-29 | Method and apparatus for decoding bar code symbols using composite signals |
| US08/328,518 Expired - Lifetime US5545887A (en) | 1993-01-29 | 1994-10-25 | Method and apparatus for decoding bar code symbols using subpixel scan lines |
Family Applications Before (1)
| Application Number | Title | Priority Date | Filing Date |
|---|---|---|---|
| US08/011,642 Expired - Lifetime US5384451A (en) | 1993-01-29 | 1993-01-29 | Method and apparatus for decoding bar code symbols using composite signals |
Country Status (1)
| Country | Link |
|---|---|
| US (2) | US5384451A (en) |
Cited By (54)
| Publication number | Priority date | Publication date | Assignee | Title |
|---|---|---|---|---|
| US5648649A (en) * | 1995-07-28 | 1997-07-15 | Symbol Technologies, Inc. | Flying spot optical scanner with a high speed dithering motion |
| US5742037A (en) * | 1996-03-07 | 1998-04-21 | Cognex Corp. | Method and apparatus for high speed identification of objects having an identifying feature |
| US5764798A (en) * | 1996-03-18 | 1998-06-09 | Intermec Corporation | Prioritized searching methods for finding a coded symbol in a digitized image |
| US5777308A (en) * | 1995-08-14 | 1998-07-07 | Intermec Corporation | Resolution gain on width modulated bar codes by use of angled sampling in two dimensions |
| US5979768A (en) * | 1988-01-14 | 1999-11-09 | Intermec I.P. Corp. | Enhanced bar code resolution through relative movement of sensor and object |
| US6123261A (en) * | 1997-05-05 | 2000-09-26 | Roustaei; Alexander R. | Optical scanner and image reader for reading images and decoding optical information including one and two dimensional symbologies at variable depth of field |
| US6252986B1 (en) | 1998-04-03 | 2001-06-26 | Cognex Corporation | Locating an image of an object having a concentric profile |
| US6267293B1 (en) * | 1999-02-22 | 2001-07-31 | Cimatrix | Bar code scanning system and method |
| US6324299B1 (en) | 1998-04-03 | 2001-11-27 | Cognex Corporation | Object image search using sub-models |
| US6377698B1 (en) * | 1997-11-17 | 2002-04-23 | Datalogic S.P.A. | Method of locating highly variable brightness or color regions in an image |
| US6411734B1 (en) | 1998-04-03 | 2002-06-25 | Cognex Corporation | Object image search using validated sub-model poses |
| US6424734B1 (en) | 1998-04-03 | 2002-07-23 | Cognex Corporation | Fiducial mark search using sub-models |
| US6459820B1 (en) | 1998-08-25 | 2002-10-01 | Cognex Corporation | Gauging using sub-model poses |
| US20020143814A1 (en) * | 2001-03-27 | 2002-10-03 | The Code Corporation | Systems and methods for automatic insertion of machine-readable graphical codes into printable documents |
| US20020152241A1 (en) * | 2001-04-13 | 2002-10-17 | The Code Corporation | System and method for encoding and decoding data and references to data in machine-readable graphical codes |
| US20020149793A1 (en) * | 2001-04-13 | 2002-10-17 | The Code Corporation | System and method for associating pre-printed machine-readable graphical codes with electronically-accessible data |
| US20020150309A1 (en) * | 2001-04-13 | 2002-10-17 | The Code Corporation | Systems and methods for pixel gain compensation in machine-readable graphical codes |
| US6516092B1 (en) | 1998-05-29 | 2003-02-04 | Cognex Corporation | Robust sub-model shape-finder |
| US6526165B1 (en) | 1998-11-30 | 2003-02-25 | Cognex Corporation | Methods and apparatuses for refining a geometric description of an object having a plurality of extensions |
| US6571006B1 (en) | 1998-11-30 | 2003-05-27 | Cognex Corporation | Methods and apparatuses for measuring an extent of a group of objects within an image |
| US20030163396A1 (en) * | 2002-02-27 | 2003-08-28 | John Blankevoort | Systems and methods for tracking products as they move through a supply chain |
| US20030163800A1 (en) * | 2002-02-27 | 2003-08-28 | Weiyang Zhou | System and method for generating graphical codes containing a plurality of data fields |
| US6614926B1 (en) | 1999-06-29 | 2003-09-02 | Cognex Corporation | Methods and apparatuses for generating from an image a model of an object |
| US20040019893A1 (en) * | 2002-07-29 | 2004-01-29 | Hepworth Paul J. | Systems and methods for interfacing multiple types of object identifiers and object identifier readers to multiple types of applications |
| US6688523B1 (en) | 1988-08-31 | 2004-02-10 | Intermec Ip Corp. | System for reading optical indicia |
| US20040026511A1 (en) * | 2002-08-07 | 2004-02-12 | Shenzhen Syscan Technology Co., Limited. | Guiding a scanning device to decode 2D symbols |
| US20040030991A1 (en) * | 2002-04-22 | 2004-02-12 | Paul Hepworth | Systems and methods for facilitating automatic completion of an electronic form |
| US20040086182A1 (en) * | 2002-10-30 | 2004-05-06 | Bian Long Xiang | Barcode detection system |
| US20040158604A1 (en) * | 2002-07-29 | 2004-08-12 | Paul Hepworth | Data collection device with integrated data translation |
| US20040163051A1 (en) * | 2002-07-29 | 2004-08-19 | Paul Hepworth | Systems and methods for interfacing object identifier readers to multiple types of applications |
| US6804416B1 (en) | 2001-03-16 | 2004-10-12 | Cognex Corporation | Method and system for aligning geometric object models with images |
| US6813377B1 (en) | 1999-08-06 | 2004-11-02 | Cognex Corporation | Methods and apparatuses for generating a model of an object from an image of the object |
| US20050018904A1 (en) * | 2003-07-22 | 2005-01-27 | Jason Davis | Methods for finding and characterizing a deformed pattern in an image |
| US6898333B1 (en) | 1999-08-06 | 2005-05-24 | Cognex Corporation | Methods and apparatus for determining the orientation of an object in an image |
| US20050117801A1 (en) * | 2003-07-22 | 2005-06-02 | Jason Davis | Method for partitioning a pattern into optimized sub-patterns |
| US20050173534A1 (en) * | 2004-02-11 | 2005-08-11 | Paul Hepworth | Systems and methods for concurrent image capture and decoding of graphical codes |
| US6942152B1 (en) | 2004-01-21 | 2005-09-13 | The Code Corporation | Versatile graphical code reader that is configured for efficient decoding |
| US6950548B1 (en) | 2000-05-17 | 2005-09-27 | Cognex Corporation | Creating geometric model descriptions for use in machine vision inspection systems |
| US6963338B1 (en) | 1998-07-31 | 2005-11-08 | Cognex Corporation | Method for refining geometric description models using images |
| US20060027661A1 (en) * | 2004-08-09 | 2006-02-09 | Kazukuni Hosoi | Method of decoding a symbol with a low contrast |
| US20060039016A1 (en) * | 2004-08-23 | 2006-02-23 | Harrison Shelton E Jr | Polychromatic encoding system, method and device |
| US20060091226A1 (en) * | 2000-06-30 | 2006-05-04 | Silverbrook Research Pty Ltd | Dot-based data package template |
| US20060091217A1 (en) * | 2004-11-03 | 2006-05-04 | The Code Corporation | Graphical code reader that is configured for efficient decoder management |
| US20060138236A1 (en) * | 2002-07-29 | 2006-06-29 | The Code Corporation | System and method for controlling the distribution of data translation components to portable data collection devices |
| US7072974B2 (en) | 2001-03-27 | 2006-07-04 | The Code Corporation | Extensible application interface using machine-readable graphical codes |
| US20070085162A1 (en) * | 2004-03-31 | 2007-04-19 | O'brien Kevin P | Capping of copper structures in hydrophobic ild using aqueous electro-less bath |
| US20090127326A1 (en) * | 2007-11-20 | 2009-05-21 | Datalogic Scanning, Inc. | Enhanced virtual scan line processing |
| US20110215152A1 (en) * | 2010-03-08 | 2011-09-08 | Eunice Poon | Method and Apparatus for Creating Pixel Tokens from Machine-Readable Symbols to Improve Decoding Accuracy in Low Resolution Images |
| US8229222B1 (en) | 1998-07-13 | 2012-07-24 | Cognex Corporation | Method for fast, robust, multi-dimensional pattern recognition |
| US20120256001A1 (en) * | 2009-12-21 | 2012-10-11 | Datalogic Ip Tech S.R.L. | Method for decoding a linear bar code |
| US8437502B1 (en) | 2004-09-25 | 2013-05-07 | Cognex Technology And Investment Corporation | General pose refinement and tracking tool |
| US20150001303A1 (en) * | 2013-06-28 | 2015-01-01 | Kodak Alaris Inc. | Determining barcode locations in documents |
| US9659236B2 (en) | 2013-06-28 | 2017-05-23 | Cognex Corporation | Semi-supervised method for training multiple pattern recognition and registration tool models |
| US20170337456A1 (en) * | 2016-05-18 | 2017-11-23 | Arolltech Co., Ltd. | Display device |
Families Citing this family (16)
| Publication number | Priority date | Publication date | Assignee | Title |
|---|---|---|---|---|
| MX9702434A (en) * | 1991-03-07 | 1998-05-31 | Masimo Corp | Signal processing apparatus. |
| US5979763A (en) * | 1995-10-13 | 1999-11-09 | Metanetics Corporation | Sub-pixel dataform reader with dynamic noise margins |
| US5814802A (en) * | 1996-02-23 | 1998-09-29 | Accu-Sort Systems, Inc. | High speed imaging apparatus for CCD based scanners |
| US6002952A (en) * | 1997-04-14 | 1999-12-14 | Masimo Corporation | Signal processing apparatus and method |
| US5984078A (en) | 1997-08-04 | 1999-11-16 | United Parcel Service Of America, Inc. | Automated shuttle sorter for conveyors |
| US6189702B1 (en) | 1998-11-25 | 2001-02-20 | United Parcel Service Of America, Inc. | Overhead mounted sorter for conveyors |
| US6463311B1 (en) | 1998-12-30 | 2002-10-08 | Masimo Corporation | Plethysmograph pulse recognition processor |
| US6430525B1 (en) | 2000-06-05 | 2002-08-06 | Masimo Corporation | Variable mode averager |
| US7355512B1 (en) | 2002-01-24 | 2008-04-08 | Masimo Corporation | Parallel alarm processor |
| US6970792B1 (en) | 2002-12-04 | 2005-11-29 | Masimo Laboratories, Inc. | Systems and methods for determining blood oxygen saturation values using complex number encoding |
| US7438683B2 (en) | 2004-03-04 | 2008-10-21 | Masimo Corporation | Application identification sensor |
| EP1860995A1 (en) | 2005-03-01 | 2007-12-05 | Masimo Laboratories, Inc. | Multiple wavelength sensor substrate |
| US8146816B2 (en) * | 2008-10-08 | 2012-04-03 | International Business Machines Corporation | Multi-modal one-dimensional barcodes |
| US10204284B2 (en) * | 2016-12-06 | 2019-02-12 | Datalogic Ip Tech S.R.L. | Object recognition utilizing feature alignment |
| US10083334B2 (en) * | 2016-12-06 | 2018-09-25 | Datalogic Ip Tech S.R.L. | Barcode reconstruction utilizing a sequence alignment matrix |
| CN107016317B (en) * | 2017-03-02 | 2019-12-24 | 浙江华睿科技有限公司 | Bar code decoding method and device |
Citations (24)
| Publication number | Priority date | Publication date | Assignee | Title |
|---|---|---|---|---|
| US4618991A (en) * | 1983-05-23 | 1986-10-21 | Hitachi, Ltd. | Processing method for the rotation of an image |
| US4652731A (en) * | 1984-08-10 | 1987-03-24 | Thomson-Csf | Process and device for detecting bar codes |
| US4720745A (en) * | 1983-06-22 | 1988-01-19 | Digivision, Inc. | Method and apparatus for enhancing video displays |
| US4873426A (en) * | 1988-08-03 | 1989-10-10 | Image Business Systems Corporation | Technique for reading bar codes |
| US4924078A (en) * | 1987-11-25 | 1990-05-08 | Sant Anselmo Carl | Identification symbol, system and method |
| DE3903595A1 (en) * | 1989-02-07 | 1990-08-09 | Proteus Ges Fuer Datentechnik | Method for reading bar codes |
| US4958064A (en) * | 1989-01-30 | 1990-09-18 | Image Recognition Equipment Corporation | Bar code locator for video scanner/reader system |
| US4973829A (en) * | 1988-11-22 | 1990-11-27 | Eastman Kodak Company | Bar code reading method |
| US4988852A (en) * | 1988-07-05 | 1991-01-29 | Teknekron Transportation Systems, Inc. | Bar code reader |
| US4992650A (en) * | 1990-03-29 | 1991-02-12 | International Business Machines Corporation | Method and apparatus for barcode recognition in a digital image |
| US5036182A (en) * | 1988-06-21 | 1991-07-30 | Alps Electric Co., Ltd. | Bar code reading and decoding apparatus |
| US5045677A (en) * | 1987-09-28 | 1991-09-03 | Sumitomo Electric Industries, Ltd. | Combining bar code read data from a plurality of scanning lines formed from one-dimensional images |
| US5073954A (en) * | 1989-02-28 | 1991-12-17 | Electrocom Automation, Inc. | Bar code location and recognition processing system |
| US5081689A (en) * | 1989-03-27 | 1992-01-14 | Hughes Aircraft Company | Apparatus and method for extracting edges and lines |
| US5120940A (en) * | 1990-08-10 | 1992-06-09 | The Boeing Company | Detection of barcodes in binary images with arbitrary orientation |
| US5142592A (en) * | 1990-12-17 | 1992-08-25 | Moler Keith E | Method and apparatus for detection of parallel edges in image processing |
| US5155343A (en) * | 1990-03-28 | 1992-10-13 | Chandler Donald G | Omnidirectional bar code reader with method and apparatus for detecting and scanning a bar code symbol |
| US5155344A (en) * | 1988-05-10 | 1992-10-13 | Bertin & Cie | Method and device for reading a bar code of variable orientation on a substantially motionless medium |
| US5200598A (en) * | 1988-06-29 | 1993-04-06 | Rencontre Stephen C | Optical reader |
| US5276315A (en) * | 1992-05-14 | 1994-01-04 | United Parcel Service Of America, Inc. | Method and apparatus for processing low resolution images of degraded bar code symbols |
| US5286960A (en) * | 1991-11-04 | 1994-02-15 | Welch Allyn, Inc. | Method of programmable digitization and bar code scanning apparatus employing same |
| US5296691A (en) * | 1992-09-14 | 1994-03-22 | Lazerdata Corporation | Scanning device for reconstructing a complete code from scanned segments |
| US5296690A (en) * | 1991-03-28 | 1994-03-22 | Omniplanar, Inc. | System for locating and determining the orientation of bar codes in a two-dimensional image |
| US5319181A (en) * | 1992-03-16 | 1994-06-07 | Symbol Technologies, Inc. | Method and apparatus for decoding two-dimensional bar code using CCD/CMD camera |
-
1993
- 1993-01-29 US US08/011,642 patent/US5384451A/en not_active Expired - Lifetime
-
1994
- 1994-10-25 US US08/328,518 patent/US5545887A/en not_active Expired - Lifetime
Patent Citations (24)
| Publication number | Priority date | Publication date | Assignee | Title |
|---|---|---|---|---|
| US4618991A (en) * | 1983-05-23 | 1986-10-21 | Hitachi, Ltd. | Processing method for the rotation of an image |
| US4720745A (en) * | 1983-06-22 | 1988-01-19 | Digivision, Inc. | Method and apparatus for enhancing video displays |
| US4652731A (en) * | 1984-08-10 | 1987-03-24 | Thomson-Csf | Process and device for detecting bar codes |
| US5045677A (en) * | 1987-09-28 | 1991-09-03 | Sumitomo Electric Industries, Ltd. | Combining bar code read data from a plurality of scanning lines formed from one-dimensional images |
| US4924078A (en) * | 1987-11-25 | 1990-05-08 | Sant Anselmo Carl | Identification symbol, system and method |
| US5155344A (en) * | 1988-05-10 | 1992-10-13 | Bertin & Cie | Method and device for reading a bar code of variable orientation on a substantially motionless medium |
| US5036182A (en) * | 1988-06-21 | 1991-07-30 | Alps Electric Co., Ltd. | Bar code reading and decoding apparatus |
| US5200598A (en) * | 1988-06-29 | 1993-04-06 | Rencontre Stephen C | Optical reader |
| US4988852A (en) * | 1988-07-05 | 1991-01-29 | Teknekron Transportation Systems, Inc. | Bar code reader |
| US4873426A (en) * | 1988-08-03 | 1989-10-10 | Image Business Systems Corporation | Technique for reading bar codes |
| US4973829A (en) * | 1988-11-22 | 1990-11-27 | Eastman Kodak Company | Bar code reading method |
| US4958064A (en) * | 1989-01-30 | 1990-09-18 | Image Recognition Equipment Corporation | Bar code locator for video scanner/reader system |
| DE3903595A1 (en) * | 1989-02-07 | 1990-08-09 | Proteus Ges Fuer Datentechnik | Method for reading bar codes |
| US5073954A (en) * | 1989-02-28 | 1991-12-17 | Electrocom Automation, Inc. | Bar code location and recognition processing system |
| US5081689A (en) * | 1989-03-27 | 1992-01-14 | Hughes Aircraft Company | Apparatus and method for extracting edges and lines |
| US5155343A (en) * | 1990-03-28 | 1992-10-13 | Chandler Donald G | Omnidirectional bar code reader with method and apparatus for detecting and scanning a bar code symbol |
| US4992650A (en) * | 1990-03-29 | 1991-02-12 | International Business Machines Corporation | Method and apparatus for barcode recognition in a digital image |
| US5120940A (en) * | 1990-08-10 | 1992-06-09 | The Boeing Company | Detection of barcodes in binary images with arbitrary orientation |
| US5142592A (en) * | 1990-12-17 | 1992-08-25 | Moler Keith E | Method and apparatus for detection of parallel edges in image processing |
| US5296690A (en) * | 1991-03-28 | 1994-03-22 | Omniplanar, Inc. | System for locating and determining the orientation of bar codes in a two-dimensional image |
| US5286960A (en) * | 1991-11-04 | 1994-02-15 | Welch Allyn, Inc. | Method of programmable digitization and bar code scanning apparatus employing same |
| US5319181A (en) * | 1992-03-16 | 1994-06-07 | Symbol Technologies, Inc. | Method and apparatus for decoding two-dimensional bar code using CCD/CMD camera |
| US5276315A (en) * | 1992-05-14 | 1994-01-04 | United Parcel Service Of America, Inc. | Method and apparatus for processing low resolution images of degraded bar code symbols |
| US5296691A (en) * | 1992-09-14 | 1994-03-22 | Lazerdata Corporation | Scanning device for reconstructing a complete code from scanned segments |
Cited By (97)
| Publication number | Priority date | Publication date | Assignee | Title |
|---|---|---|---|---|
| US5979768A (en) * | 1988-01-14 | 1999-11-09 | Intermec I.P. Corp. | Enhanced bar code resolution through relative movement of sensor and object |
| US6688523B1 (en) | 1988-08-31 | 2004-02-10 | Intermec Ip Corp. | System for reading optical indicia |
| US5648649A (en) * | 1995-07-28 | 1997-07-15 | Symbol Technologies, Inc. | Flying spot optical scanner with a high speed dithering motion |
| US5777308A (en) * | 1995-08-14 | 1998-07-07 | Intermec Corporation | Resolution gain on width modulated bar codes by use of angled sampling in two dimensions |
| US5742037A (en) * | 1996-03-07 | 1998-04-21 | Cognex Corp. | Method and apparatus for high speed identification of objects having an identifying feature |
| US5764798A (en) * | 1996-03-18 | 1998-06-09 | Intermec Corporation | Prioritized searching methods for finding a coded symbol in a digitized image |
| US6123261A (en) * | 1997-05-05 | 2000-09-26 | Roustaei; Alexander R. | Optical scanner and image reader for reading images and decoding optical information including one and two dimensional symbologies at variable depth of field |
| US6377698B1 (en) * | 1997-11-17 | 2002-04-23 | Datalogic S.P.A. | Method of locating highly variable brightness or color regions in an image |
| US6324299B1 (en) | 1998-04-03 | 2001-11-27 | Cognex Corporation | Object image search using sub-models |
| US6411734B1 (en) | 1998-04-03 | 2002-06-25 | Cognex Corporation | Object image search using validated sub-model poses |
| US6424734B1 (en) | 1998-04-03 | 2002-07-23 | Cognex Corporation | Fiducial mark search using sub-models |
| US6252986B1 (en) | 1998-04-03 | 2001-06-26 | Cognex Corporation | Locating an image of an object having a concentric profile |
| US6681039B1 (en) | 1998-04-03 | 2004-01-20 | Cognex Corporation | Fiducial mark search using sub-models |
| US6516092B1 (en) | 1998-05-29 | 2003-02-04 | Cognex Corporation | Robust sub-model shape-finder |
| US8249362B1 (en) | 1998-07-13 | 2012-08-21 | Cognex Corporation | Method for fast, robust, multi-dimensional pattern recognition |
| US8244041B1 (en) | 1998-07-13 | 2012-08-14 | Cognex Corporation | Method for fast, robust, multi-dimensional pattern recognition |
| US8867847B2 (en) | 1998-07-13 | 2014-10-21 | Cognex Technology And Investment Corporation | Method for fast, robust, multi-dimensional pattern recognition |
| US8363972B1 (en) | 1998-07-13 | 2013-01-29 | Cognex Corporation | Method for fast, robust, multi-dimensional pattern recognition |
| US8229222B1 (en) | 1998-07-13 | 2012-07-24 | Cognex Corporation | Method for fast, robust, multi-dimensional pattern recognition |
| US8254695B1 (en) | 1998-07-13 | 2012-08-28 | Cognex Corporation | Method for fast, robust, multi-dimensional pattern recognition |
| US8363942B1 (en) | 1998-07-13 | 2013-01-29 | Cognex Technology And Investment Corporation | Method for fast, robust, multi-dimensional pattern recognition |
| US8363956B1 (en) | 1998-07-13 | 2013-01-29 | Cognex Corporation | Method for fast, robust, multi-dimensional pattern recognition |
| US8265395B1 (en) | 1998-07-13 | 2012-09-11 | Cognex Corporation | Method for fast, robust, multi-dimensional pattern recognition |
| US8270748B1 (en) | 1998-07-13 | 2012-09-18 | Cognex Corporation | Method for fast, robust, multi-dimensional pattern recognition |
| US8335380B1 (en) | 1998-07-13 | 2012-12-18 | Cognex Corporation | Method for fast, robust, multi-dimensional pattern recognition |
| US8295613B1 (en) | 1998-07-13 | 2012-10-23 | Cognex Corporation | Method for fast, robust, multi-dimensional pattern recognition |
| US8331673B1 (en) | 1998-07-13 | 2012-12-11 | Cognex Corporation | Method for fast, robust, multi-dimensional pattern recognition |
| US8320675B1 (en) | 1998-07-13 | 2012-11-27 | Cognex Corporation | Method for fast, robust, multi-dimensional pattern recognition |
| US6963338B1 (en) | 1998-07-31 | 2005-11-08 | Cognex Corporation | Method for refining geometric description models using images |
| US6459820B1 (en) | 1998-08-25 | 2002-10-01 | Cognex Corporation | Gauging using sub-model poses |
| US6526165B1 (en) | 1998-11-30 | 2003-02-25 | Cognex Corporation | Methods and apparatuses for refining a geometric description of an object having a plurality of extensions |
| US6571006B1 (en) | 1998-11-30 | 2003-05-27 | Cognex Corporation | Methods and apparatuses for measuring an extent of a group of objects within an image |
| US6267293B1 (en) * | 1999-02-22 | 2001-07-31 | Cimatrix | Bar code scanning system and method |
| US6614926B1 (en) | 1999-06-29 | 2003-09-02 | Cognex Corporation | Methods and apparatuses for generating from an image a model of an object |
| US6813377B1 (en) | 1999-08-06 | 2004-11-02 | Cognex Corporation | Methods and apparatuses for generating a model of an object from an image of the object |
| US6898333B1 (en) | 1999-08-06 | 2005-05-24 | Cognex Corporation | Methods and apparatus for determining the orientation of an object in an image |
| US6950548B1 (en) | 2000-05-17 | 2005-09-27 | Cognex Corporation | Creating geometric model descriptions for use in machine vision inspection systems |
| US20060091226A1 (en) * | 2000-06-30 | 2006-05-04 | Silverbrook Research Pty Ltd | Dot-based data package template |
| US20070045428A1 (en) * | 2000-06-30 | 2007-03-01 | Silverbrook Research Pty Ltd | Printed tag with location and orientation components for an optical reader |
| US7152805B2 (en) * | 2000-06-30 | 2006-12-26 | Silverbrook Research Pty Ltd | Dot-based data package template |
| US6804416B1 (en) | 2001-03-16 | 2004-10-12 | Cognex Corporation | Method and system for aligning geometric object models with images |
| US20020143814A1 (en) * | 2001-03-27 | 2002-10-03 | The Code Corporation | Systems and methods for automatic insertion of machine-readable graphical codes into printable documents |
| US7072974B2 (en) | 2001-03-27 | 2006-07-04 | The Code Corporation | Extensible application interface using machine-readable graphical codes |
| US7185824B2 (en) | 2001-04-13 | 2007-03-06 | The Code Corporation | System and method for associating pre-printed machine-readable graphical codes with electronically-accessible data |
| US6978038B2 (en) | 2001-04-13 | 2005-12-20 | The Code Corporation | Systems and methods for pixel gain compensation in machine-readable graphical codes |
| US20060032920A1 (en) * | 2001-04-13 | 2006-02-16 | The Code Corporation | System and method for encoding and decoding data and references to data in machine-readable graphical codes |
| US20020150309A1 (en) * | 2001-04-13 | 2002-10-17 | The Code Corporation | Systems and methods for pixel gain compensation in machine-readable graphical codes |
| US20020152241A1 (en) * | 2001-04-13 | 2002-10-17 | The Code Corporation | System and method for encoding and decoding data and references to data in machine-readable graphical codes |
| US7428981B2 (en) | 2001-04-13 | 2008-09-30 | The Code Corporation | System and method for encoding and decoding data and references to data in machine-readable graphical codes |
| US20020149793A1 (en) * | 2001-04-13 | 2002-10-17 | The Code Corporation | System and method for associating pre-printed machine-readable graphical codes with electronically-accessible data |
| US6957769B2 (en) | 2001-04-13 | 2005-10-25 | The Code Corporation | System and method for encoding and decoding data and references to data in machine-readable graphical codes |
| US20030163800A1 (en) * | 2002-02-27 | 2003-08-28 | Weiyang Zhou | System and method for generating graphical codes containing a plurality of data fields |
| US20030163396A1 (en) * | 2002-02-27 | 2003-08-28 | John Blankevoort | Systems and methods for tracking products as they move through a supply chain |
| US20040030991A1 (en) * | 2002-04-22 | 2004-02-12 | Paul Hepworth | Systems and methods for facilitating automatic completion of an electronic form |
| US20040019893A1 (en) * | 2002-07-29 | 2004-01-29 | Hepworth Paul J. | Systems and methods for interfacing multiple types of object identifiers and object identifier readers to multiple types of applications |
| US20040163051A1 (en) * | 2002-07-29 | 2004-08-19 | Paul Hepworth | Systems and methods for interfacing object identifier readers to multiple types of applications |
| US20040158604A1 (en) * | 2002-07-29 | 2004-08-12 | Paul Hepworth | Data collection device with integrated data translation |
| US20060138236A1 (en) * | 2002-07-29 | 2006-06-29 | The Code Corporation | System and method for controlling the distribution of data translation components to portable data collection devices |
| US7392933B2 (en) | 2002-07-29 | 2008-07-01 | The Code Corporation | Systems and methods for interfacing multiple types of object identifiers and object identifier readers to multiple types of applications |
| US7097099B2 (en) | 2002-07-29 | 2006-08-29 | The Code Corporation | Data collection device with integrated data translation |
| US7621453B2 (en) | 2002-07-29 | 2009-11-24 | The Code Corporation | System and method for controlling the distribution of data translation components to portable data collection devices |
| US7070091B2 (en) | 2002-07-29 | 2006-07-04 | The Code Corporation | Systems and methods for interfacing object identifier readers to multiple types of applications |
| US6802450B2 (en) * | 2002-08-07 | 2004-10-12 | Shenzhen Syscan Technology Co. Ltd | Guiding a scanning device to decode 2D symbols |
| US20040026511A1 (en) * | 2002-08-07 | 2004-02-12 | Shenzhen Syscan Technology Co., Limited. | Guiding a scanning device to decode 2D symbols |
| US20040086182A1 (en) * | 2002-10-30 | 2004-05-06 | Bian Long Xiang | Barcode detection system |
| US7050631B2 (en) * | 2002-10-30 | 2006-05-23 | Sick Auto Ident, Inc. | Barcode detection system |
| US8345979B2 (en) | 2003-07-22 | 2013-01-01 | Cognex Technology And Investment Corporation | Methods for finding and characterizing a deformed pattern in an image |
| US8081820B2 (en) | 2003-07-22 | 2011-12-20 | Cognex Technology And Investment Corporation | Method for partitioning a pattern into optimized sub-patterns |
| US7190834B2 (en) | 2003-07-22 | 2007-03-13 | Cognex Technology And Investment Corporation | Methods for finding and characterizing a deformed pattern in an image |
| US9147252B2 (en) | 2003-07-22 | 2015-09-29 | Cognex Technology And Investment Llc | Method for partitioning a pattern into optimized sub-patterns |
| US20050117801A1 (en) * | 2003-07-22 | 2005-06-02 | Jason Davis | Method for partitioning a pattern into optimized sub-patterns |
| US20050018904A1 (en) * | 2003-07-22 | 2005-01-27 | Jason Davis | Methods for finding and characterizing a deformed pattern in an image |
| US6942152B1 (en) | 2004-01-21 | 2005-09-13 | The Code Corporation | Versatile graphical code reader that is configured for efficient decoding |
| US20050173534A1 (en) * | 2004-02-11 | 2005-08-11 | Paul Hepworth | Systems and methods for concurrent image capture and decoding of graphical codes |
| US7519239B2 (en) | 2004-02-11 | 2009-04-14 | The Code Corporation | Systems and methods for concurrent image capture and decoding of graphical codes |
| US20070085162A1 (en) * | 2004-03-31 | 2007-04-19 | O'brien Kevin P | Capping of copper structures in hydrophobic ild using aqueous electro-less bath |
| US20060027661A1 (en) * | 2004-08-09 | 2006-02-09 | Kazukuni Hosoi | Method of decoding a symbol with a low contrast |
| US7311262B2 (en) * | 2004-08-09 | 2007-12-25 | Optoelectronics Co., Ltd. | Method of decoding a symbol with a low contrast |
| US20060039016A1 (en) * | 2004-08-23 | 2006-02-23 | Harrison Shelton E Jr | Polychromatic encoding system, method and device |
| US8670168B1 (en) | 2004-08-23 | 2014-03-11 | Search And Social Media Partners Llc | Polychromatic encoding system, method and device |
| US7710598B2 (en) * | 2004-08-23 | 2010-05-04 | Harrison Jr Shelton E | Polychromatic encoding system, method and device |
| US8437502B1 (en) | 2004-09-25 | 2013-05-07 | Cognex Technology And Investment Corporation | General pose refinement and tracking tool |
| US20060091217A1 (en) * | 2004-11-03 | 2006-05-04 | The Code Corporation | Graphical code reader that is configured for efficient decoder management |
| US7204417B2 (en) * | 2004-11-03 | 2007-04-17 | The Code Corporation | Graphical code reader that is configured for efficient decoder management |
| US20090127326A1 (en) * | 2007-11-20 | 2009-05-21 | Datalogic Scanning, Inc. | Enhanced virtual scan line processing |
| US8172145B2 (en) * | 2007-11-20 | 2012-05-08 | Datalogic ADC, Inc. | Enhanced virtual scan line processing |
| US20120256001A1 (en) * | 2009-12-21 | 2012-10-11 | Datalogic Ip Tech S.R.L. | Method for decoding a linear bar code |
| US8915443B2 (en) * | 2009-12-21 | 2014-12-23 | Datalogic Ip Tech S.R.L. | Method for decoding a linear bar code |
| US20110215152A1 (en) * | 2010-03-08 | 2011-09-08 | Eunice Poon | Method and Apparatus for Creating Pixel Tokens from Machine-Readable Symbols to Improve Decoding Accuracy in Low Resolution Images |
| US8162223B2 (en) | 2010-03-08 | 2012-04-24 | Seiko Epson Corporation | Method and apparatus for creating pixel tokens from machine-readable symbols to improve decoding accuracy in low resolution images |
| US20150001303A1 (en) * | 2013-06-28 | 2015-01-01 | Kodak Alaris Inc. | Determining barcode locations in documents |
| US9378405B2 (en) * | 2013-06-28 | 2016-06-28 | Kodak Alaris Inc. | Determining barcode locations in documents |
| US9659236B2 (en) | 2013-06-28 | 2017-05-23 | Cognex Corporation | Semi-supervised method for training multiple pattern recognition and registration tool models |
| US9679224B2 (en) | 2013-06-28 | 2017-06-13 | Cognex Corporation | Semi-supervised method for training multiple pattern recognition and registration tool models |
| US20170337456A1 (en) * | 2016-05-18 | 2017-11-23 | Arolltech Co., Ltd. | Display device |
| CN107403215A (en) * | 2016-05-18 | 2017-11-28 | 棨研科技有限公司 | Display device |
| US10083384B2 (en) * | 2016-05-18 | 2018-09-25 | Arolltech Co., Ltd. | Display device for displaying barcode |
Also Published As
| Publication number | Publication date |
|---|---|
| US5384451A (en) | 1995-01-24 |
Similar Documents
| Publication | Publication Date | Title |
|---|---|---|
| US5545887A (en) | Method and apparatus for decoding bar code symbols using subpixel scan lines | |
| US5352878A (en) | Method and apparatus for decoding bar code symbols using independent bar and space analysis | |
| US5412197A (en) | Method and apparatus for decoding bar code symbols using gradient signals | |
| US5404003A (en) | Method and apparatus for decoding bar code symbols using byte-based searching | |
| US5478999A (en) | Method and apparatus for decoding bar code symbols along search steps | |
| US5550365A (en) | Method and apparatus for decoding bar code symbols using subpixel interpolation | |
| US5418862A (en) | Method and apparatus for detecting artifact corners in two-dimensional images | |
| US6097839A (en) | Method and apparatus for automatic discriminating and locating patterns such as finder patterns, or portions thereof, in machine-readable symbols | |
| US5438188A (en) | Method and apparatus for decoding bar code images using information from previous scan lines | |
| EP0943132B1 (en) | Method and apparatus for decoding bar code symbols using ratio analysis of module size | |
| EP0561334A2 (en) | Method and apparatus for decoding two-dimensional bar code using CCD/CMD camera | |
| JPH0877289A (en) | Analytical method of circular bar code | |
| WO1996009597A1 (en) | Method and apparatus for detecting and adaptively decoding bar code symbols in continuous images | |
| JP2925515B2 (en) | Method and apparatus for reading barcode symbols in pixel images | |
| JP2864012B2 (en) | Method and apparatus for reading barcode symbols in pixel images | |
| JP2001357350A (en) | Method and device for detecting position of one- dimensional bar code |
Legal Events
| Date | Code | Title | Description |
|---|---|---|---|
| STCF | Information on status: patent grant |
Free format text: PATENTED CASE |
|
| FPAY | Fee payment |
Year of fee payment: 4 |
|
| FPAY | Fee payment |
Year of fee payment: 8 |
|
| FPAY | Fee payment |
Year of fee payment: 12 |