US6282438B1 - Optical system for measuring metabolism in a body and imaging method - Google Patents
Optical system for measuring metabolism in a body and imaging method Download PDFInfo
- Publication number
- US6282438B1 US6282438B1 US09/203,610 US20361098A US6282438B1 US 6282438 B1 US6282438 B1 US 6282438B1 US 20361098 A US20361098 A US 20361098A US 6282438 B1 US6282438 B1 US 6282438B1
- Authority
- US
- United States
- Prior art keywords
- light
- living body
- signal
- subject
- signals
- Prior art date
- Legal status (The legal status is an assumption and is not a legal conclusion. Google has not performed a legal analysis and makes no representation as to the accuracy of the status listed.)
- Expired - Fee Related
Links
Images


Classifications
-
- A—HUMAN NECESSITIES
- A61—MEDICAL OR VETERINARY SCIENCE; HYGIENE
- A61B—DIAGNOSIS; SURGERY; IDENTIFICATION
- A61B5/00—Measuring for diagnostic purposes; Identification of persons
- A61B5/0059—Measuring for diagnostic purposes; Identification of persons using light, e.g. diagnosis by transillumination, diascopy, fluorescence
-
- A—HUMAN NECESSITIES
- A61—MEDICAL OR VETERINARY SCIENCE; HYGIENE
- A61B—DIAGNOSIS; SURGERY; IDENTIFICATION
- A61B5/00—Measuring for diagnostic purposes; Identification of persons
- A61B5/0033—Features or image-related aspects of imaging apparatus classified in A61B5/00, e.g. for MRI, optical tomography or impedance tomography apparatus; arrangements of imaging apparatus in a room
- A61B5/004—Features or image-related aspects of imaging apparatus classified in A61B5/00, e.g. for MRI, optical tomography or impedance tomography apparatus; arrangements of imaging apparatus in a room adapted for image acquisition of a particular organ or body part
- A61B5/0042—Features or image-related aspects of imaging apparatus classified in A61B5/00, e.g. for MRI, optical tomography or impedance tomography apparatus; arrangements of imaging apparatus in a room adapted for image acquisition of a particular organ or body part for the brain
-
- A—HUMAN NECESSITIES
- A61—MEDICAL OR VETERINARY SCIENCE; HYGIENE
- A61B—DIAGNOSIS; SURGERY; IDENTIFICATION
- A61B5/00—Measuring for diagnostic purposes; Identification of persons
- A61B5/145—Measuring characteristics of blood in vivo, e.g. gas concentration, pH value; Measuring characteristics of body fluids or tissues, e.g. interstitial fluid, cerebral tissue
- A61B5/1455—Measuring characteristics of blood in vivo, e.g. gas concentration, pH value; Measuring characteristics of body fluids or tissues, e.g. interstitial fluid, cerebral tissue using optical sensors, e.g. spectral photometrical oximeters
- A61B5/14551—Measuring characteristics of blood in vivo, e.g. gas concentration, pH value; Measuring characteristics of body fluids or tissues, e.g. interstitial fluid, cerebral tissue using optical sensors, e.g. spectral photometrical oximeters for measuring blood gases
- A61B5/14552—Details of sensors specially adapted therefor
-
- A—HUMAN NECESSITIES
- A61—MEDICAL OR VETERINARY SCIENCE; HYGIENE
- A61B—DIAGNOSIS; SURGERY; IDENTIFICATION
- A61B5/00—Measuring for diagnostic purposes; Identification of persons
- A61B5/145—Measuring characteristics of blood in vivo, e.g. gas concentration, pH value; Measuring characteristics of body fluids or tissues, e.g. interstitial fluid, cerebral tissue
- A61B5/1455—Measuring characteristics of blood in vivo, e.g. gas concentration, pH value; Measuring characteristics of body fluids or tissues, e.g. interstitial fluid, cerebral tissue using optical sensors, e.g. spectral photometrical oximeters
- A61B5/14551—Measuring characteristics of blood in vivo, e.g. gas concentration, pH value; Measuring characteristics of body fluids or tissues, e.g. interstitial fluid, cerebral tissue using optical sensors, e.g. spectral photometrical oximeters for measuring blood gases
- A61B5/14553—Measuring characteristics of blood in vivo, e.g. gas concentration, pH value; Measuring characteristics of body fluids or tissues, e.g. interstitial fluid, cerebral tissue using optical sensors, e.g. spectral photometrical oximeters for measuring blood gases specially adapted for cerebral tissue
-
- A—HUMAN NECESSITIES
- A61—MEDICAL OR VETERINARY SCIENCE; HYGIENE
- A61B—DIAGNOSIS; SURGERY; IDENTIFICATION
- A61B5/00—Measuring for diagnostic purposes; Identification of persons
- A61B5/16—Devices for psychotechnics; Testing reaction times ; Devices for evaluating the psychological state
- A61B5/18—Devices for psychotechnics; Testing reaction times ; Devices for evaluating the psychological state for vehicle drivers or machine operators
-
- A—HUMAN NECESSITIES
- A61—MEDICAL OR VETERINARY SCIENCE; HYGIENE
- A61B—DIAGNOSIS; SURGERY; IDENTIFICATION
- A61B5/00—Measuring for diagnostic purposes; Identification of persons
- A61B5/68—Arrangements of detecting, measuring or recording means, e.g. sensors, in relation to patient
- A61B5/6801—Arrangements of detecting, measuring or recording means, e.g. sensors, in relation to patient specially adapted to be attached to or worn on the body surface
- A61B5/6813—Specially adapted to be attached to a specific body part
- A61B5/6814—Head
-
- A—HUMAN NECESSITIES
- A61—MEDICAL OR VETERINARY SCIENCE; HYGIENE
- A61B—DIAGNOSIS; SURGERY; IDENTIFICATION
- A61B2562/00—Details of sensors; Constructional details of sensor housings or probes; Accessories for sensors
- A61B2562/02—Details of sensors specially adapted for in-vivo measurements
- A61B2562/0219—Inertial sensors, e.g. accelerometers, gyroscopes, tilt switches
-
- A—HUMAN NECESSITIES
- A61—MEDICAL OR VETERINARY SCIENCE; HYGIENE
- A61B—DIAGNOSIS; SURGERY; IDENTIFICATION
- A61B2562/00—Details of sensors; Constructional details of sensor housings or probes; Accessories for sensors
- A61B2562/02—Details of sensors specially adapted for in-vivo measurements
- A61B2562/0233—Special features of optical sensors or probes classified in A61B5/00
-
- A—HUMAN NECESSITIES
- A61—MEDICAL OR VETERINARY SCIENCE; HYGIENE
- A61B—DIAGNOSIS; SURGERY; IDENTIFICATION
- A61B2562/00—Details of sensors; Constructional details of sensor housings or probes; Accessories for sensors
- A61B2562/04—Arrangements of multiple sensors of the same type
- A61B2562/046—Arrangements of multiple sensors of the same type in a matrix array
-
- A—HUMAN NECESSITIES
- A61—MEDICAL OR VETERINARY SCIENCE; HYGIENE
- A61B—DIAGNOSIS; SURGERY; IDENTIFICATION
- A61B5/00—Measuring for diagnostic purposes; Identification of persons
- A61B5/05—Detecting, measuring or recording for diagnosis by means of electric currents or magnetic fields; Measuring using microwaves or radio waves
- A61B5/055—Detecting, measuring or recording for diagnosis by means of electric currents or magnetic fields; Measuring using microwaves or radio waves involving electronic [EMR] or nuclear [NMR] magnetic resonance, e.g. magnetic resonance imaging
-
- A—HUMAN NECESSITIES
- A61—MEDICAL OR VETERINARY SCIENCE; HYGIENE
- A61B—DIAGNOSIS; SURGERY; IDENTIFICATION
- A61B5/00—Measuring for diagnostic purposes; Identification of persons
- A61B5/72—Signal processing specially adapted for physiological signals or for diagnostic purposes
- A61B5/7203—Signal processing specially adapted for physiological signals or for diagnostic purposes for noise prevention, reduction or removal
- A61B5/7207—Signal processing specially adapted for physiological signals or for diagnostic purposes for noise prevention, reduction or removal of noise induced by motion artifacts
-
- A—HUMAN NECESSITIES
- A61—MEDICAL OR VETERINARY SCIENCE; HYGIENE
- A61B—DIAGNOSIS; SURGERY; IDENTIFICATION
- A61B5/00—Measuring for diagnostic purposes; Identification of persons
- A61B5/72—Signal processing specially adapted for physiological signals or for diagnostic purposes
- A61B5/7228—Signal modulation applied to the input signal sent to patient or subject; demodulation to recover the physiological signal
-
- A—HUMAN NECESSITIES
- A61—MEDICAL OR VETERINARY SCIENCE; HYGIENE
- A61B—DIAGNOSIS; SURGERY; IDENTIFICATION
- A61B6/00—Apparatus for radiation diagnosis, e.g. combined with radiation therapy equipment
- A61B6/02—Devices for diagnosis sequentially in different planes; Stereoscopic radiation diagnosis
- A61B6/03—Computerised tomographs
-
- A—HUMAN NECESSITIES
- A61—MEDICAL OR VETERINARY SCIENCE; HYGIENE
- A61B—DIAGNOSIS; SURGERY; IDENTIFICATION
- A61B6/00—Apparatus for radiation diagnosis, e.g. combined with radiation therapy equipment
- A61B6/50—Clinical applications
- A61B6/507—Clinical applications involving determination of haemodynamic parameters, e.g. perfusion CT
Definitions
- the present invention relates to a living body optical measurement system and an imaging method in the system and more particularly, to a living body optical measurement system and an imaging method which are adapted to measure in vivo information by using light and to image results of measurement.
- Desired in clinical medical treatment is a system or a method for measuring the interior of a living body with ease without adversely affecting the living body. Measurement using light is very effective to the desirability.
- the first reason for this is that the oxygen metabolic function inside the living body corresponds to the concentration of a specified pigment (hemoglobin, cytochrome aa 3 , myoglobin or the like) in the living body, that is, the concentration of a light absorber and the concentration of the specified pigment can be determined from an absorption amount for light (having wavelengths of from visible rays to near infrared rays).
- the second reason is that light can be handled easily by optical fibers.
- the third reason is that optical measurement does not harm the living body when used within the safety standards.
- a system which utilizes the advantages of the living body measurement based on light to irradiate light having wavelengths of from visible rays to near infrared rays on a living body and measure the interior of the living body from reflection light at a location about 10 to 50 mm distant from an irradiation position is described in, for example, patent disclosures of JP-A-63-277038 and JP-A-5-300887.
- a system for measuring CT images of the oxygen metabolic function from light transmitting through a living body having a thickness of 100 to 200 mm, that is, an optical CT system is described in, for example, patent disclosures of JP-A-60-72542 and JP-A-62-231625.
- a conventional living body optical measurement system is an oximeter for measuring the degree of oxygen saturation in the artery (JP-A-55-24004).
- the oximeter is a system in which light having a plurality of wavelengths is irradiated on a living body, the transmitting light intensity or reflection light intensity from the living body is measured, and spectroscopic characteristics of reduced hemoglobin (Hb) and hemoglobin oxide (HbO2) and pulsation waves are utilized to calculate the degree of oxygen saturation in the artery.
- Hb reduced hemoglobin
- HbO2 hemoglobin oxide
- Also known as a method for measuring the degree of oxygen saturation in tissues of a living body (average degree of oxygen saturation in both the artery system and the vein system) and the hemodynamic amount is a method by Jöbsus et al (JP-A-57-115232). This method utilizes spectroscopic characteristics of Hb and HbO2 to measure the degree of oxygen saturation and the hemodynamic amount in tissues of a living body.
- transmitting light, reflection light and scattering light are not particularly discriminated from each other and the intensity of light which is emitted from a light source, interacts with a living body and then is detected by a photodetector is called the transmitting light intensity.
- a change in hemodynamic movement due to loading is sometimes measured from the difference between the hemodynamic movement when a load is applied to the living body and the change in hemodynamic movement during unloading.
- the hemodynamic movement during unloading is not always constant but changes with time.
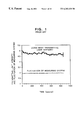
- a time-variable change in transmitting light intensity is shown in FIG. 1 which is obtained when light is irradiated on a temporal of a subject who lies quietly on his or her back and the transmitting light intensity is measured at a point 3 cm distant from a light irradiation position.
- the living body transmitting light intensity changes irregularly and greatly as a whole while exhibiting periodical change components.
- the fluctuation in transmitting light intensity is attributable to a change in the hemodynamic movement in the living body.
- the transmitting light intensity upon start of measurement is treated as the reference value and therefore, there arises a problem that the subject must be kept to be quiet to maintain the reference value and the measurement cannot be proceeded with for a long period of time until the signal becomes stable.
- the measuring time i.e., the number of integral operations of measurement must be increased.
- the measuring time is prolonged and not only a mental burden is imposed on the subject but also the operation efficiency of the system is degraded.
- the present invention intends to solve the prior art problems as above.
- the degree of oxygen saturation in the artery or the hemodynamic movement in the living body tissues can be measured. But, the prior arts cannot discriminate an change in hemodynamic movement due to an overall change in the living body from a change in hemodynamic movement due to a local change in the living body.
- a local portion exists which acts in correspondence to each function of the living body (hereinafter referred to as a functional portion) and the hemodynamic amount or the degree of oxygen saturation at the functional portion of the cerebrum changes locally in correspondence to an arbitrary function of the living body.
- a change in hemodynamic amount or in degree of oxygen saturation at only the arbitrary functional portion can be measured locally, then the action of the cerebral functional portion can be examined in detail, contributing to a great importance from the standpoint of medical science.
- the signal representative of fluctuation in transmitting light intensity in FIG. 1 is difficult to discriminate because an overall hemodynamic movement signal in the living body is accompanied by fluctuation and even when only the local hemodynamic movement changes, a signal indicative of the change is buried in the fluctuation.
- An object of the present invention is to solve the above problems and to realize a living body optical measurement system which images a state of a function of the living body by using simplified detectors through measurement within a short period of time and a method for imaging results of measurement by using the system.
- Another object of the present invention is to perform measurement which is difficult to achieve with the prior arts and in which a local change in hemodynamic movement is measured separately and discriminatively from an overall change in hemodynamic movement in the living body.
- a signal during the non-load time is extracted from the measured signal Sm(t) to predict the function Str(t) indicative of the non-load signal (estimated non-load signal) and the load signal Sl(t) is determined from the difference between the measured signal Sm(t) and the estimated non-load signal Str(t). Further, by displaying the determined measured signal and the predicted non-load signal at a time, thus making it easy to decide whether fluctuation in the measured signal is due to fluctuation in the load or due to fluctuation attributable to the living body during unloading.
- Determination of the function Str(t) can be effected by inputting an arbitrary function having indefinite coefficients into a computer through, for example, a keyboard and determining the indefinite coefficients by, for example, the method of least squares such that the function fits optimally to the non-load signal.
- the load signal Sl(t) does not fall to zero as soon as the load is removed from the living body and therefore, by setting the predetermined relaxation time following the loading time and determining the function Str(t) by using the measuring time corresponding to the unloading time exclusive of the relaxation time, a more accurate function Str(t) can be determined.
- the above function Str(t) can be determined such that a single function can cover a plurality of load times, for example, the entire measuring time or can be determined every load time so as to cover only the respective load times.
- a method of determining functions St(t) for the respective load times by using measured signals Sm(t) obtained before and after each load time high estimated accuracy can be obtained.
- a living body optical measurement system comprises a plurality of light irradiation units for irradiating light rays having the wavelength range of from visible rays to near infrared rays on a subject, a plurality of light receiving units for detecting light rays irradiated from the light irradiation units and transmitting through the interior of the subject, a memory for storing, in time sequence, signals detected by the light receiving units and delivered out of the respective ones of the plurality of light receiving units, an arithmetic unit for performing conversion into signals of measured objects at a plurality of measuring points by using the signals stored in the memory, and an image preparation unit for determining a signal at a measuring position from the output of the arithmetic unit is measured presumptively and displaying the determined signal as an image indicative of an intensity signal on a two-dimensional display screen.
- each of the plurality of light irradiation units includes a plurality of light sources having different wavelengths, modulators for modulating the light rays of the plurality of light sources with different frequencies, and wave guides for guiding a plurality of modulated light rays to the irradiation positions
- each of the plurality of light receiving units includes a splitter for splitting the intensity of light from each of the plurality of light sources having the different wavelengths.
- the presumptive measuring position location is intermediate between the light irradiation unit and the light receiving unit and more specifically, the exact presumptive measuring position is an intermediate portion between a living body surface position irradiated with the light form the light irradiation unit and a light receiving surface position of the living body.
- the light irradiation unit is close to the light receiving unit and therefore, it is not particularly problematic that the presumptive measuring position can be replaced with substantial half the distance between the center of the light irradiation unit and the light receiving unit.
- light from the light irradiation unit is irradiated on the living body and signals are detected by two light receiving units disposed at sites which are symmetrical to the light irradiation unit.
- the difference signal between these signals is produced and an intermediate location between the light receiving unit location and the light irradiation unit which is obtained by positioning the light receiving units through such an adjustment of the two light receiving units that the difference signal is rendered to be zero level.
- light irradiation positions of the plurality of light irradiation means are distributively arranged on a measuring portion of a subject, a plurality of light receiving portions of the plurality of light receiving means are disposed around the distributively arranged light irradiation positions, respectively, and for light signals detected by the plurality of light receiving means, a position on a perpendicular vertical to the living body surface, which position is an intermediate point between the light irradiation position and the light detection position and extending to the interior of the living body is set as a presumptive measuring point.
- the signal at the presumptive measuring point is calculated by the light signal detected by the plural light receiving means. This is because according to spatial characteristics of light density irradiated from the light irradiation position and then reaching the detection position, the density is high immediately below the irradiation position and the detection position near the surface by virtue of scattering of light from the surface but when an arbitrary depth determined by the distance between light irradiation position and detection position and the light scattering characteristics of the living body is exceeded, the density becomes the highest even at an intermediate location between the irradiation position and the detection position and eventually, the sensitivity becomes the highest at the intermediate location.
- Light signal intensity detected in correspondence to the aforementioned presumptive measuring point and measuring point is displayed on a two-dimensional image. When the light signal intensity is desired to be displayed as a topography image, signals at unmeasured locations can be obtained in the form of interpolated signals associated with the aforementioned presumptive measuring points.
- the distance between the irradiation position and the detection position is preferably 10 to 50 mm.
- determination of the factor for determining the maximum distance has relation to the intensity of irradiated light and attenuation in the living body.
- light rays are irradiated from a desired single site or a plurality of sites on a living body, two sites of a detection position at which a local change is measured as a change in signal and a detection position at which a local change is not measured as a change in signal are set to be substantially equidistant from a light irradiation position, transmitting light intensity levels are detected at the respective detection positions, and the difference between transmitting light intensity levels at the two sites is produced, so that a fluctuation component in the living body common to the two detection positions can be removed to permit a slight change in one of the light receiving units to be detected with high sensitivity.
- the light irradiation position is displaced to find the detection positions. Namely, like a stethoscope, wanted measuring positions can be searched.
- transmitting light rays are received at two sites of detection positions equidistant from the incident position and differently positioned, transmitting light intensity levels at the respective detection positions are converted into electric signals by using photoelectric conversion elements such as photodiodes or photomultiplier tubes (hereinafter, electric signals meaning the transmitting light intensities will be referred to as transmitting light intensity signals), the individual transmitting light signal intensity levels are subjected to logarithmic conversion by means of logarithmic amplifiers, and a transmitting light intensity signal at the first detection position and a transmitting light intensity signal at the second detection position are then amplified and detected by differential amplifiers.
- photoelectric conversion elements such as photodiodes or photomultiplier tubes
- the light source can be connected to the light irradiation position through an optical fiber and the light detection position can be connected to the photodetector through an optical fiber.
- information about a measuring position can be determined substantially definitely by the position at which light is irradiated on a subject by the light irradiation means and the position of the light receiving means, the signal processing for displaying the information as an image can be conducted easily at a high speed. Also, with the light receiving means disposed about 10 to 50 mm closely to the light irradiation position, transmitting light is utilized to obtain the detection intensity which is sufficiently high, amounting to about 6 order or more higher than light transmitting through a living body of about 100 to 200 mm. Therefore, measurement can be carried out with simplified photodetectors and can be completed within a short period of time.
- the object to be measure (subject) is the head
- it is known as reported in, for example, “Intracerebral penetration of infrared light” by Patric W. McCormic el al, Journal of Neurosurgery published in February, 1992, Vol.76, paragraphs 315-318) that for the distance between the irradiation position and the detection position being at least 30 mm, detection light transmits through the skin and skull to reach the surface portion of the cerebrum, i.e., the cerebral cortex.
- the living body optical measurement system of the present invention needs a number of light irradiation means and a number of light receiving means for measurement at many positions but as will be described in embodiments to be described later, the system is effective to measurement at a partial position and images can be obtained through a simplified arithmetic processing in which measurement results obtained at a plurality of measuring points are interpolated in association with the respective measuring points.
- FIG. 1 is a graph showing fluctuation in living body transmitting light intensity obtained with a conventional system.
- FIG. 2 is a block diagram showing the construction of an embodiment of a living body optical measurement system according to the present invention.
- FIG. 3 is a diagram for explaining an embodiment of an imaging method using the measuring system of FIG. 2 .
- FIG. 4 is a graph depicting a time-variable change in measured signal at a measuring point in the above embodiment and a time-variable change in estimated non-load signal 15 determined from the measured signal.
- FIG. 5 is a graph depicting a time-variable change in relative change amount of hemoglobin concentration at a measuring point in the above embodiment.
- FIG. 6 is a graph depicting a topography image in the above embodiment.
- FIG. 7 is a graph depicting another example of the topography image in the above embodiment.
- FIG. 8 is a graph depicting an example of display of topography image in the above embodiment.
- FIG. 9 is a diagram for explaining a method for coordinate conversion in another embodiment of the living body optical measurement system of the present invention.
- FIG. 10 is a graph showing an example of display in the measuring system of the present invention.
- FIGS. 11A and 11B are graphs showing examples of display according to the measuring system of the present invention.
- FIGS. 12A and 12B are graphs showing examples of display according to the measuring system of the present invention.
- FIG. 13 is a graph showing an example of display according to the measuring system of the present invention.
- FIG. 14 is a graph showing an example of display according to the measuring system of the present invention.
- FIG. 15 is a block diagram for explaining the construction of a system according to another embodiment of the present invention.
- FIG. 16 is a block diagram for explaining the construction of a system according to another embodiment of the present invention.
- FIGS. 17A and 17B are schematic sectional and bottom views of a light detection probe in another embodiment of the present invention.
- FIG. 18 is a schematic bottom view showing another embodiment of the light detection probe.
- FIG. 19 is a schematic diagram for explaining an example of use of the light detection probe.
- FIG. 20 is a block for explaining the construction of a system according to another embodiment of the present invention.
- FIG. 21 is a block for explaining the construction of a system according to another embodiment of the present invention.
- FIG. 22 is block for explaining the construction of a system according to another embodiment of the present invention.
- FIG. 23 is a block for explaining the construction of a system according to another embodiment of the present invention.
- FIG. 2 shows the construction of an embodiment of a living body optical measurement system according to the present invention.
- the present embodiment is an example in which the living body optical measurement system is applied to the measurement of a change in hemodynamic movement attributable to a cerebral function (a relative change amount of concentration of hemoglobin oxide and reduced hemoglobin).
- a specified portion of the cerebrum is related to control of an in vivo specified function (for example, moving a part of a body such as fingers) and the hemodynamic movement at the specified cerebral portion is changed by activating the specified function.
- the living body optical measurement system can also be used to measure changes in hemodynamic movement under the application of a load for activation of the aforementioned specified function, for example, moving fingers and display measured changes in the form of a contour map on a two-dimensional plane image indicative of the cerebral portion.
- a plurality of light sources 2 a to 2 d having different wavelengths (the light sources 2 a , 2 c and the light sources 2 b , 2 d having the same wavelengths, respectively, which are in the range of from visible rays to near infrared rays), modulators for modulating the intensity of light rays of the plurality of light sources 2 a and 2 b ( 2 c and 2 c ) by means of oscillators 1 a and 1 b ( 1 c and 1 d ) having mutually different frequencies, a plurality of light irradiation means for irradiating light rays from couplers 4 a ( 4 b ), adapted to couple an intensity-modulated light ray propagating through an optical fiber 3 a ( 3 c ) and that propagating through an optical fiber 3 b ( 3 d ), onto different positions on the scalp of a subject 6 standing for an object to be examined through the medium of optical fibers 5
- modulators for modulating the intensity of light ray
- Living body transmitting light rays are collected to optical fibers by means of the six light detection optical fibers 7 a to 7 f and are photoelectrically converted by the photodetectors 8 a to 8 f , respectively.
- the light receiving means is operable to detect and convert light reflected inside the subject into an electric signal and a photoelectric conversion element represented by a photomultiplier tube or a photodiode is used as the photodetector 8 .
- Electric signals indicative of the living body transmitting light intensity levels which are photoelectrically converted by the photodetectors 8 a to 8 f are inputted to lock-in amplifiers 9 a to 9 h , respectively. Since the photodetectors 8 c and 8 d detects living body transmitting light intensity levels collected by the light detection optical fibers 7 c and 7 d which are equidistant from both of the optical fibers 5 a and 5 b , signals from the photodetectors 8 c and 8 d are split into two systems so as to be inputted to the lock-in amplifiers 9 c and 9 e and the lock-in amplifiers 9 d and 9 f .
- the intensity modulation frequencies from the oscillators 1 a and 1 b are inputted, as reference frequencies, to the lock-in amplifiers 9 a to 9 d and the intensity modulation frequencies from the oscillators 1 c and 1 d are inputted, as reference frequencies, to the lock-in amplifiers 9 e to 9 h . Accordingly, living body transmitting light intensity signals associated with the light sources 2 a and 2 b are separately delivered out of the lock-in amplifiers 9 a to 9 d and living body transmitting light intensity signals associated with the light sources 2 c and 2 d are separately delivered out of the lock-in amplifiers 9 e to 9 h.
- the separated transmitting light intensity signals of individual wavelengths delivered out of the lock-in amplifiers 9 e to 9 h are subjected to analog to digital conversion by an analog to digital converter 10 and are then stored in a memory 12 provided internally or externally of a computer 11 .
- the computer 11 uses the transmitting light intensity signals stored in the memory to calculate relative change amounts of concentration values of hemoglobin oxide and reduced hemoglobin which are to be determined from detection signals at individual detection points and stores the calculated amounts in the memory 12 as time-variable information at a plurality of measuring points m. The above calculation will be described later in greater detail.
- a display controller 30 converts the signals stored in the memory means 12 into display signals for a display unit 13 such as a CRT and displays them on the display unit 13 .
- measuring positions are converted into coordinates on the display plane of the subject and treated as signals for intensity signal (relative change amounts of concentration values of hemoglobin oxide and reduced hemoglobin) contour map display at the coordinate positions.
- the spectroscopic positions and the light irradiation positions can be separated in accordance with the intensity modulation frequencies and therefore, even when the number of the light irradiation positions is increased, it suffices that the number of wavelengths of irradiation light rays at the respective light irradiation positions equals the number of absorbers to be measured, and the wavelength of an irradiation light ray need not particularly be changed for the respective light irradiation positions. Accordingly, the number of wavelengths of irradiation light rays used is small and an error due to the influence of scattering which changes with the wavelength can be decreased.
- FIG. 3 is a diagram for explaining an embodiment of an imaging method according to the present invention which uses the living body optical measurement system, showing the relation among the light incident point, the light detection point and the measuring point in the above method.
- the imaging method of the present embodiment is a method for preparing images of relative change amounts of concentration values of hemoglobin oxide and reduced hemoglobin at the head of a subject, wherein four incident points and four detection points are provided at the left temporal participating in the motion function of right fingers of the subject so as to measure living body transmitting light intensity levels and results of measurement obtained under the application of a load of right-finger motion and a load of left-finger motion are imaged.
- light incident points 17 a to 17 d and detection points 18 a to 18 d are disposed on the left temporal of a subject 16 .
- the respective light incident points are in correspondence relationship with the respective detection points through tens sets of 17 a - 18 a , 17 a - 18 b , 17 b - 18 a , 17 b - 18 b , 17 b - 18 c , 17 b - 18 d , 17 c - 18 b , 17 c - 18 c , 17 d - 18 c and 17 d - 18 d .
- the distance between the corresponding light incident point and detection point is 30 mm.
- presumptive measuring points 19 a to 19 j are each set in the middle of the correspondence relation between each incident point and each detection point.
- Information at the presumptive measuring points 19 a to 19 j is determined and the magnitude of the information is displayed in the form of a contour map, a light and shade map or a color discrimination map on the two-dimensional plane as shown in FIG. 3 .
- FIG. 4 is a graph illustrating a measured signal 14 at one of the detection points 18 a to 18 d of the living body optical measurement system and a time-variable change in estimated non-load signal 15 determined from the measured signal 14 in the embodiment of FIG. 3 .
- abscissa represents measuring time and ordinate represents relative concentration change amount.
- the estimated non-load signal 15 is determined by removing from the measured signal 14 signals occurring during time Tt for a load to be applied (loading time) and during time T2 for the signal to recover its intact form following loading (relaxation time) and fitting an arbitrary function to the measured signal 14 occurring during load preceding time T1 and load succeeding time T3 through the use of the method of least squares.
- FIG. 5 is a graph illustrating time-variable changes in relative change amounts of concentration values of hemoglobin oxide and reduced hemoglobin (hereinafter represented by ⁇ Coxy(t) signal 20 and ⁇ Cdeoxy(t) signal 21 , respectively) at one measuring point.
- abscissa represents measuring time and ordinate represents relative concentration change amounts.
- a hatched time interval corresponds to load applying time (motion period of right fingers). From the measured signal 14 and estimated non-load signal 15 of two wavelengths indicated in FIG. 4, the above relative change amounts of concentration value of hemoglobin oxide and reduced hemoglobin (HbO2, Hb) under the application of a load are determined through the following arithmetic operation processing.
- ⁇ oxy( ⁇ ) extinction coefficient of hemoglobin oxide at wavelength ⁇
- Noxy(t) noise or high frequency fluctuation in concentration of hemoglobin oxide at measuring time t
- Ndeoxy(t) noise or high frequency fluctuation in concentration of reduced hemoglobin at measuring time t
- time-variable changes in relative change amounts of concentration values of hemoglobin oxide and reduced hemoglobin under the application of load are represented by ⁇ Coxy(t) and ⁇ Cdeoxy(t) and defined by the following equation:
- the dimension of the concentration change amount is herein the product of concentration and distance d.
- equation (5) distance d acts equally on ⁇ Coxy and ⁇ Cdoxy and so equation (5) is considered as indicating relative change amounts of hemoglobin concentration values.
- equation (4) is reduced to a simultaneous equation with two unknowns for ⁇ Coxy(t) and ⁇ Cdeoxy(t), so that ⁇ Coxy(t) and ⁇ Cdeoxy(t) can be determined from estimated non-load signal Str( ⁇ , t) and measured signal Sm( ⁇ , t) for each wavelength.
- the above procedure is carried out for 0 to 140 seconds to obtain ⁇ Coxy(t) signal 20 and ⁇ Cdeoxy(t) signal 21 of FIG. 5 .
- FIGS. 6 and 7 show contour map images (topographic images) prepared from time-variable changes in relative change amounts of concentration values of hemoglobin oxide at the respective measuring points under the application of loads of left-finger motion and right-finger motion of a subject, respectively.
- a method for preparation of the topography images is such that a time integral (alternatively, time average) of relative change amount ⁇ Coxy(t) signal 20 during load applying time (hatched period in FIG. 5) is calculated by the computer 11 and values between individual measuring points are determined through linear interpolation in X-axis and Y-axis directions.
- the topographic image may include a monochromatic light and shade image and a discrimination display in color. It will be seen by comparing the images of FIGS.
- FIGS. 6 and 7 that the concentration of hemoglobin oxide clearly increases at specified positions during the right hand motion.
- a topography image can also be prepared similarly from relative change amounts of concentration values of hemoglobin oxide which are measured every constant measuring time at the respective measuring points.
- a topographic image can be prepared from the correlation functions at the individual measuring points.
- the correlation function at each measuring point is a function defined by time shift ⁇ and therefore, by preparing topography from a value of the correlation function at the same time shift ⁇ and displaying the topography in accordance with order of ⁇ or displaying it in the form of a moving picture, hemodynamic movement which changes by participating in activation of the cerebral function can be visualized.
- the relative change amount of concentration of hemoglobin oxide is typically used for explanation but the relative change amount of concentration of reduced hemoglobin or the total hemoglobin concentration change amount which is calculated by adding the relative change amount of concentration of hemoglobin oxide and the relative change amount of concentration of reduced hemoglobin may be used to prepare topographic in a similar way.
- FIG. 8 shows a display example in which a topography image 22 prepared through the above-described method is superimposed on a cerebral surface image 23 .
- the topographic image 22 is illustrative of a change in cerebral hemodynamic movement which changes in association with an biological function, it is preferably displayed while being superimposed on the cerebral surface image.
- the cerebral surface image 23 is measured through three-dimensional MRI or three-dimensional X-ray CT and is displayed.
- the topographic image 22 is subjected to coordinate conversion such that coordinates of individual measuring points are positioned on the cerebral surface and values between individual measuring points subject to the coordinate conversion are interpolated to prepare the topographic image.
- color of the overlying topographic image 22 is made to be semitransparent to allow the underlying cerebral surface image to be seen transparently.
- FIG. 9 shows a diagram for explaining a measuring point coordinate converting method.
- a method of taking images of the form of three-dimensional MRI or three-dimensional X-ray CT will hereunder be described specifically.
- 5 a designates an optical fiber for irradiation and 7 a an optical fiber for detection. Information at a portion on the center line between these fibers is presumed for use as information at a desired measuring point. This is because a portion is used at which the supply of the quantity of light from the irradiation fiber is maximized and the signal from an object to be measured is maximized.
- a skin and skeleton image 24 , a cerebral image 25 and a marker image 26 can be displayed on the basis of the imaged form information.
- the images picked up as above have three-dimensional coordinate information.
- a perpendicular 28 passing through a measuring point 27 indicated by the marker image 26 and being vertical to the skin surface at the measuring point 27 or the bottom of the marker image 26 is calculated and a point at which the perpendicular intersects the cerebral image 25 is defined as the measuring point 29 subject to the coordinate conversion.
- the cerebral function As shown in the present embodiment, it is known that when the cerebral function is measured, a change in hemodynamic movement having correlation to load occurs mainly at the cerebral surface (cerebral cortex).
- the depth for coordinate conversion of measuring points can be known. But when an object to be measured is another living body organ such as muscles, the depth for coordinate conversion of measuring points cannot sometimes be known from the anatomical information.
- light propagation of living tissue is calculated in advance through numerical calculation based on the Monte Carlo method to determine a depth best contributing to measured signals and coordinates of the measuring point are converted to the thus determined depth.
- the topographic image has been described as presumptive display image but a different image display method is available.
- a square pixel of arbitrary size having the center of gravity at a presumptive measuring point is set at each presumptive measuring point, each pixel is displayed either in the form of an image in light and shade painted in color in correspondence to a value of each presumptive measuring point, the correspondence being determined in advance, or in the form of a bar graph image indicated by a bar or a length of line which corresponds to a value of each measuring point.
- color arrangement can be selected freely when color is used but for measurement of hemodynamic movement, display in combination of light and shade of red color and light and shade of blue color is preferable. This is because such an image that arterial hemodynamic is red and venous hemodynamic is blue is fixed. For example, the magnitude of positive measured value is displayed in light and shade of red color and the magnitude of negative measured value is displayed in light and shade of blue color.
- FIG. 10 shows an example of display of measured signals and estimated non-load signals.
- Displayed measured signals 110 a and 110 b are output signals from the lock-in amplifier 9 a and estimated non-load signals 111 a and 111 b are calculated from the respective measured signals (calculation method will be described later).
- the estimated non-load signals 111 a and 111 b are displayed on the display unit.
- abscissa represents measuring time and ordinate represents relative values of measured signals indicative of transmitting light intensity levels measured by the living body optical measurement system.
- a loading start mark 112 indicative of a load application starting time point and a loading end mark 113 indicative of a load application ending time point are displayed in the form of straight lines.
- the cerebral cortex region dominating the right-hand motion is measured from the scalp through the skull and the right-hand or left-hand motion is applied as a load (loads 1 and 3 correspond to the right-hand motion and loads 2 and 4 correspond to the left-hand motion).
- the estimated non-load signals 111 a and 111 b are each displayed until a desired time point on an extension of the curve indicative of a time-variable change
- the measured signals 110 a and 110 b and the estimated non-load signals 111 a and 111 b can be displayed simultaneously on real time base during measurement.
- a change in hemodynamic movement occurring in the living body can be decided easily by an observer.
- the estimated non-load signals displayed in advance on real time base can be corrected for display in the phase at which calculation of the estimated non-load signals is settled.
- the estimated non-load signals 111 a and 111 b can be determined by removing signals occurring during the load applying time (loading time) and signals occurring during the time for the signal to recover its intact form following removal of the load (relaxation time) and by fitting an arbitrary function to signals occurring during the remaining period through the method of least squares.
- the arbitrary function and the relaxation time change with the kind of load and measurement locations and so those meeting the purpose of measurement are inputted through the input unit.
- the arbitrary function in the form of a polynomial of degree five is handled and the relaxation time is set to 30 seconds. Further, for the convenience of watching by the observer, different kinds of color or different kinds of lines can be used for display of signals.
- FIGS. 11A and 11B show examples of display of a difference signal between a measured signal and an estimated non-load signal and in these figures, a waveform of a difference signal 114 a obtained by calculating the difference between the measured signal 110 a and the estimated non-load signal 111 a in FIG. 10 and a waveform of a difference signal 114 b obtained by calculating the difference between the measured signal 110 b and the estimated non-load signal 111 b in FIG. 10 are displayed on the display unit.
- abscissa represents measuring time and ordinate represents relative difference signal intensity.
- a load start mark 112 indicative of a load application starting time point and a load end mark 113 indicative of a load application ending time point are displayed in the form of straight lines.
- the present graph is a graph having its center at 0 and so shows a base line 115 .
- waveforms 114 a and 114 b are displayed on different coordinate axes for different light source wavelengths but they can be displayed overlapping each other on the same coordinate axis. Also, for the convenience of watching by an observer, different kinds of color or different kinds of lines can be used for display.
- FIGS. 12A and 12B show examples of display of graphs depicting relative change amounts of concentration values of HbO2 and Hb (hereinafter represented by ⁇ Coxy and ⁇ Cdeoxy, respectively) under the application of load.
- a waveform of a ⁇ Coxy signal 116 a obtained from the measured signal 110 a and estimated non-load signal 111 a in FIG. 10 pursuant to equation (5) and a waveform of a ⁇ Cdeoxy signal 116 b obtained from the measured signal 110 b and estimated non-load signal 111 b in FIG. 10 pursuant to equation (5) are displayed on the display unit.
- abscissa represents measuring time and ordinate represents values of ⁇ Coxy and ⁇ Cdeoxy.
- a load start mark 112 a load end mark 113 and a base line 115 are also displayed.
- all intervals of measuring time are displayed but only desired time intervals (for example, a period including time points before and after the loading time) can be displayed.
- the waveforms 116 a and 116 b are displayed separately on different coordinate axes but they may be displayed overlapping each other on the same coordinate axis.
- the individual signals may be displayed in different kinds of color or in the form of different kinds of lines and for intuitive understanding by an observer, the ⁇ Coxy signal 116 a may be displayed in, for example, a kind of red color and the ⁇ Cdeoxy signal 116 b may be displayed in, for example, a kind of green color.
- the correlation between load and measured signal is easy to understand and fluctuation is removed from the measured signal, thus ensuring that accuracy of signals can be increased.
- FIG. 13 shows an example of display of a ⁇ Coxy loading time integral value 117 a and a ⁇ Cdeoxy loading time integral value 117 b which are obtained during respective loading times.
- the ⁇ Coxy signal 114 a and the ⁇ Cdeoxy signal 114 b in FIGS. 11A and 11B are time integrated during each loading time to determine the ⁇ Coxy loading time integral value 117 a and ⁇ Cdeoxy loading time integral value 117 b , which are displayed in the form of a cubic bar graph for respective load number.
- abscissa represents load number and ordinate represents ⁇ Coxy loading time integral value and ⁇ Cdeoxy loading time integral value.
- a ⁇ Coxy loading time average value and a ⁇ Cdeoxy loading time average time may be displayed. Also, for the convenience of watching by an observer, display in different colors can be used.
- FIG. 14 shows an example of display when measurement is conducted at a plurality of measuring positions by using the living body optical measurement system.
- the portion to be measured is the head and four measuring positions are set on the head.
- a measuring portion image 118 of a subject In the present display example, a measuring portion image 118 of a subject, measuring position marks 119 a to 119 d representative of set measuring positions, graphs 121 a to 121 d corresponding to the respective measuring positions and index lines 120 a to 120 d for indicating the correspondence relation between the respective measuring positions and the respective graphs are displayed on the display unit.
- a head model figure or a measuring portion tomographic image or measuring portion three-dimensional image of a subject itself imaged by an image diagnostic apparatus represented by an MRI apparatus can be used as the measuring portion image 118 .
- FIG. 15 The schematic construction of embodiment 3 of the living body optical measurement system according to the present invention is shown in FIG. 15 .
- Light emitted from a light source 201 is collected using a lens system so as to impinge on an optical fiber 202 for light source.
- the light emitted from the light source is modulated in intensity with a desired frequency f of about 100 Hz to 10 MHz by means of an oscillator 223 in order to remove noises due to external disturbance.
- the light source optical fiber 202 is connected to an optical fiber 204 for light irradiation through an optical fiber coupler 203 a , the light from the light source is transmitted to the light irradiation optical fiber 204 and is irradiated on a subject 206 by way of a light irradiation position 205 .
- the wavelength of the light used depends on spectroscopic characteristics of an in vivo substance of interest but when the oxygen saturation amount and the blood amount are measured from concentration values of Hb and HbO2, a single or a plurality of wavelengths can be selected, for use, from light having the wavelength range of from 600 nm to 1400 nm.
- a semiconductor laser, a titanium/sapphire laser or a light emitting diode can be used as the light source.
- Two light detection optical fibers 207 a and 207 b for detecting light transmitting through the subject 206 and going out of it are disposed at two different sites on the subject 206 .
- the two light detection optical fibers 207 a and 207 b are disposed at two sites which are point symmetrical to a symmetry center of the light irradiation position 205 .
- the light irradiation optical fiber 204 and the light detection optical fibers 207 a and 207 b are held in place by means of an optical fiber fixing member 208 having its surface painted in black.
- the light irradiation optical fiber 204 , light detection optical fibers 207 a and 207 b and optical fiber fixing member 208 are integrally formed into a light detection probe to be detailed later. Since the light detection optical fibers 207 a and 207 b are connected to optical fibers 209 a and 209 b for photodetectors through optical fiber couplers 203 b and 203 c , transmitting light rays detected by the light detection optical fibers 207 a and 207 b are transmitted to photodetectors 210 a and 210 b and subjected to photoelectric conversion by the photodetectors 210 a and 210 b , so that transmitting light intensity levels are delivered in the form of electric signal intensity levels.
- photoelectric conversion elements such as for example photodiodes or photomultiplier tubes.
- lock-in amplifiers 224 a and 224 b Of electric signals indicative of transmitting light intensity levels delivered out of the photodetectors 210 a and 210 b , only frequency components for light intensity modulation of the light source are extracted by lock-in amplifiers 224 a and 224 b , respectively. While an output from the lock-in amplifier 224 a is subjected to logarithmic conversion by a logarithmic amplifier 225 a and then inputted to the negative pole of a differential amplifier 211 , an output from the lock-in amplifier 224 b is subjected to logarithmic conversion by a logarithmic amplifier 225 b and subsequently inputted to the positive pole of the differential amplifier 211 .
- a difference signal between transmitting light intensity levels at the two different sites is delivered out of the differential amplifier 211 as an output signal.
- the output signal from the differential amplifier 211 is sequentially converted into a digital signal by an A/D converter 212 , fetched into a computer 213 and displayed on a display unit 214 as time series data.
- the measured logarithmic difference signal reflects only a change in hemodynamic movement at the local region 215 .
- hemoglobin serving as a main constituent in hemodynamic dominantly acts on extinction the meaning of the measured logarithmic difference signal will be described below.
- Id(t) Ds.exp[ ⁇ [ ⁇ ox( ⁇ )(Cox(t)+ ⁇ Cox(t))+ ⁇ deox( ⁇ ) (Cdeox(t)+ ⁇ Cdeox(t))]I0(t) (6)
- Id′(t) Ds.exp[ ⁇ [ ⁇ ox( ⁇ )Cox(t)+ ⁇ deox( ⁇ )Cdeox(t)]d]I0(t) (7)
- equations (6) and (7) are expressed in terms of natural logarithm and then equation (7) is subtracted from equation (6) to obtain the following equation (8).
- the left side of equation (8) is the measured logarithmic difference signal.
- the logarithmic difference signal measured by using the light source wavelength 805 nm ⁇ 10 nm represents a value corresponding to a change amount in hemodynamic amount [ ⁇ Cox(t)+ ⁇ Cdeox(t)] (hereinafter referred to as relative hemodynamic change amount).
- the number of wavelengths used for the light source is set to two ( ⁇ 1, ⁇ 2)
- different intensity modulation frequencies (f1,f2) are applied to the respective wavelengths and frequency separation is effected by means of the lock-in amplifiers, transmitting light intensity signals of the individual wavelengths can be measured.
- equation (8) holds for the respective wavelengths and a simultaneous equation consisting of the following equations (11) and (12) can be introduced:
- value ⁇ Cox(t)d corresponding to a change amount of hemoglobin oxide and value ⁇ Cdeox(t) corresponding to a change amount of reduced hemoglobin can be determined by solving equations (11) and (12) with the computer 213 and time series data representative of a determined relative change amount can be displayed graphically on the display unit 214 .
- the number of wavelengths can be increased, d can be erased or a relative change amount of concentration of a light absorbing substance, other than hemoglobin, which exists in a small amount can be determined.
- the lock-in amplifiers, logarithmic amplifiers and differential amplifiers may not be used, detection signals from the photodetectors 210 a and 210 b may be converted into digital signals by A/D converters 212 , respectively, the digital signals may then be FFT processed with the computer 213 to extract only a signal corresponding to the intensity modulation frequency of the light source, a logarithmic difference between transmitting light intensity levels at two different detection positions is calculated through a similar procedure to the above calculation process, and the determined relative change amount can be displayed graphically as time series data on the display unit 214 .
- FIGS. 17A and 17B show an example of the light detection probe.
- FIG. 17A illustrates a section of the light detection probe and
- FIG. 17B is a diagram of the light detection probe as viewed from a subject contact surface.
- the light detection probe is comprised of the single light irradiation optical fiber 204 , the two light detection optical fibers 207 a and 207 b and the optical fiber fixing member 208 having its surface painted in black and made of metal or plastics, and the optical fibers are connected with the optical fiber couplers 203 a , 203 b and 203 c .
- each optical fiber is constructed of a plurality of optical fibers.
- plastics or quartz is used.
- each light detection optical fibers 207 a or 207 b must be changed in accordance with the purpose and the state of a subject but when measurement of, for example, the cerebral function is performed, the sectional shape is made to be a circle having a diameter of about 1 mm to 20 mm or a square having a side of about 1 mm to 20 mm.
- a plurality of kinds of light detection probes in which the distance r differs and the sectional shape of each light detection optical fiber 207 a or 207 b differs, are prepared and one probe is exchanged with another in compliance with the purpose of measurement, thereby permitting convenient measurement. Since the light reaching depth substantially equals the distance r from the light source, a depth approximating the cerebral cortex of the cerebrum can be measured from the head surface through the skull.
- the light detection optical fibers 207 can be conceivable.
- four light detection optical fibers 207 a , 207 b , 207 c and 207 d can be disposed at positions r equidistant from the light irradiation optical fiber 204 , and desired two light detection optical fibers can be selected for measurement.
- any optical fiber may not be used but a lens system may be used or a light source and photodetectors can be disposed directly in the fixing member 208 .
- FIG. 19 shows an example where the optical measuring system according to the present invention is used for measurement of the cerebrum of a living body.
- a light detection probe comprised of optical fiber couplers 203 a , 203 b and 203 c , a light irradiation optical fiber 204 , light detection optical fibers 207 a and 207 b , and an optical fiber fixing member 208 is fixed to a subject 206 by means of a fitting belt 218 made of rubber.
- the light irradiation optical fiber 204 is connected to a light source optical fiber 202 through the optical fiber coupler 203 a and the light detection optical fibers 207 a and 207 b are connected to optical fibers 209 a and 209 b for light detection, respectively, through the optical fiber couplers 203 b and 203 c .
- Provided on a front panel of the optical measuring system 219 are connectors for the light source optical fiber 202 and light detection optical fibers 209 a and 209 b , an output signal adjusting knob 220 , an output signal value indicating window 221 and a display unit 214 .
- Arranged in the optical measuring system 219 are the differential amplifiers, A/D converters, microprocessor, light source, photodetectors, optical switches and other necessary electric circuits.
- a logarithmic difference signal value between transmitting light intensity levels detected at two sites is digitally indicated on the output signal value indicating window 221 and an offset value of the logarithmic difference signal value is determined using the output signal adjusting knob 220 .
- the logarithmic difference signal between transmitting light intensity levels detected at the two sites is so adjusted as to be zero.
- measurement is started and time series data 222 representative of the logarithmic difference signal is graphically displayed on the display unit 214 .
- the arithmetic operation described previously is carried out to graphically display a local hemodynamic amount or time-variable changes in relative change amounts of hemoglobin oxide quantity and reduced hemoglobin quantity.
- FIG. 20 The schematic construction of embodiment 4 of the living body optical measurement system according to the present invention is shown in FIG. 20 .
- Light emitted from a light source 201 is collected using a lens system so as to impinge on an optical fiber 202 for light source.
- the light emitted from the light source is modulated in intensity with a desired frequency of about 100 Hz to 10 MHz by means of an oscillator 223 in order to remove noises due to external disturbance.
- the light source optical fiber 202 is connected to an optical fiber 204 for light irradiation through an optical fiber coupler 203 a , the light from the light source is transmitted to the light irradiation optical fiber 204 and is irradiated on a subject 206 by way of a light irradiation position 205 .
- the wavelength of the light used depends on spectroscopic characteristics of an in vivo substance of interest but when the oxygen saturation amount and the blood amount are measured from concentration values of Hb and HbO2, a single or a plurality of wavelengths can be selected, for use, from light having the wavelength range of from 600 nm to 1400 nm.
- a semiconductor laser, a titanium/sapphire laser or a light emitting diode can be used as the light source.
- the two light detection optical fibers 207 b and 207 c are disposed at two sites which are point symmetrical to a symmetry center of the light irradiation position 205
- the light detection optical fiber 207 a is disposed such that the centroid point of the light detection optical fiber 207 a is on a half-line having its origin at the centroid point of the light irradiation position and passing through the centroid point of the light detection optical fiber 207 b
- the light detection optical fiber 207 d is disposed such that the centroid point of the light detection optical fiber 207 d is on a half-line having its origin at the centroid point of the light irradiation position and passing through the centroid point of the light detection optical fiber 207 c .
- the light detection optical fibers 207 a and 207 d can be disposed anywhere so long as their centroid points are on the half-lines but in the present embodiment, they are disposed point-symmetrically to the symmetry center of the light irradiation position 205 and outside the light detection optical fibers 207 b and 207 c .
- the light irradiation optical fiber 204 and the light detection optical fibers 207 a , 207 b , 207 c and 207 d are held in place by means of an optical fiber fixing member 208 made of metal and having its surface painted in black.
- the light detection optical fibers 207 a , 207 b , 207 c and 207 d are connected to optical fibers 209 a , 209 b , 209 c and 209 d for photodetectors through optical fiber couplers 203 b , 203 c , 203 d and 203 e , transmitting light rays detected by the light detection optical fibers 207 a , 207 b , 207 c and 207 d are transmitted to photodetectors 210 a , 210 b , 210 c and 210 d and subjected to photoelectric conversion by the photodetectors 210 , so that transmitting light intensity levels subject to the photoelectric conversion are delivered in the form of electric signal intensity levels.
- photodetectors 210 are photoelectric conversion elements such as for example photodiodes or photomultiplier tubes.
- lock-in amplifiers 224 a and 224 b Of electric signals indicative of transmitting light intensity levels delivered out of the photodetectors 210 a and 210 b , only frequency components for intensity modulation of the light source are extracted by lock-in amplifiers 224 a and 224 b , respectively. While an output from the lock-in amplifier 224 a is subjected to logarithmic conversion by a logarithmic amplifier 225 a and then inputted to the negative pole of a differential amplifier 211 a , an output from the lock-in amplifier 224 b is subjected to logarithmic conversion by a logarithmic amplifier 225 b and subsequently inputted to the positive pole of the differential amplifier 211 a .
- lock-in amplifiers 224 c and 224 d Of electric signals indicative of transmitting light intensity levels delivered out of the photodetectors 210 c and 210 d , only frequency components for intensity modulation of the light source are extracted by lock-in amplifiers 224 c and 224 d , respectively. While an output from the lock-in amplifier 224 d is subjected to logarithmic conversion by a logarithmic amplifier 225 d and then inputted to the negative pole of a differential amplifier 211 b , an output from the lock-in amplifier 224 c is subjected to logarithmic conversion by a logarithmic amplifier 225 c and subsequently inputted to the positive pole of the differential amplifier 211 b .
- an output from the differential amplifier 211 a is inputted to the negative pole of a differential amplifier 211 c and an output from the differential amplifier 211 b is inputted to the positive pole of the differential amplifier 211 c .
- a difference signal among transmitting light intensity levels at the four different sites is delivered out of the differential amplifier 211 c as an output signal.
- the output signal from the differential amplifier 211 c is sequentially converted into a digital signal by an A/D converter 212 , fetched into a computer 213 and displayed graphically on a display unit 214 as time series data.
- the logarithmic differential signal of transmitting light intensity delivered out of the differential amplifier 211 c reflects only a change in local hemodynamic movement.
- hemoglobin serving as a main constituent in hemodynamic dominantly acts on extinction the meaning of the logarithmic difference signal delivered out of the differential amplifier 211 c will be described below.
- measuring time is t
- light source wavelength is ⁇
- irradiation light intensity is I0(t)
- concentration values of hemoglobin oxide and reduced hemoglobin are Cox(t) and Cdeox(t), respectively
- changes in concentration values of hemoglobin oxide and reduced hemoglobin which occur at the local region 215 are ⁇ Cox(t) and ⁇ Cdeox(t), respectively
- extinction coefficients for light source wavelength ⁇ of hemoglobin oxide and reduced hemoglobin are ⁇ ox( ⁇ ) and ⁇ deox( ⁇ ), respectively
- attenuation contained in transmitting light intensity levels detected by the photodetectors 210 b and 210 c and due to scattering and absorption caused by other constituents than hemoglobin is Ds1
- attenuation contained in transmitting light intensity levels detected by the photodetectors 210 a and 210 d and due to scattering and absorption caused by other constituents than hemoglobin is Ds2
- Id 1 (t) Ds1.exp[ ⁇ ox( ⁇ )(Cox(t)+ ⁇ Cox(t))+ ⁇ deox( ⁇ ) (Cdeox(t)+ ⁇ Cdeox(t))]d1]I0(t) (13)
- Id 1 ′(t) Ds1.exp[ ⁇ [ ⁇ ox( ⁇ )Cox(t)+ ⁇ deox( ⁇ ) Cdeox(t)]d1]I0(t) (15)
- Id 2 ′(t) Ds2.exp[ ⁇ [ ⁇ ox( ⁇ )Cox(t)+ ⁇ deox( ⁇ ) Cdeox(t)]d2]I0(t) (16)
- equations (13) and (14) are expressed in terms of natural logarithm and then equation (14) is subtracted from equation (13) to obtain the following equation (17):
- Equations (15) and (16) are expressed in terms of natural logarithm and then equation (16) is subtracted from equation (15) to obtain the following equation (18):
- Equation (17) represents the output of the differential amplifier 211 b and the left side of equation (18) represents the output of the differential amplifier 211 a .
- the left side of equation (19) represents the output of the differential amplifier 211 c , that is, the measured logarithmic difference signal.
- equation (19) can be reduced to the following equation (20):
- the logarithmic difference signal measured using the light source wavelength 805 nm ⁇ 10 nm represents a value corresponding to a relative hemodynamic change amount [ ⁇ Cox(t)+ ⁇ Cdeox(t)].
- value ⁇ Cox(t)(d1 ⁇ d2) corresponding to a change amount of hemoglobin oxide and value ⁇ Cdeox(t)(d1 ⁇ d2) corresponding to a change amount of reduced hemoglobin can be determined by solving equations (21) and (22) with the computer 213 and time series data representative of a determined relative change amount can be displayed graphically on the display unit 214 .
- the number of wavelengths can be increased, (d1 ⁇ d2) can be erased or a relative change amount of concentration of a light absorbing substance, other than hemoglobin, which exists in a small amount can be determined.
- the lock-in amplifiers, logarithmic amplifiers and differential amplifiers may not be used, detection signals from the Photodetectors 210 a , 210 b , 210 c and 210 d may be converted into digital signals by the A/D converters 212 , respectively, the digital signals may then be FFT processed with the computer 213 to extract only a signal corresponding to the intensity modulation frequency of the light source, a logarithmic difference among transmitting light intensity levels at four different detection positions may be calculated through a similar procedure to the above calculation process, and then the determined relative change amount can be displayed graphically as time series data on the display unit 214 .
- FIG. 22 The schematic construction of embodiment 5 of the living body optical measurement system according to the present invention is shown in FIG. 22 .
- Light rays emitted from light sources 201 a and 201 b are collected using lens systems so as to impinge on an optical fiber 202 a for light source and an optical fiber 202 b for light source, respectively.
- the light rays emitted from the respective light sources are modulated in intensity with desired different frequencies f of about 100 Hz to 10 MHZ by means of oscillators 223 a and 223 b in order to remove noises due to external disturbance.
- the intensity modulation frequency for the light source 201 a is set to f1
- the intensity modulation frequency for the light source 201 b is set to f2.
- the light source optical fiber 202 a is connected to an optical fiber 204 a for light irradiation through an optical fiber coupler 203 a and the light source optical fiber 202 b is connected to an optical fiber 204 b for light irradiation through an optical fiber coupler 203 c , the light rays from the respective light sources are transmitted to the light irradiation optical fibers 204 a and 204 b and irradiated on a subject 206 by way of light irradiation positions 205 a and 205 b .
- the light is split at a halfway point of each of the light irradiation optical fibers 204 a and 204 b by means of a splitter 226 a or 226 b and the intensity of each light source is converted into an electric signal by means of a photodetector 210 a or 210 c .
- a reference light intensity signal for the light source 201 a delivered out of the photodetector 210 a , is inputted to a lock-in amplifier 224 a and separated on the basis of a reference frequency from the oscillator 223 a .
- An output of the lock-in amplifier 224 a is inputted to a logarithmic amplifier 225 a so as to undergo logarithmic conversion and then inputted to the negative pole of a differential amplifier 211 a .
- a reference light intensity signal for the light source 201 b , delivered out of the photodetector 210 c , is inputted to a lock-in amplifier 224 d and separated on the basis of a reference frequency from the oscillator 223 b .
- An output of the lock-in amplifier 224 d is inputted to a logarithmic amplifier 225 d so as to undergo logarithmic conversion and then inputted to the negative pole of a differential amplifier 211 b .
- the wavelength of the light used depends on spectroscopic characteristics of an in vivo substance of interest but when the oxygen saturation amount and the hemodynamic amount are measured from concentration values of Hb and HbO2, a single or a plurality of wavelengths can be selected, for use, from light having the wavelength range of from 600 nm to 1400 nm.
- a semiconductor laser, a titanium/sapphire laser or a light emitting diode can be used as the light source.
- one optical fiber 207 for light detection is disposed at a position on the subject 206 which is equidistant from light irradiation positions 205 a and 205 b .
- the light irradiation optical fibers 204 a and 204 b and the light detection optical fiber 207 are held in place by means of an optical fiber fixing member 208 having its surface painted in black.
- the light detection optical fiber 207 is connected to an optical fiber 209 for light detection through an optical fiber coupler 203 b , transmitting light detected by the light detection optical fiber 207 is transmitted to a photodetector 210 b and subjected to photoelectric conversion by the photodetector 210 b , so that the transmitting light intensity is delivered in the form of electrical signal intensity.
- a photoelectric conversion element such as for example a photodiode or a photomultiplier tube.
- the electric signal representative of the transmitting light intensity level delivered out of the photodetector 210 b contains the transmitting light intensity signal for the light source 201 a and the transmitting light intensity signal for the light source 201 b , only an intensity modulation frequency component for the light source 201 a is extracted by a lock-in amplifier 224 b and only an intensity modulation frequency component signal for the light source 201 b is extracted by a lock-in amplifier 224 c .
- An output from the lock-in amplifier 224 b is subjected to logarithmic conversion by a logarithmic amplifier 225 b and then inputted to the positive pole of the differential amplifier 211 a .
- An output from the lock-in amplifier 224 c is subjected to logarithmic conversion by a logarithmic amplifier 225 c and subsequently inputted to the positive pole of the differential amplifier 211 b .
- a logarithmic difference signal between the intensity of the light source 201 a and the transmitting light intensity for the light source 201 a is delivered out of the differential amplifier 211 a as an output signal
- a logarithmic difference signal between the intensity of the light source 201 b and the transmitting light intensity for the light source 201 b is delivered out of the differential amplifier 211 b as an output signal.
- an output from the differential amplifier 211 a is inputted to the negative pole of a differential amplifier 211 c and an output from the differential amplifier 211 b is inputted to the positive pole of the differential amplifier 211 c , so that a logarithmic differential signal between transmitting light intensity levels which is removed of fluctuation in the light source intensity can be delivered out of the differential amplifier 211 c .
- the output signal from the differential amplifier 211 c is sequentially converted into a digital signal by an A/D converter 212 , fetched into a computer 213 and displayed on a display unit 214 as time series data.
- the measured logarithmic differential signal reflects only a change in local hemodynamic movement.
- hemoglobin serving as a main constituent in hemodynamic dominantly acts on extinction the meaning of the measured logarithmic difference signal will be described below.
- measuring time is t
- light source wavelength is ⁇
- irradiation light intensity from the irradiation position 205 b is I0(t)
- irradiation light intensity from the irradiation position 205 a is I0′(t)
- reference light intensity from the splitter 226 b is Ir(t)
- reference light intensity from the splitter 226 b is Ir′(t)
- ratio of splitting to reference light of the splitter is ⁇ indicating that
- concentration values of hemoglobin oxide and reduced hemoglobin are Cox(t) and Cdeox(t), respectively, changes in concentration values of hemoglobin oxide and reduced hemoglobin which occur at the local region 215 are ⁇ Cox(t) and ⁇ Cdeox, respectively, extinction coefficients for light source wavelength ⁇ of hemoglobin oxide and reduced hemoglobin are ⁇ ox( ⁇ ) and ⁇ deox( ⁇ ), respectively, attenuation due to scattering and absorption caused by other constituents than hemoglobin is Ds, and weight coefficient caused by scattering is d, transmitting light intensity signal Id(t) for the light source 201 b detected by the photodetector 210 b , that is, the output from the lock-in amplifier 224 c is given by the following equation (23) and transmitting light intensity signal Id′(t) for the light source 201 a , that is, the output from the lock-in amplifier 224 b is given by the following equation (24):
- Id′(t) Ds.exp[ ⁇ [ ⁇ ox( ⁇ )Cox(t)+ ⁇ deox( ⁇ ) Cdeox(t)]d]I0′(t) (24)
- equations (23) and (24) are expressed in terms of natural logarithm and then equation (23) is reduced to the following equation (25) and equation (24) is reduced to the following equation (26):
- equation (26) is subtracted from equation (25) to obtain the following equation (27):
- equation (30) equals the left side of equation (27)
- the logarithmic difference signal delivered out of the differential amplifier 211 c is equivalent to equation (27).
- equation (27) can be reduced to the following equation (31):
- the logarithmic difference signal measured using the light source wavelength 805 nm ⁇ 10 nm represents a value corresponding to a relative hemodynamic change amount [ ⁇ Cox(t)+ ⁇ Cdeox(t)] ⁇ K.
- intensity modulation frequencies f1, f2, f3, f4 which differ with the respective wavelengths and the respective irradiation positions
- frequency separation is effected by means of the lock-in amplifiers, transmitting light intensity signals for the individual wavelengths and the respective irradiation positions can be measured.
- equation (27) holds for the respective wavelengths and a simultaneous equation consisting of the following equations (32) and (33) can be introduced:
- value ⁇ Cox(t)d corresponding to a change amount of hemoglobin oxide and ⁇ Cdeox(t) corresponding to a change amount of reduced hemoglobin can be determined by solving equations (32) and (33) with the computer 213 and time series data representative of a determined relative change amount can be displayed graphically on the display unit 214 .
- the number of wavelengths can be increased, d can be erased or a relative change amount of concentration of a light absorbing substance, other than hemoglobin, which exists in a small amount can be determined.
- the lock-in amplifiers, logarithmic amplifiers and differential amplifiers may not be used, detection signals from the photodetectors 210 a , 210 b and 210 c may be converted into digital signals by the A/D converters 212 , respectively, the digital signals may then be FFT processed with the computer 213 to extract only signals corresponding to intensity modulation frequencies of the respective light sources, a relative change amount calculated and determined through a similar procedure to the above calculation process can be displayed graphically as time series data on the display unit 214 .
- the low cost light irradiation means and photodetectors are used to realize the simplified arithmetic processing, the high-speed processing can be ensured with an economical system and the living body function in correspondence to a plane image illustrative of the shape of an object to be measured can be imaged, thus ensuring that means effective especially for measurement of the local function of living body can be provided.
- the reference value varies and correct measurement cannot be carried out unless the measurement is delayed until signals to be measured are stabilized by keeping the subject quiet.
- measurement can be conducted without waiting for the stabilization of signals. Further, measured signals can be removed of fluctuation to promote accuracy of signals.
- the first and second detection positions are set at locations which are substantially equidistant from the light irradiation position, transmitting light intensity signals at the respective detection positions equally change with an overall change in hemodynamic movement in a living body. Accordingly, by taking a logarithmic difference between a transmitting light intensity signal at the first detection position and a transmitting light intensity signal at the second detection position, a signal change attributable to the overall hemodynamic movement change can be removed. Further, when a change attributable to local hemodynamic movement is included in only one of transmitting light intensity signals at the first and second detection positions, the transmitting light intensity logarithmic difference signal reflects only the local change in hemodynamic movement.
- the light ray comes into the living body through the light irradiation position and passes through complicated paths while interacting with various tissues of the living body and undergoing scattering and attenuation before it goes out of the living body through the light detection position.
- the logarithmic difference between light intensity levels going out of the living body through positions which are substantially equidistant from the light irradiation position since the logarithmic difference between light intensity levels going out of the living body through positions which are substantially equidistant from the light irradiation position, the influence of scattering and attenuation caused by the tissues of the living body can be cancelled out and a slight signal reflecting the local change in hemodynamic movement can be detected with high accuracy.
- an image of the portion to be cut off can be used to confirm that the cutting-off portion is a portion which does not impair the important in vivo function of the subject.
Abstract
Light rays of a plurality of wavelengths which are modulated in intensity with a plurality of different frequencies are irradiated on a plurality of irradiation positions on the surface of a living body, and time-variable changes in living body transmitting light intensity levels corresponding to the respective wavelengths and the respective irradiation positions are measured at different positions on the surface of the living body. After completion of the measurement or during the measurement, changes in concentration values of absorbers in the living body are determined from the living body transmitting light intensity levels of the plurality of wavelengths detected at the respective detection points and a measuring point is set on a perpendicular extending through an intermediate point between the incident point and each detection point so as to image a function of the living body. In living body optical measurement system and method, the measuring time is shortened by estimating fluctuation attributable to the living body, the presence or absence of a change in measured signal can be decided easily by displaying an estimation signal and a measured signal at a time, and a local change in. hemodynamic movement can be measured by detecting light rays transmitting through the interior of the living body by the two light detectors disposed at different two sites (equidistant from the light incident point) on a subject and by separating only the local change in hemodynamic movement from an overall change in hemodynamic movement in the living body in accordance with a logarithmic difference between the two detection signals.
Description
This application is a continuation of Ser. No. 09/149,155 filed Sep. 8, 1998 which is a continuation of Ser. No. 08/539,871, filed Oct. 6, 1995 now U.S. Pat. No. 5,803,909. This application has a foreign priority dates of Oct. 6, 1994 of JP 06-242592, Feb. 20, 1995 of JP 07-030972 and Aug. 5, 1995 of JP 07-169820.
The present invention relates to a living body optical measurement system and an imaging method in the system and more particularly, to a living body optical measurement system and an imaging method which are adapted to measure in vivo information by using light and to image results of measurement.
Desired in clinical medical treatment is a system or a method for measuring the interior of a living body with ease without adversely affecting the living body. Measurement using light is very effective to the desirability. The first reason for this is that the oxygen metabolic function inside the living body corresponds to the concentration of a specified pigment (hemoglobin, cytochrome aa3, myoglobin or the like) in the living body, that is, the concentration of a light absorber and the concentration of the specified pigment can be determined from an absorption amount for light (having wavelengths of from visible rays to near infrared rays). The second reason is that light can be handled easily by optical fibers. The third reason is that optical measurement does not harm the living body when used within the safety standards.
A system which utilizes the advantages of the living body measurement based on light to irradiate light having wavelengths of from visible rays to near infrared rays on a living body and measure the interior of the living body from reflection light at a location about 10 to 50 mm distant from an irradiation position is described in, for example, patent disclosures of JP-A-63-277038 and JP-A-5-300887. Also, a system for measuring CT images of the oxygen metabolic function from light transmitting through a living body having a thickness of 100 to 200 mm, that is, an optical CT system is described in, for example, patent disclosures of JP-A-60-72542 and JP-A-62-231625.
Known as a conventional living body optical measurement system is an oximeter for measuring the degree of oxygen saturation in the artery (JP-A-55-24004). The oximeter is a system in which light having a plurality of wavelengths is irradiated on a living body, the transmitting light intensity or reflection light intensity from the living body is measured, and spectroscopic characteristics of reduced hemoglobin (Hb) and hemoglobin oxide (HbO2) and pulsation waves are utilized to calculate the degree of oxygen saturation in the artery.
Also known as a method for measuring the degree of oxygen saturation in tissues of a living body (average degree of oxygen saturation in both the artery system and the vein system) and the hemodynamic amount is a method by Jöbsus et al (JP-A-57-115232). This method utilizes spectroscopic characteristics of Hb and HbO2 to measure the degree of oxygen saturation and the hemodynamic amount in tissues of a living body.
To add, in the present specification, transmitting light, reflection light and scattering light are not particularly discriminated from each other and the intensity of light which is emitted from a light source, interacts with a living body and then is detected by a photodetector is called the transmitting light intensity.
Problems that the invention is to solve are three as below.
In order to analyze the function of a living body, a change in hemodynamic movement due to loading is sometimes measured from the difference between the hemodynamic movement when a load is applied to the living body and the change in hemodynamic movement during unloading.
The hemodynamic movement during unloading is not always constant but changes with time. As an example, a time-variable change in transmitting light intensity is shown in FIG. 1 which is obtained when light is irradiated on a temporal of a subject who lies quietly on his or her back and the transmitting light intensity is measured at a point 3 cm distant from a light irradiation position. As illustrated in FIG. 1, while fluctuation in the measuring system is only about 0.3%, the living body transmitting light intensity changes irregularly and greatly as a whole while exhibiting periodical change components. The fluctuation in transmitting light intensity is attributable to a change in the hemodynamic movement in the living body.
Even when the subject keeps quiet, the irregular change occurs in the transmitting light intensity signal in this manner and consequently, when the transmitting light intensity upon start of measurement is treated as a reference value, change in hemodynamic movement due to load is difficult to separate from the measured signal. Further, this causes the observer to be prevented from deciding whether a time-variable change in a measured signal displayed on a display unit or a time-variable change in hemodynamic movement calculated from the measured signal is due to fluctuation owned by the living body or is due to the application of a load. Accordingly, in the prior arts, the transmitting light intensity upon start of measurement is treated as the reference value and therefore, there arises a problem that the subject must be kept to be quiet to maintain the reference value and the measurement cannot be proceeded with for a long period of time until the signal becomes stable.
It has hitherto been known to optically measure the cerebral cortex under the skull with an optical spot by means of a light generating and receiving element and a fiber but measurement of an image of a hemodynamic state covered with the protective tissues such as skin tissues and bone tissues, that is, measurement with a plurality of measuring points has neither been disclosed nor suggested. For example, when oxygen metabolism changes locally, it has been difficult to detect where the change occurs.
For extraction of light signals, the measuring time, i.e., the number of integral operations of measurement must be increased. As a result, the measuring time is prolonged and not only a mental burden is imposed on the subject but also the operation efficiency of the system is degraded.
The present invention intends to solve the prior art problems as above.
With the prior arts, the degree of oxygen saturation in the artery or the hemodynamic movement in the living body tissues can be measured. But, the prior arts cannot discriminate an change in hemodynamic movement due to an overall change in the living body from a change in hemodynamic movement due to a local change in the living body.
On the other hand, only the change in hemodynamic movement due to the local change in the living body is sometimes desired to be detected.
For example, in the cerebrum of the living body, a local portion exists which acts in correspondence to each function of the living body (hereinafter referred to as a functional portion) and the hemodynamic amount or the degree of oxygen saturation at the functional portion of the cerebrum changes locally in correspondence to an arbitrary function of the living body. At that time, if a change in hemodynamic amount or in degree of oxygen saturation at only the arbitrary functional portion can be measured locally, then the action of the cerebral functional portion can be examined in detail, contributing to a great importance from the standpoint of medical science.
For example, the signal representative of fluctuation in transmitting light intensity in FIG. 1 is difficult to discriminate because an overall hemodynamic movement signal in the living body is accompanied by fluctuation and even when only the local hemodynamic movement changes, a signal indicative of the change is buried in the fluctuation.
An object of the present invention is to solve the above problems and to realize a living body optical measurement system which images a state of a function of the living body by using simplified detectors through measurement within a short period of time and a method for imaging results of measurement by using the system.
Another object of the present invention is to perform measurement which is difficult to achieve with the prior arts and in which a local change in hemodynamic movement is measured separately and discriminatively from an overall change in hemodynamic movement in the living body.
(For the first problem)
When a change in hemodynamic movement due to load is measured, measurement is carried out by alternately providing time during which the load is not applied to a living body (unloading time) and time during which the load is applied to the living body (loading time). Here, where a signal measured by the living body optical measurement system (measured signal) is Sm(t), a signal due to a change in hemodynamic movement during unloading (non-load signal) is Str(t), and a signal due to a change in hemodynamic movement during loading (load signal) is Sl(t), the measured signal Sm(t) is given by the following equation (1):
t being the measuring time.
In the present invention, a signal during the non-load time is extracted from the measured signal Sm(t) to predict the function Str(t) indicative of the non-load signal (estimated non-load signal) and the load signal Sl(t) is determined from the difference between the measured signal Sm(t) and the estimated non-load signal Str(t). Further, by displaying the determined measured signal and the predicted non-load signal at a time, thus making it easy to decide whether fluctuation in the measured signal is due to fluctuation in the load or due to fluctuation attributable to the living body during unloading.
Determination of the function Str(t) can be effected by inputting an arbitrary function having indefinite coefficients into a computer through, for example, a keyboard and determining the indefinite coefficients by, for example, the method of least squares such that the function fits optimally to the non-load signal. The load signal Sl(t) does not fall to zero as soon as the load is removed from the living body and therefore, by setting the predetermined relaxation time following the loading time and determining the function Str(t) by using the measuring time corresponding to the unloading time exclusive of the relaxation time, a more accurate function Str(t) can be determined.
The above function Str(t) can be determined such that a single function can cover a plurality of load times, for example, the entire measuring time or can be determined every load time so as to cover only the respective load times. With a method of determining functions St(t) for the respective load times by using measured signals Sm(t) obtained before and after each load time, high estimated accuracy can be obtained.
(For the second problem)
To achieve the above object, a living body optical measurement system according to the present invention comprises a plurality of light irradiation units for irradiating light rays having the wavelength range of from visible rays to near infrared rays on a subject, a plurality of light receiving units for detecting light rays irradiated from the light irradiation units and transmitting through the interior of the subject, a memory for storing, in time sequence, signals detected by the light receiving units and delivered out of the respective ones of the plurality of light receiving units, an arithmetic unit for performing conversion into signals of measured objects at a plurality of measuring points by using the signals stored in the memory, and an image preparation unit for determining a signal at a measuring position from the output of the arithmetic unit is measured presumptively and displaying the determined signal as an image indicative of an intensity signal on a two-dimensional display screen. In particular, each of the plurality of light irradiation units includes a plurality of light sources having different wavelengths, modulators for modulating the light rays of the plurality of light sources with different frequencies, and wave guides for guiding a plurality of modulated light rays to the irradiation positions, and each of the plurality of light receiving units includes a splitter for splitting the intensity of light from each of the plurality of light sources having the different wavelengths.
The presumptive measuring position location is intermediate between the light irradiation unit and the light receiving unit and more specifically, the exact presumptive measuring position is an intermediate portion between a living body surface position irradiated with the light form the light irradiation unit and a light receiving surface position of the living body. Here, however, the light irradiation unit is close to the light receiving unit and therefore, it is not particularly problematic that the presumptive measuring position can be replaced with substantial half the distance between the center of the light irradiation unit and the light receiving unit. Further, in one method for determination of the intermediate position, light from the light irradiation unit is irradiated on the living body and signals are detected by two light receiving units disposed at sites which are symmetrical to the light irradiation unit. The difference signal between these signals is produced and an intermediate location between the light receiving unit location and the light irradiation unit which is obtained by positioning the light receiving units through such an adjustment of the two light receiving units that the difference signal is rendered to be zero level.
To make up the above description, when the function of the interior of a living body is measured using the above living body optical measurement system, light irradiation positions of the plurality of light irradiation means are distributively arranged on a measuring portion of a subject, a plurality of light receiving portions of the plurality of light receiving means are disposed around the distributively arranged light irradiation positions, respectively, and for light signals detected by the plurality of light receiving means, a position on a perpendicular vertical to the living body surface, which position is an intermediate point between the light irradiation position and the light detection position and extending to the interior of the living body is set as a presumptive measuring point. The signal at the presumptive measuring point is calculated by the light signal detected by the plural light receiving means. This is because according to spatial characteristics of light density irradiated from the light irradiation position and then reaching the detection position, the density is high immediately below the irradiation position and the detection position near the surface by virtue of scattering of light from the surface but when an arbitrary depth determined by the distance between light irradiation position and detection position and the light scattering characteristics of the living body is exceeded, the density becomes the highest even at an intermediate location between the irradiation position and the detection position and eventually, the sensitivity becomes the highest at the intermediate location. Light signal intensity detected in correspondence to the aforementioned presumptive measuring point and measuring point is displayed on a two-dimensional image. When the light signal intensity is desired to be displayed as a topography image, signals at unmeasured locations can be obtained in the form of interpolated signals associated with the aforementioned presumptive measuring points.
When the above subject is a living body, the distance between the irradiation position and the detection position is preferably 10 to 50 mm. Here, determination of the factor for determining the maximum distance has relation to the intensity of irradiated light and attenuation in the living body.
(For the third problem)
Advantageously, in the present invention, light rays are irradiated from a desired single site or a plurality of sites on a living body, two sites of a detection position at which a local change is measured as a change in signal and a detection position at which a local change is not measured as a change in signal are set to be substantially equidistant from a light irradiation position, transmitting light intensity levels are detected at the respective detection positions, and the difference between transmitting light intensity levels at the two sites is produced, so that a fluctuation component in the living body common to the two detection positions can be removed to permit a slight change in one of the light receiving units to be detected with high sensitivity. When the aforementioned two sites of detection position cannot be found, the light irradiation position is displaced to find the detection positions. Namely, like a stethoscope, wanted measuring positions can be searched.
Preferably, transmitting light rays are received at two sites of detection positions equidistant from the incident position and differently positioned, transmitting light intensity levels at the respective detection positions are converted into electric signals by using photoelectric conversion elements such as photodiodes or photomultiplier tubes (hereinafter, electric signals meaning the transmitting light intensities will be referred to as transmitting light intensity signals), the individual transmitting light signal intensity levels are subjected to logarithmic conversion by means of logarithmic amplifiers, and a transmitting light intensity signal at the first detection position and a transmitting light intensity signal at the second detection position are then amplified and detected by differential amplifiers.
By modulating light emitted from the light source in intensity and extracting only a frequency component for intensity modulation of a detected signal, noises due to external disturbance can be removed.
The light source can be connected to the light irradiation position through an optical fiber and the light detection position can be connected to the photodetector through an optical fiber.
Since, in the present invention, information about a measuring position can be determined substantially definitely by the position at which light is irradiated on a subject by the light irradiation means and the position of the light receiving means, the signal processing for displaying the information as an image can be conducted easily at a high speed. Also, with the light receiving means disposed about 10 to 50 mm closely to the light irradiation position, transmitting light is utilized to obtain the detection intensity which is sufficiently high, amounting to about 6 order or more higher than light transmitting through a living body of about 100 to 200 mm. Therefore, measurement can be carried out with simplified photodetectors and can be completed within a short period of time.
For example, when the object to be measure (subject) is the head, it is known as reported in, for example, “Intracerebral penetration of infrared light” by Patric W. McCormic el al, Journal of Neurosurgery published in February, 1992, Vol.76, paragraphs 315-318) that for the distance between the irradiation position and the detection position being at least 30 mm, detection light transmits through the skin and skull to reach the surface portion of the cerebrum, i.e., the cerebral cortex. It is also known from characteristics of light propagation in the living body that information from a location which lies on a perpendicular vertical to the surface of the living body and extending to the interior of the living body from an intermediate point between the irradiation and detection positions is contained most richly in light detected at that detection position. Such characteristics are reported in, for example, “Monte Carlo simulation of photon path distribution in multiple scattering media” by Shecha Feng et al, SPIE, Proceedings of photon migration and imaging in random media and tissues, Vol. 1888, paragraphs 78-89, (1993).
The living body optical measurement system of the present invention needs a number of light irradiation means and a number of light receiving means for measurement at many positions but as will be described in embodiments to be described later, the system is effective to measurement at a partial position and images can be obtained through a simplified arithmetic processing in which measurement results obtained at a plurality of measuring points are interpolated in association with the respective measuring points.
FIG. 1 is a graph showing fluctuation in living body transmitting light intensity obtained with a conventional system.
FIG. 2 is a block diagram showing the construction of an embodiment of a living body optical measurement system according to the present invention.
FIG. 3 is a diagram for explaining an embodiment of an imaging method using the measuring system of FIG. 2.
FIG. 4 is a graph depicting a time-variable change in measured signal at a measuring point in the above embodiment and a time-variable change in estimated non-load signal 15 determined from the measured signal.
FIG. 5 is a graph depicting a time-variable change in relative change amount of hemoglobin concentration at a measuring point in the above embodiment.
FIG. 6 is a graph depicting a topography image in the above embodiment.
FIG. 7 is a graph depicting another example of the topography image in the above embodiment.
FIG. 8 is a graph depicting an example of display of topography image in the above embodiment.
FIG. 9 is a diagram for explaining a method for coordinate conversion in another embodiment of the living body optical measurement system of the present invention.
FIG. 10 is a graph showing an example of display in the measuring system of the present invention.
FIGS. 11A and 11B are graphs showing examples of display according to the measuring system of the present invention.
FIGS. 12A and 12B are graphs showing examples of display according to the measuring system of the present invention.
FIG. 13 is a graph showing an example of display according to the measuring system of the present invention.
FIG. 14 is a graph showing an example of display according to the measuring system of the present invention.
FIG. 15 is a block diagram for explaining the construction of a system according to another embodiment of the present invention.
FIG. 16 is a block diagram for explaining the construction of a system according to another embodiment of the present invention.
FIGS. 17A and 17B are schematic sectional and bottom views of a light detection probe in another embodiment of the present invention.
FIG. 18 is a schematic bottom view showing another embodiment of the light detection probe.
FIG. 19 is a schematic diagram for explaining an example of use of the light detection probe.
FIG. 20 is a block for explaining the construction of a system according to another embodiment of the present invention.
FIG. 21 is a block for explaining the construction of a system according to another embodiment of the present invention.
FIG. 22 is block for explaining the construction of a system according to another embodiment of the present invention.
FIG. 23 is a block for explaining the construction of a system according to another embodiment of the present invention.
Embodiments of the present invention will be described hereinafter.
FIG. 2 shows the construction of an embodiment of a living body optical measurement system according to the present invention. The present embodiment is an example in which the living body optical measurement system is applied to the measurement of a change in hemodynamic movement attributable to a cerebral function (a relative change amount of concentration of hemoglobin oxide and reduced hemoglobin). A specified portion of the cerebrum is related to control of an in vivo specified function (for example, moving a part of a body such as fingers) and the hemodynamic movement at the specified cerebral portion is changed by activating the specified function. In one form of the present embodiment, the living body optical measurement system can also be used to measure changes in hemodynamic movement under the application of a load for activation of the aforementioned specified function, for example, moving fingers and display measured changes in the form of a contour map on a two-dimensional plane image indicative of the cerebral portion.
As shown in FIG. 2, there are provided in the present embodiment a plurality of light sources 2 a to 2 d having different wavelengths (the light sources 2 a, 2 c and the light sources 2 b, 2 d having the same wavelengths, respectively, which are in the range of from visible rays to near infrared rays), modulators for modulating the intensity of light rays of the plurality of light sources 2 a and 2 b (2 c and 2 c) by means of oscillators 1 a and 1 b (1 c and 1 d) having mutually different frequencies, a plurality of light irradiation means for irradiating light rays from couplers 4 a (4 b), adapted to couple an intensity-modulated light ray propagating through an optical fiber 3 a (3 c) and that propagating through an optical fiber 3 b (3 d), onto different positions on the scalp of a subject 6 standing for an object to be examined through the medium of optical fibers 5 a (5 b), and a plurality of light receiving means comprised of photodetectors 8 a to 8 f provided for a plurality of optical fibers 7 a to 7 d for light detection and a plurality of light detection optical fibers 7 e and 7 f having their tip ends positioned near the light irradiation positions of the plurality of light irradiation means at locations equidistant (assumed herein to be 30 mm) from the light irradiation positions. Living body transmitting light rays are collected to optical fibers by means of the six light detection optical fibers 7 a to 7 f and are photoelectrically converted by the photodetectors 8 a to 8 f, respectively. The light receiving means is operable to detect and convert light reflected inside the subject into an electric signal and a photoelectric conversion element represented by a photomultiplier tube or a photodiode is used as the photodetector 8.
Electric signals indicative of the living body transmitting light intensity levels which are photoelectrically converted by the photodetectors 8 a to 8 f (hereinafter referred to as living body transmitting light intensity signals) are inputted to lock-in amplifiers 9 a to 9 h, respectively. Since the photodetectors 8 c and 8 d detects living body transmitting light intensity levels collected by the light detection optical fibers 7 c and 7 d which are equidistant from both of the optical fibers 5 a and 5 b, signals from the photodetectors 8 c and 8 d are split into two systems so as to be inputted to the lock-in amplifiers 9 c and 9 e and the lock-in amplifiers 9 d and 9 f. The intensity modulation frequencies from the oscillators 1 a and 1 b are inputted, as reference frequencies, to the lock-in amplifiers 9 a to 9 d and the intensity modulation frequencies from the oscillators 1 c and 1 d are inputted, as reference frequencies, to the lock-in amplifiers 9 e to 9 h. Accordingly, living body transmitting light intensity signals associated with the light sources 2 a and 2 b are separately delivered out of the lock-in amplifiers 9 a to 9 d and living body transmitting light intensity signals associated with the light sources 2 c and 2 d are separately delivered out of the lock-in amplifiers 9 e to 9 h.
Exemplarily, for contour map display, the separated transmitting light intensity signals of individual wavelengths delivered out of the lock-in amplifiers 9 e to 9 h are subjected to analog to digital conversion by an analog to digital converter 10 and are then stored in a memory 12 provided internally or externally of a computer 11. During or after measurement, the computer 11 uses the transmitting light intensity signals stored in the memory to calculate relative change amounts of concentration values of hemoglobin oxide and reduced hemoglobin which are to be determined from detection signals at individual detection points and stores the calculated amounts in the memory 12 as time-variable information at a plurality of measuring points m. The above calculation will be described later in greater detail. A display controller 30 converts the signals stored in the memory means 12 into display signals for a display unit 13 such as a CRT and displays them on the display unit 13. In the display signals, measuring positions are converted into coordinates on the display plane of the subject and treated as signals for intensity signal (relative change amounts of concentration values of hemoglobin oxide and reduced hemoglobin) contour map display at the coordinate positions.
By using the living body optical measurement system according to the present embodiment, relative change amounts of concentration values of hemoglobin oxide and reduced hemoglobin in the living body can be measured easily at a high speed. The expanded construction in which the number of light incident points (light irradiation positions) and the number of light detection points are increased can be feasible with ease by increasing the number of intensity modulation frequencies of the light sources, of the light sources, of the photodetectors and of the lock-in amplifiers. With the present living body optical measurement system used, the spectroscopic positions and the light irradiation positions can be separated in accordance with the intensity modulation frequencies and therefore, even when the number of the light irradiation positions is increased, it suffices that the number of wavelengths of irradiation light rays at the respective light irradiation positions equals the number of absorbers to be measured, and the wavelength of an irradiation light ray need not particularly be changed for the respective light irradiation positions. Accordingly, the number of wavelengths of irradiation light rays used is small and an error due to the influence of scattering which changes with the wavelength can be decreased.
FIG. 3 is a diagram for explaining an embodiment of an imaging method according to the present invention which uses the living body optical measurement system, showing the relation among the light incident point, the light detection point and the measuring point in the above method. The imaging method of the present embodiment is a method for preparing images of relative change amounts of concentration values of hemoglobin oxide and reduced hemoglobin at the head of a subject, wherein four incident points and four detection points are provided at the left temporal participating in the motion function of right fingers of the subject so as to measure living body transmitting light intensity levels and results of measurement obtained under the application of a load of right-finger motion and a load of left-finger motion are imaged.
As shown in FIG. 3, light incident points 17 a to 17 d and detection points 18 a to 18 d are disposed on the left temporal of a subject 16. Here, the respective light incident points are in correspondence relationship with the respective detection points through tens sets of 17 a-18 a, 17 a-18 b, 17 b-18 a, 17 b-18 b, 17 b-18 c, 17 b-18 d, 17 c-18 b, 17 c-18 c, 17 d-18 c and 17 d-18 d. The distance between the corresponding light incident point and detection point is 30 mm. Further, as described in the previously-described “Monte Carlo simulations of photon path distribution in multiple scattering media” by Shechao Feng et al, time-variable changes in the relative change amounts of concentration values of hemoglobin oxide and reduced hemoglobin to be determined from measured signals at the respective detection points best reflect information from an intermediate point between the corresponding incident point and detection point and hence, presumptive measuring points 19 a to 19 j are each set in the middle of the correspondence relation between each incident point and each detection point. Information at the presumptive measuring points 19 a to 19 j is determined and the magnitude of the information is displayed in the form of a contour map, a light and shade map or a color discrimination map on the two-dimensional plane as shown in FIG. 3.
Next, there will be described an embodiment of a method according to the present invention for determining relative change amounts of concentration values of hemoglobin, that is, changes in concentration values of hemoglobin at a specified cerebral portion obtained when a specified in vivo function (for example, moving a part of body such as fingers) is activated, from measured signals at the respective light detection points.
FIG. 4 is a graph illustrating a measured signal 14 at one of the detection points 18 a to 18 d of the living body optical measurement system and a time-variable change in estimated non-load signal 15 determined from the measured signal 14 in the embodiment of FIG. 3. In the graph, abscissa represents measuring time and ordinate represents relative concentration change amount.
The estimated non-load signal 15 is determined by removing from the measured signal 14 signals occurring during time Tt for a load to be applied (loading time) and during time T2 for the signal to recover its intact form following loading (relaxation time) and fitting an arbitrary function to the measured signal 14 occurring during load preceding time T1 and load succeeding time T3 through the use of the method of least squares. The present embodiment is handled by using a quadratic linear polynomial as the arbitrary function and setting respective times to T1=40 seconds, T2=30 seconds, Tt=30 seconds and T3=30 seconds.
FIG. 5 is a graph illustrating time-variable changes in relative change amounts of concentration values of hemoglobin oxide and reduced hemoglobin (hereinafter represented by ΔCoxy(t) signal 20 and ΔCdeoxy(t) signal 21, respectively) at one measuring point. In the graph, abscissa represents measuring time and ordinate represents relative concentration change amounts. A hatched time interval corresponds to load applying time (motion period of right fingers). From the measured signal 14 and estimated non-load signal 15 of two wavelengths indicated in FIG. 4, the above relative change amounts of concentration value of hemoglobin oxide and reduced hemoglobin (HbO2, Hb) under the application of a load are determined through the following arithmetic operation processing.
For a wavelength λ, the relation between estimated non-load signal Str(λ, t) and light source intensity I0(λ) is given by the following equation (2) by separating in vivo light attenuation into scattering and absorption:
where
εoxy(λ): extinction coefficient of hemoglobin oxide at wavelength λ
εdeoxy(λ): extinction coefficient of reduced hemoglobin at wavelength λ
A(λ): attenuation due to absorption by other substances than hemoglobin at wavelength λ
S(λ): attenuation due to scattering at wavelength λ
Coxy(t): concentration of hemoglobin oxide at measuring time t
Cdeoxy: concentration of reduced hemoglobin at measuring time t
d: in vivo effective optical path length (in a region of interest)
Also, the relation between measured signal Sm(λ, t) and light source intensity I0(λ) is given by the following equation (3):
where
C′oxy(t): change in concentration of hemoglobin oxide under the application of load at measuring time t
C′deoxy(t): change in concentration of reduced hemoglobin under the application of load at measuring time t
Noxy(t): noise or high frequency fluctuation in concentration of hemoglobin oxide at measuring time t
Ndeoxy(t): noise or high frequency fluctuation in concentration of reduced hemoglobin at measuring time t
Here, if A(λ) and S(λ) remain unchanged under loading and unloading, that is, if a change in the measured signal under the application of load is due to only changes in concentration values of hemoglobin oxide and reduced hemoglobin, the difference between equations (2) and (3) is given by the following equation (4):
Here, time-variable changes in relative change amounts of concentration values of hemoglobin oxide and reduced hemoglobin under the application of load are represented by ΔCoxy(t) and ΔCdeoxy(t) and defined by the following equation:
Usually, it is difficult to specify d and therefore, the dimension of the concentration change amount is herein the product of concentration and distance d.
But, in equation (5), distance d acts equally on ΔCoxy and ΔCdoxy and so equation (5) is considered as indicating relative change amounts of hemoglobin concentration values. When two wavelengths are used for measurement, obtained equation (4) is reduced to a simultaneous equation with two unknowns for ΔCoxy(t) and ΔCdeoxy(t), so that ΔCoxy(t) and ΔCdeoxy(t) can be determined from estimated non-load signal Str(λ, t) and measured signal Sm(λ, t) for each wavelength. Further, what is indicated by ΔCoxy(t) and ΔCdeoxy(t) during a period other than loading time and relaxation time can be formulated by C′oxy(t)=0 and C′deoxy(t)=0, which indicate noises or high frequency fluctuations, attributable to the living body, of concentration of hemoglobin oxide and reduced hemoglobin. The above procedure is carried out for 0 to 140 seconds to obtain ΔCoxy(t) signal 20 and ΔCdeoxy(t) signal 21 of FIG. 5.
FIGS. 6 and 7 show contour map images (topographic images) prepared from time-variable changes in relative change amounts of concentration values of hemoglobin oxide at the respective measuring points under the application of loads of left-finger motion and right-finger motion of a subject, respectively. A method for preparation of the topography images is such that a time integral (alternatively, time average) of relative change amount ΔCoxy(t) signal 20 during load applying time (hatched period in FIG. 5) is calculated by the computer 11 and values between individual measuring points are determined through linear interpolation in X-axis and Y-axis directions. In addition to the contour map, the topographic image may include a monochromatic light and shade image and a discrimination display in color. It will be seen by comparing the images of FIGS. 6 and 7 that the concentration of hemoglobin oxide clearly increases at specified positions during the right hand motion. By displaying this type of spatial distribution information as images, rapid and easy recognition of measurement results can be ensured. While the images shown in FIGS. 6 and 7 are prepared from the time integral values of concentration relative change amounts during the load applying time, a topography image can also be prepared similarly from relative change amounts of concentration values of hemoglobin oxide which are measured every constant measuring time at the respective measuring points. When a plurality of topographic images thus prepared in accordance with order of the measuring time points or displayed as a moving picture, time-variable changes in the relative change amounts of concentration values of hemoglobin oxide can be obtained.
Further, by calculating time-variable changes in relative change amounts of concentration values of hemoglobin oxide at an arbitrary measuring point as well as a self correlation function and a mutual correlation function of time-variable changes in relative change amounts of concentration values of hemoglobin oxide at that arbitrary measuring point and another measuring point, a topographic image can be prepared from the correlation functions at the individual measuring points. The correlation function at each measuring point is a function defined by time shift τ and therefore, by preparing topography from a value of the correlation function at the same time shift τ and displaying the topography in accordance with order of τ or displaying it in the form of a moving picture, hemodynamic movement which changes by participating in activation of the cerebral function can be visualized.
Here, the relative change amount of concentration of hemoglobin oxide is typically used for explanation but the relative change amount of concentration of reduced hemoglobin or the total hemoglobin concentration change amount which is calculated by adding the relative change amount of concentration of hemoglobin oxide and the relative change amount of concentration of reduced hemoglobin may be used to prepare topographic in a similar way.
FIG. 8 shows a display example in which a topography image 22 prepared through the above-described method is superimposed on a cerebral surface image 23. Since the topographic image 22 is illustrative of a change in cerebral hemodynamic movement which changes in association with an biological function, it is preferably displayed while being superimposed on the cerebral surface image. The cerebral surface image 23 is measured through three-dimensional MRI or three-dimensional X-ray CT and is displayed. The topographic image 22 is subjected to coordinate conversion such that coordinates of individual measuring points are positioned on the cerebral surface and values between individual measuring points subject to the coordinate conversion are interpolated to prepare the topographic image. When the prepared topographic image 22 is displayed while being superimposed on the cerebral surface image 23, color of the overlying topographic image 22 is made to be semitransparent to allow the underlying cerebral surface image to be seen transparently.
FIG. 9 shows a diagram for explaining a measuring point coordinate converting method. A method of taking images of the form of three-dimensional MRI or three-dimensional X-ray CT will hereunder be described specifically. In FIG. 9, 5 a designates an optical fiber for irradiation and 7 a an optical fiber for detection. Information at a portion on the center line between these fibers is presumed for use as information at a desired measuring point. This is because a portion is used at which the supply of the quantity of light from the irradiation fiber is maximized and the signal from an object to be measured is maximized. By performing imaging while disposing a marker at the measuring point 29 which is presumptively set by the living body optical measurement system, a skin and skeleton image 24, a cerebral image 25 and a marker image 26 can be displayed on the basis of the imaged form information. The images picked up as above have three-dimensional coordinate information. Thus, a perpendicular 28 passing through a measuring point 27 indicated by the marker image 26 and being vertical to the skin surface at the measuring point 27 or the bottom of the marker image 26 is calculated and a point at which the perpendicular intersects the cerebral image 25 is defined as the measuring point 29 subject to the coordinate conversion. As shown in the present embodiment, it is known that when the cerebral function is measured, a change in hemodynamic movement having correlation to load occurs mainly at the cerebral surface (cerebral cortex). For the reasons set forth as above, by using anatomical information, the depth for coordinate conversion of measuring points can be known. But when an object to be measured is another living body organ such as muscles, the depth for coordinate conversion of measuring points cannot sometimes be known from the anatomical information. In applying the present method to the measurement as above, light propagation of living tissue is calculated in advance through numerical calculation based on the Monte Carlo method to determine a depth best contributing to measured signals and coordinates of the measuring point are converted to the thus determined depth.
The topographic image has been described as presumptive display image but a different image display method is available.
For example, a square pixel of arbitrary size having the center of gravity at a presumptive measuring point is set at each presumptive measuring point, each pixel is displayed either in the form of an image in light and shade painted in color in correspondence to a value of each presumptive measuring point, the correspondence being determined in advance, or in the form of a bar graph image indicated by a bar or a length of line which corresponds to a value of each measuring point.
In all image display methods, color arrangement can be selected freely when color is used but for measurement of hemodynamic movement, display in combination of light and shade of red color and light and shade of blue color is preferable. This is because such an image that arterial hemodynamic is red and venous hemodynamic is blue is fixed. For example, the magnitude of positive measured value is displayed in light and shade of red color and the magnitude of negative measured value is displayed in light and shade of blue color.
A second embodiment according to the present invention will be described.
FIG. 10 shows an example of display of measured signals and estimated non-load signals. Displayed measured signals 110 a and 110 b are output signals from the lock-in amplifier 9 a and estimated non-load signals 111 a and 111 b are calculated from the respective measured signals (calculation method will be described later).
The estimated non-load signals 111 a and 111 b are displayed on the display unit. In the displayed graph, abscissa represents measuring time and ordinate represents relative values of measured signals indicative of transmitting light intensity levels measured by the living body optical measurement system.
When a load is applied to a subject, a loading start mark 112 indicative of a load application starting time point and a loading end mark 113 indicative of a load application ending time point are displayed in the form of straight lines. In the present embodiment, the cerebral cortex region dominating the right-hand motion is measured from the scalp through the skull and the right-hand or left-hand motion is applied as a load ( loads 1 and 3 correspond to the right-hand motion and loads 2 and 4 correspond to the left-hand motion). Although in FIG. 10 all signals occurring throughout the measuring time, only a desired time interval (for example, a time interval including times before and after the loading time) can be displayed easily. Also, if the estimated non-load signals 111 a and 111 b are each displayed until a desired time point on an extension of the curve indicative of a time-variable change, the measured signals 110 a and 110 b and the estimated non-load signals 111 a and 111 b can be displayed simultaneously on real time base during measurement. By simultaneously displaying the measured signals 111 a and 111 b and the estimated non-load signals 111 a and 111 b in this manner, a change in hemodynamic movement occurring in the living body can be decided easily by an observer. The estimated non-load signals displayed in advance on real time base can be corrected for display in the phase at which calculation of the estimated non-load signals is settled.
The estimated non-load signals 111 a and 111 b can be determined by removing signals occurring during the load applying time (loading time) and signals occurring during the time for the signal to recover its intact form following removal of the load (relaxation time) and by fitting an arbitrary function to signals occurring during the remaining period through the method of least squares. Here, the arbitrary function and the relaxation time change with the kind of load and measurement locations and so those meeting the purpose of measurement are inputted through the input unit. In the present embodiment, the arbitrary function in the form of a polynomial of degree five is handled and the relaxation time is set to 30 seconds. Further, for the convenience of watching by the observer, different kinds of color or different kinds of lines can be used for display of signals.
FIGS. 11A and 11B show examples of display of a difference signal between a measured signal and an estimated non-load signal and in these figures, a waveform of a difference signal 114 a obtained by calculating the difference between the measured signal 110 a and the estimated non-load signal 111 a in FIG. 10 and a waveform of a difference signal 114 b obtained by calculating the difference between the measured signal 110 b and the estimated non-load signal 111 b in FIG. 10 are displayed on the display unit. In the displayed graph, abscissa represents measuring time and ordinate represents relative difference signal intensity. Further, when a load is applied to a subject, a load start mark 112 indicative of a load application starting time point and a load end mark 113 indicative of a load application ending time point are displayed in the form of straight lines. Also, the present graph is a graph having its center at 0 and so shows a base line 115.
In the present embodiment, waveforms 114 a and 114 b are displayed on different coordinate axes for different light source wavelengths but they can be displayed overlapping each other on the same coordinate axis. Also, for the convenience of watching by an observer, different kinds of color or different kinds of lines can be used for display.
FIGS. 12A and 12B show examples of display of graphs depicting relative change amounts of concentration values of HbO2 and Hb (hereinafter represented by ΔCoxy and ΔCdeoxy, respectively) under the application of load. A waveform of a ΔCoxy signal 116 a obtained from the measured signal 110 a and estimated non-load signal 111 a in FIG. 10 pursuant to equation (5) and a waveform of a ΔCdeoxy signal 116 b obtained from the measured signal 110 b and estimated non-load signal 111 b in FIG. 10 pursuant to equation (5) are displayed on the display unit. In the displayed graph, abscissa represents measuring time and ordinate represents values of ΔCoxy and ΔCdeoxy. Further, a load start mark 112, a load end mark 113 and a base line 115 are also displayed. In the present embodiment, all intervals of measuring time are displayed but only desired time intervals (for example, a period including time points before and after the loading time) can be displayed. Here, the waveforms 116 a and 116 b are displayed separately on different coordinate axes but they may be displayed overlapping each other on the same coordinate axis. Further, the individual signals may be displayed in different kinds of color or in the form of different kinds of lines and for intuitive understanding by an observer, the ΔCoxy signal 116 a may be displayed in, for example, a kind of red color and the ΔCdeoxy signal 116 b may be displayed in, for example, a kind of green color. According to the measuring method and display method of the present invention, the correlation between load and measured signal is easy to understand and fluctuation is removed from the measured signal, thus ensuring that accuracy of signals can be increased.
FIG. 13 shows an example of display of a ΔCoxy loading time integral value 117 a and a ΔCdeoxy loading time integral value 117 b which are obtained during respective loading times. The ΔCoxy signal 114 a and the ΔCdeoxy signal 114 b in FIGS. 11A and 11B are time integrated during each loading time to determine the ΔCoxy loading time integral value 117 a and ΔCdeoxy loading time integral value 117 b, which are displayed in the form of a cubic bar graph for respective load number. Here, abscissa represents load number and ordinate represents ΔCoxy loading time integral value and ΔCdeoxy loading time integral value. Alternatively, a ΔCoxy loading time average value and a ΔCdeoxy loading time average time may be displayed. Also, for the convenience of watching by an observer, display in different colors can be used.
FIG. 14 shows an example of display when measurement is conducted at a plurality of measuring positions by using the living body optical measurement system. Here, an instance will be described where the portion to be measured is the head and four measuring positions are set on the head.
In the present display example, a measuring portion image 118 of a subject, measuring position marks 119 a to 119 d representative of set measuring positions, graphs 121 a to 121 d corresponding to the respective measuring positions and index lines 120 a to 120 d for indicating the correspondence relation between the respective measuring positions and the respective graphs are displayed on the display unit. Here, a head model figure or a measuring portion tomographic image or measuring portion three-dimensional image of a subject itself imaged by an image diagnostic apparatus represented by an MRI apparatus can be used as the measuring portion image 118.
The schematic construction of embodiment 3 of the living body optical measurement system according to the present invention is shown in FIG. 15.
Light emitted from a light source 201 is collected using a lens system so as to impinge on an optical fiber 202 for light source. The light emitted from the light source is modulated in intensity with a desired frequency f of about 100 Hz to 10 MHz by means of an oscillator 223 in order to remove noises due to external disturbance. Since the light source optical fiber 202 is connected to an optical fiber 204 for light irradiation through an optical fiber coupler 203 a, the light from the light source is transmitted to the light irradiation optical fiber 204 and is irradiated on a subject 206 by way of a light irradiation position 205. The wavelength of the light used depends on spectroscopic characteristics of an in vivo substance of interest but when the oxygen saturation amount and the blood amount are measured from concentration values of Hb and HbO2, a single or a plurality of wavelengths can be selected, for use, from light having the wavelength range of from 600 nm to 1400 nm. A semiconductor laser, a titanium/sapphire laser or a light emitting diode can be used as the light source.
Two light detection optical fibers 207 a and 207 b for detecting light transmitting through the subject 206 and going out of it are disposed at two different sites on the subject 206. In the present embodiment, the two light detection optical fibers 207 a and 207 b are disposed at two sites which are point symmetrical to a symmetry center of the light irradiation position 205. The light irradiation optical fiber 204 and the light detection optical fibers 207 a and 207 b are held in place by means of an optical fiber fixing member 208 having its surface painted in black. For simplicity of construction, the light irradiation optical fiber 204, light detection optical fibers 207 a and 207 b and optical fiber fixing member 208 are integrally formed into a light detection probe to be detailed later. Since the light detection optical fibers 207 a and 207 b are connected to optical fibers 209 a and 209 b for photodetectors through optical fiber couplers 203 b and 203 c, transmitting light rays detected by the light detection optical fibers 207 a and 207 b are transmitted to photodetectors 210 a and 210 b and subjected to photoelectric conversion by the photodetectors 210 a and 210 b, so that transmitting light intensity levels are delivered in the form of electric signal intensity levels. Used as the photodetectors 210 a and 210 b are photoelectric conversion elements such as for example photodiodes or photomultiplier tubes.
Of electric signals indicative of transmitting light intensity levels delivered out of the photodetectors 210 a and 210 b, only frequency components for light intensity modulation of the light source are extracted by lock-in amplifiers 224 a and 224 b, respectively. While an output from the lock-in amplifier 224 a is subjected to logarithmic conversion by a logarithmic amplifier 225 a and then inputted to the negative pole of a differential amplifier 211, an output from the lock-in amplifier 224 b is subjected to logarithmic conversion by a logarithmic amplifier 225 b and subsequently inputted to the positive pole of the differential amplifier 211. As a result, a difference signal between transmitting light intensity levels at the two different sites is delivered out of the differential amplifier 211 as an output signal. The output signal from the differential amplifier 211 is sequentially converted into a digital signal by an A/D converter 212, fetched into a computer 213 and displayed on a display unit 214 as time series data.
Here, when a region 215 where the hemodynamic movement changes locally is included in only a view field 216 b of the light detection optical fiber as shown in FIG. 15, the measured logarithmic difference signal reflects only a change in hemodynamic movement at the local region 215. On the presupposition that for near infrared rays, hemoglobin serving as a main constituent in hemodynamic dominantly acts on extinction, the meaning of the measured logarithmic difference signal will be described below.
Where measuring time is t, light source wavelength is λ, irradiation light intensity is I0(t), concentration values of hemoglobin oxide and reduced hemoglobin are Cox(t) and Cdeox(t), respectively, changes in concentration values of hemoglobin oxide and reduced hemoglobin which occur at the local region 215 are ΔCox(t) and ΔCdeox(t), respectively, extinction coefficients for light source wavelength λ of hemoglobin oxide and reduced hemoglobin are εox(λ) and εdeox(λ), respectively, attenuation due to scattering and absorption caused by other constituents than hemoglobin is Ds and weight coefficient caused by scattering is d, transmitting light intensity signal Id(t) detected by the photodetector 210 b is given by the following equation (6) and transmitting light intensity signal Id′(t) detected by the photodetector 210 a is given by the following equation (7):
Next, equations (6) and (7) are expressed in terms of natural logarithm and then equation (7) is subtracted from equation (6) to obtain the following equation (8). The left side of equation (8) is the measured logarithmic difference signal.
Here, when 805 nm±10 nm is particularly used as the light source wavelength for measurement,
stands and by using constant K, equation (8) can be reduced to
Accordingly, the logarithmic difference signal measured by using the light source wavelength 805 nm±10 nm represents a value corresponding to a change amount in hemodynamic amount [ΔCox(t)+ΔCdeox(t)] (hereinafter referred to as relative hemodynamic change amount). Also, when the number of wavelengths used for the light source is set to two (λ1,λ2), different intensity modulation frequencies (f1,f2) are applied to the respective wavelengths and frequency separation is effected by means of the lock-in amplifiers, transmitting light intensity signals of the individual wavelengths can be measured. Accordingly, equation (8) holds for the respective wavelengths and a simultaneous equation consisting of the following equations (11) and (12) can be introduced:
Since the extinction coefficients εox(λ1), εox(λ2), εdeox(λ1) and εdeox(λ2) are known, value ΔCox(t)d corresponding to a change amount of hemoglobin oxide and value ΔCdeox(t) corresponding to a change amount of reduced hemoglobin can be determined by solving equations (11) and (12) with the computer 213 and time series data representative of a determined relative change amount can be displayed graphically on the display unit 214. For expansion of the above, the number of wavelengths can be increased, d can be erased or a relative change amount of concentration of a light absorbing substance, other than hemoglobin, which exists in a small amount can be determined.
Alternatively, as shown in FIG. 16, the lock-in amplifiers, logarithmic amplifiers and differential amplifiers may not be used, detection signals from the photodetectors 210 a and 210 b may be converted into digital signals by A/D converters 212, respectively, the digital signals may then be FFT processed with the computer 213 to extract only a signal corresponding to the intensity modulation frequency of the light source, a logarithmic difference between transmitting light intensity levels at two different detection positions is calculated through a similar procedure to the above calculation process, and the determined relative change amount can be displayed graphically as time series data on the display unit 214.
FIGS. 17A and 17B show an example of the light detection probe. FIG. 17A illustrates a section of the light detection probe and FIG. 17B is a diagram of the light detection probe as viewed from a subject contact surface.
The light detection probe is comprised of the single light irradiation optical fiber 204, the two light detection optical fibers 207 a and 207 b and the optical fiber fixing member 208 having its surface painted in black and made of metal or plastics, and the optical fibers are connected with the optical fiber couplers 203 a, 203 b and 203 c. In order to maintain flexibility of the individual optical fibers, each optical fiber is constructed of a plurality of optical fibers. As a material of the optical fiber, plastics or quartz is used. When the present light detection probe is used for a living body, the subject contact surface 217 is covered with, for example, resilient sponge.
The size of the detection surface of each light detection optical fibers 207 a or 207 b must be changed in accordance with the purpose and the state of a subject but when measurement of, for example, the cerebral function is performed, the sectional shape is made to be a circle having a diameter of about 1 mm to 20 mm or a square having a side of about 1 mm to 20 mm. The two light detection optical fibers 207 a and 207 b are disposed at positions r (r=5 mm to 50 mm) distant from the light irradiation optical fiber 204 and here, disposed symmetrically. A plurality of kinds of light detection probes, in which the distance r differs and the sectional shape of each light detection optical fiber 207 a or 207 b differs, are prepared and one probe is exchanged with another in compliance with the purpose of measurement, thereby permitting convenient measurement. Since the light reaching depth substantially equals the distance r from the light source, a depth approximating the cerebral cortex of the cerebrum can be measured from the head surface through the skull.
In the light detection probe, various forms of disposition of the light detection optical fibers 207 can be conceivable. For example, as shown in FIG. 18, four light detection optical fibers 207 a, 207 b, 207 c and 207 d can be disposed at positions r equidistant from the light irradiation optical fiber 204, and desired two light detection optical fibers can be selected for measurement. In an alternative, any optical fiber may not be used but a lens system may be used or a light source and photodetectors can be disposed directly in the fixing member 208.
FIG. 19 shows an example where the optical measuring system according to the present invention is used for measurement of the cerebrum of a living body. A light detection probe comprised of optical fiber couplers 203 a, 203 b and 203 c, a light irradiation optical fiber 204, light detection optical fibers 207 a and 207 b, and an optical fiber fixing member 208 is fixed to a subject 206 by means of a fitting belt 218 made of rubber. The light irradiation optical fiber 204 is connected to a light source optical fiber 202 through the optical fiber coupler 203 a and the light detection optical fibers 207 a and 207 b are connected to optical fibers 209 a and 209 b for light detection, respectively, through the optical fiber couplers 203 b and 203 c. Provided on a front panel of the optical measuring system 219 are connectors for the light source optical fiber 202 and light detection optical fibers 209 a and 209 b, an output signal adjusting knob 220, an output signal value indicating window 221 and a display unit 214. Arranged in the optical measuring system 219 are the differential amplifiers, A/D converters, microprocessor, light source, photodetectors, optical switches and other necessary electric circuits.
A logarithmic difference signal value between transmitting light intensity levels detected at two sites is digitally indicated on the output signal value indicating window 221 and an offset value of the logarithmic difference signal value is determined using the output signal adjusting knob 220. For example, in the absence of a local change in hemodynamic movement in the cerebrum of the subject, the logarithmic difference signal between transmitting light intensity levels detected at the two sites is so adjusted as to be zero. Thereafter, measurement is started and time series data 222 representative of the logarithmic difference signal is graphically displayed on the display unit 214. Also, the arithmetic operation described previously is carried out to graphically display a local hemodynamic amount or time-variable changes in relative change amounts of hemoglobin oxide quantity and reduced hemoglobin quantity.
The schematic construction of embodiment 4 of the living body optical measurement system according to the present invention is shown in FIG. 20.
Light emitted from a light source 201 is collected using a lens system so as to impinge on an optical fiber 202 for light source. The light emitted from the light source is modulated in intensity with a desired frequency of about 100 Hz to 10 MHz by means of an oscillator 223 in order to remove noises due to external disturbance. Since the light source optical fiber 202 is connected to an optical fiber 204 for light irradiation through an optical fiber coupler 203 a, the light from the light source is transmitted to the light irradiation optical fiber 204 and is irradiated on a subject 206 by way of a light irradiation position 205. The wavelength of the light used depends on spectroscopic characteristics of an in vivo substance of interest but when the oxygen saturation amount and the blood amount are measured from concentration values of Hb and HbO2, a single or a plurality of wavelengths can be selected, for use, from light having the wavelength range of from 600 nm to 1400 nm. A semiconductor laser, a titanium/sapphire laser or a light emitting diode can be used as the light source.
Four light detection optical fibers 207 a, 207 b, 207 c and 207 d for detecting light transmitting through the subject 206 and going out of it are disposed at four different sites on the subject 206. In the present embodiment, the two light detection optical fibers 207 b and 207 c are disposed at two sites which are point symmetrical to a symmetry center of the light irradiation position 205, the light detection optical fiber 207 a is disposed such that the centroid point of the light detection optical fiber 207 a is on a half-line having its origin at the centroid point of the light irradiation position and passing through the centroid point of the light detection optical fiber 207 b, and the light detection optical fiber 207 d is disposed such that the centroid point of the light detection optical fiber 207 d is on a half-line having its origin at the centroid point of the light irradiation position and passing through the centroid point of the light detection optical fiber 207 c. The light detection optical fibers 207 a and 207 d can be disposed anywhere so long as their centroid points are on the half-lines but in the present embodiment, they are disposed point-symmetrically to the symmetry center of the light irradiation position 205 and outside the light detection optical fibers 207 b and 207 c. Here, the light irradiation optical fiber 204 and the light detection optical fibers 207 a, 207 b, 207 c and 207 d are held in place by means of an optical fiber fixing member 208 made of metal and having its surface painted in black. Since the light detection optical fibers 207 a, 207 b, 207 c and 207 d are connected to optical fibers 209 a, 209 b, 209 c and 209 d for photodetectors through optical fiber couplers 203 b, 203 c, 203 d and 203 e, transmitting light rays detected by the light detection optical fibers 207 a, 207 b, 207 c and 207 d are transmitted to photodetectors 210 a, 210 b, 210 c and 210 d and subjected to photoelectric conversion by the photodetectors 210, so that transmitting light intensity levels subject to the photoelectric conversion are delivered in the form of electric signal intensity levels. Used as the photodetectors 210 are photoelectric conversion elements such as for example photodiodes or photomultiplier tubes.
Of electric signals indicative of transmitting light intensity levels delivered out of the photodetectors 210 a and 210 b, only frequency components for intensity modulation of the light source are extracted by lock-in amplifiers 224 a and 224 b, respectively. While an output from the lock-in amplifier 224 a is subjected to logarithmic conversion by a logarithmic amplifier 225 a and then inputted to the negative pole of a differential amplifier 211 a, an output from the lock-in amplifier 224 b is subjected to logarithmic conversion by a logarithmic amplifier 225 b and subsequently inputted to the positive pole of the differential amplifier 211 a. Of electric signals indicative of transmitting light intensity levels delivered out of the photodetectors 210 c and 210 d, only frequency components for intensity modulation of the light source are extracted by lock-in amplifiers 224 c and 224 d, respectively. While an output from the lock-in amplifier 224 d is subjected to logarithmic conversion by a logarithmic amplifier 225 d and then inputted to the negative pole of a differential amplifier 211 b, an output from the lock-in amplifier 224 c is subjected to logarithmic conversion by a logarithmic amplifier 225 c and subsequently inputted to the positive pole of the differential amplifier 211 b. Further, an output from the differential amplifier 211 a is inputted to the negative pole of a differential amplifier 211 c and an output from the differential amplifier 211 b is inputted to the positive pole of the differential amplifier 211 c. As a result, a difference signal among transmitting light intensity levels at the four different sites is delivered out of the differential amplifier 211 c as an output signal. The output signal from the differential amplifier 211 c is sequentially converted into a digital signal by an A/D converter 212, fetched into a computer 213 and displayed graphically on a display unit 214 as time series data.
Here, when a region 215 where the hemodynamic movement changes locally is included in only a view field 216 b of the light detection optical fiber as shown in FIG. 20, the logarithmic differential signal of transmitting light intensity delivered out of the differential amplifier 211 c reflects only a change in local hemodynamic movement. On the presupposition that for near infrared rays, hemoglobin serving as a main constituent in hemodynamic dominantly acts on extinction, the meaning of the logarithmic difference signal delivered out of the differential amplifier 211 c will be described below.
Where measuring time is t, light source wavelength is λ, irradiation light intensity is I0(t), concentration values of hemoglobin oxide and reduced hemoglobin are Cox(t) and Cdeox(t), respectively, changes in concentration values of hemoglobin oxide and reduced hemoglobin which occur at the local region 215 are ΔCox(t) and ΔCdeox(t), respectively, extinction coefficients for light source wavelength λ of hemoglobin oxide and reduced hemoglobin are εox(λ) and εdeox(λ), respectively, attenuation contained in transmitting light intensity levels detected by the photodetectors 210 b and 210 c and due to scattering and absorption caused by other constituents than hemoglobin is Ds1, attenuation contained in transmitting light intensity levels detected by the photodetectors 210 a and 210 d and due to scattering and absorption caused by other constituents than hemoglobin is Ds2, weight coefficient contained in the transmitting light intensity levels detected by the photodetectors 210 b and 210 c and caused by scattering is d1, and weight coefficient contained in the transmitting light intensity levels detected by the photodetectors 210 a and 210 d and caused by scattering is d2, transmitting light intensity signal Id1(t) detected by the photodetector 210 c, transmitting light intensity signal Id2(t) detected by the photodetector 210 d, transmitting light intensity signal Id1′(t) detected by the photodetector 210 b and transmitting light intensity signal Id2′(t) detected by the photodetector 210 a are given by the following equations (13) to (16):
Next, equations (13) and (14) are expressed in terms of natural logarithm and then equation (14) is subtracted from equation (13) to obtain the following equation (17):
Equations (15) and (16) are expressed in terms of natural logarithm and then equation (16) is subtracted from equation (15) to obtain the following equation (18):
The left side of equation (17) represents the output of the differential amplifier 211 b and the left side of equation (18) represents the output of the differential amplifier 211 a. Here, by subtracting equation (18) from equation (17), the following equation (19) is obtained:
ln[(Id1(t)/Id2(t))(Id2′(t)/Id1′(t)]=−[εox(λ)ΔCox(t)+εdeox(λ)ΔCdeox(t)](d1−d2) (19)
The left side of equation (19) represents the output of the differential amplifier 211 c, that is, the measured logarithmic difference signal.
Here, when 805 nm±10 nm is particularly used as the light source wavelength for measurement, the aforementioned relation of equation (9) stands and by using constant K, equation (19) can be reduced to the following equation (20):
Accordingly, the logarithmic difference signal measured using the light source wavelength 805 nm±10 nm represents a value corresponding to a relative hemodynamic change amount [ΔCox(t)+ΔCdeox(t)].
Also, when the number of wavelengths used for the light source is two (λ1,λ2), different intensity modulation frequencies (f1,f2) are applied to the respective wavelengths and frequency separation is effected by means of the lock-in amplifiers, transmitting light intensity signals of the individual wavelengths can be measured. Accordingly, equation (19) holds for the respective wavelengths and a simultaneous equation consisting of the following equations (21) and (22) can be introduced:
Since the extinction coefficients εox(λ1), εox(λ2), εdeox(λ1) and εdeox(λ2) are known, value ΔCox(t)(d1−d2) corresponding to a change amount of hemoglobin oxide and value ΔCdeox(t)(d1−d2) corresponding to a change amount of reduced hemoglobin can be determined by solving equations (21) and (22) with the computer 213 and time series data representative of a determined relative change amount can be displayed graphically on the display unit 214. For expansion of the above, the number of wavelengths can be increased, (d1−d2) can be erased or a relative change amount of concentration of a light absorbing substance, other than hemoglobin, which exists in a small amount can be determined.
Alternatively, as shown in FIG. 21, the lock-in amplifiers, logarithmic amplifiers and differential amplifiers may not be used, detection signals from the Photodetectors 210 a, 210 b, 210 c and 210 d may be converted into digital signals by the A/D converters 212, respectively, the digital signals may then be FFT processed with the computer 213 to extract only a signal corresponding to the intensity modulation frequency of the light source, a logarithmic difference among transmitting light intensity levels at four different detection positions may be calculated through a similar procedure to the above calculation process, and then the determined relative change amount can be displayed graphically as time series data on the display unit 214.
The schematic construction of embodiment 5 of the living body optical measurement system according to the present invention is shown in FIG. 22.
Light rays emitted from light sources 201 a and 201 b are collected using lens systems so as to impinge on an optical fiber 202 a for light source and an optical fiber 202 b for light source, respectively. The light rays emitted from the respective light sources are modulated in intensity with desired different frequencies f of about 100 Hz to 10 MHZ by means of oscillators 223 a and 223 b in order to remove noises due to external disturbance. Here, the intensity modulation frequency for the light source 201 a is set to f1 and the intensity modulation frequency for the light source 201 b is set to f2. Since the light source optical fiber 202 a is connected to an optical fiber 204 a for light irradiation through an optical fiber coupler 203 a and the light source optical fiber 202 b is connected to an optical fiber 204 b for light irradiation through an optical fiber coupler 203 c, the light rays from the respective light sources are transmitted to the light irradiation optical fibers 204 a and 204 b and irradiated on a subject 206 by way of light irradiation positions 205 a and 205 b. In order to obtain reference light rays, the light is split at a halfway point of each of the light irradiation optical fibers 204 a and 204 b by means of a splitter 226 a or 226 b and the intensity of each light source is converted into an electric signal by means of a photodetector 210 a or 210 c. A reference light intensity signal for the light source 201 a, delivered out of the photodetector 210 a, is inputted to a lock-in amplifier 224 a and separated on the basis of a reference frequency from the oscillator 223 a. An output of the lock-in amplifier 224 a is inputted to a logarithmic amplifier 225 a so as to undergo logarithmic conversion and then inputted to the negative pole of a differential amplifier 211 a. A reference light intensity signal for the light source 201 b, delivered out of the photodetector 210 c, is inputted to a lock-in amplifier 224 d and separated on the basis of a reference frequency from the oscillator 223 b. An output of the lock-in amplifier 224 d is inputted to a logarithmic amplifier 225 d so as to undergo logarithmic conversion and then inputted to the negative pole of a differential amplifier 211 b. The wavelength of the light used depends on spectroscopic characteristics of an in vivo substance of interest but when the oxygen saturation amount and the hemodynamic amount are measured from concentration values of Hb and HbO2, a single or a plurality of wavelengths can be selected, for use, from light having the wavelength range of from 600 nm to 1400 nm. A semiconductor laser, a titanium/sapphire laser or a light emitting diode can be used as the light source.
For detection of light transmitting through a subject 206 and going out of it, one optical fiber 207 for light detection is disposed at a position on the subject 206 which is equidistant from light irradiation positions 205 a and 205 b. Here, the light irradiation optical fibers 204 a and 204 b and the light detection optical fiber 207 are held in place by means of an optical fiber fixing member 208 having its surface painted in black. Since the light detection optical fiber 207 is connected to an optical fiber 209 for light detection through an optical fiber coupler 203 b, transmitting light detected by the light detection optical fiber 207 is transmitted to a photodetector 210 b and subjected to photoelectric conversion by the photodetector 210 b, so that the transmitting light intensity is delivered in the form of electrical signal intensity. Used as the photodetector 210 b is a photoelectric conversion element such as for example a photodiode or a photomultiplier tube.
Since the electric signal representative of the transmitting light intensity level delivered out of the photodetector 210 b contains the transmitting light intensity signal for the light source 201 a and the transmitting light intensity signal for the light source 201 b, only an intensity modulation frequency component for the light source 201 a is extracted by a lock-in amplifier 224 b and only an intensity modulation frequency component signal for the light source 201 b is extracted by a lock-in amplifier 224 c. An output from the lock-in amplifier 224 b is subjected to logarithmic conversion by a logarithmic amplifier 225 b and then inputted to the positive pole of the differential amplifier 211 a. An output from the lock-in amplifier 224 c is subjected to logarithmic conversion by a logarithmic amplifier 225 c and subsequently inputted to the positive pole of the differential amplifier 211 b. As a result, a logarithmic difference signal between the intensity of the light source 201 a and the transmitting light intensity for the light source 201 a is delivered out of the differential amplifier 211 a as an output signal, and a logarithmic difference signal between the intensity of the light source 201 b and the transmitting light intensity for the light source 201 b is delivered out of the differential amplifier 211 b as an output signal. Further, an output from the differential amplifier 211 a is inputted to the negative pole of a differential amplifier 211 c and an output from the differential amplifier 211 b is inputted to the positive pole of the differential amplifier 211 c, so that a logarithmic differential signal between transmitting light intensity levels which is removed of fluctuation in the light source intensity can be delivered out of the differential amplifier 211 c. The output signal from the differential amplifier 211 c is sequentially converted into a digital signal by an A/D converter 212, fetched into a computer 213 and displayed on a display unit 214 as time series data.
Here, when a region 215 where the hemodynamic movement changes locally is included in only a view field 216 b of the light detection optical fiber as shown in FIG. 22, the measured logarithmic differential signal reflects only a change in local hemodynamic movement. On the presupposition that for near infrared rays, hemoglobin serving as a main constituent in hemodynamic dominantly acts on extinction, the meaning of the measured logarithmic difference signal will be described below.
Where measuring time is t, light source wavelength is λ, irradiation light intensity from the irradiation position 205 b is I0(t), irradiation light intensity from the irradiation position 205 a is I0′(t), reference light intensity from the splitter 226 b is Ir(t), reference light intensity from the splitter 226 b is Ir′(t), ratio of splitting to reference light of the splitter is α indicating that
I0(t):Ir(t)=I0′(t):Ir′(t)=1:α,
concentration values of hemoglobin oxide and reduced hemoglobin are Cox(t) and Cdeox(t), respectively, changes in concentration values of hemoglobin oxide and reduced hemoglobin which occur at the local region 215 are ΔCox(t) and ΔCdeox, respectively, extinction coefficients for light source wavelength λ of hemoglobin oxide and reduced hemoglobin are εox(λ) and εdeox(λ), respectively, attenuation due to scattering and absorption caused by other constituents than hemoglobin is Ds, and weight coefficient caused by scattering is d, transmitting light intensity signal Id(t) for the light source 201 b detected by the photodetector 210 b, that is, the output from the lock-in amplifier 224 c is given by the following equation (23) and transmitting light intensity signal Id′(t) for the light source 201 a, that is, the output from the lock-in amplifier 224 b is given by the following equation (24):
Id′(t)=Ds.exp[−[εox(λ)Cox(t)+εdeox(λ) Cdeox(t)]d]I0′(t) (24)
Next, equations (23) and (24) are expressed in terms of natural logarithm and then equation (23) is reduced to the following equation (25) and equation (24) is reduced to the following equation (26):
Further, equation (26) is subtracted from equation (25) to obtain the following equation (27):
Here,
stand and therefore, the output from the differential amplifier 211 a is
ln[Id′(t)/αI0′(t)]
and the output from the differential amplifier 211 c is
Since equation (30) equals the left side of equation (27), the logarithmic difference signal delivered out of the differential amplifier 211 c is equivalent to equation (27).
Here, when 805 nm±10 nm is particularly used as the light source wavelength for measurement, the aforementioned relation of equation (9) stands and by using constant K, equation (27) can be reduced to the following equation (31):
Accordingly, the logarithmic difference signal measured using the light source wavelength 805 nm±10 nm represents a value corresponding to a relative hemodynamic change amount [ΔCox(t)+ΔCdeox(t)]−K. Also, when the number of wavelengths used for the light source is two (λ1,λ2), intensity modulation frequencies (f1, f2, f3, f4) which differ with the respective wavelengths and the respective irradiation positions are applied and frequency separation is effected by means of the lock-in amplifiers, transmitting light intensity signals for the individual wavelengths and the respective irradiation positions can be measured. Accordingly, equation (27) holds for the respective wavelengths and a simultaneous equation consisting of the following equations (32) and (33) can be introduced:
Since the extinction coefficients εox(λ1), εox(λ2), εdeox(λ1) and εdeox(λ2) are known, value ΔCox(t)d corresponding to a change amount of hemoglobin oxide and ΔCdeox(t) corresponding to a change amount of reduced hemoglobin can be determined by solving equations (32) and (33) with the computer 213 and time series data representative of a determined relative change amount can be displayed graphically on the display unit 214. For expansion of the above, the number of wavelengths can be increased, d can be erased or a relative change amount of concentration of a light absorbing substance, other than hemoglobin, which exists in a small amount can be determined.
Alternatively, as shown in FIG. 23, the lock-in amplifiers, logarithmic amplifiers and differential amplifiers may not be used, detection signals from the photodetectors 210 a, 210 b and 210 c may be converted into digital signals by the A/D converters 212, respectively, the digital signals may then be FFT processed with the computer 213 to extract only signals corresponding to intensity modulation frequencies of the respective light sources, a relative change amount calculated and determined through a similar procedure to the above calculation process can be displayed graphically as time series data on the display unit 214.
In the present invention, since the low cost light irradiation means and photodetectors are used to realize the simplified arithmetic processing, the high-speed processing can be ensured with an economical system and the living body function in correspondence to a plane image illustrative of the shape of an object to be measured can be imaged, thus ensuring that means effective especially for measurement of the local function of living body can be provided.
According to the prior arts, when the hemodynamic movement of a subject is measured by alternately repeating unloading and loading, the reference value varies and correct measurement cannot be carried out unless the measurement is delayed until signals to be measured are stabilized by keeping the subject quiet. According to the measuring method of the present invention, measurement can be conducted without waiting for the stabilization of signals. Further, measured signals can be removed of fluctuation to promote accuracy of signals.
When the first and second detection positions are set at locations which are substantially equidistant from the light irradiation position, transmitting light intensity signals at the respective detection positions equally change with an overall change in hemodynamic movement in a living body. Accordingly, by taking a logarithmic difference between a transmitting light intensity signal at the first detection position and a transmitting light intensity signal at the second detection position, a signal change attributable to the overall hemodynamic movement change can be removed. Further, when a change attributable to local hemodynamic movement is included in only one of transmitting light intensity signals at the first and second detection positions, the transmitting light intensity logarithmic difference signal reflects only the local change in hemodynamic movement.
The light ray comes into the living body through the light irradiation position and passes through complicated paths while interacting with various tissues of the living body and undergoing scattering and attenuation before it goes out of the living body through the light detection position. In the present invention, since the logarithmic difference between light intensity levels going out of the living body through positions which are substantially equidistant from the light irradiation position, the influence of scattering and attenuation caused by the tissues of the living body can be cancelled out and a slight signal reflecting the local change in hemodynamic movement can be detected with high accuracy.
Concretely, when an operation for cutting off a portion of the cerebrum is conducted in determination of the focus of epilepsy and therapy of serious epilepsy, an image of the portion to be cut off can be used to confirm that the cutting-off portion is a portion which does not impair the important in vivo function of the subject.
Claims (13)
1. An optical measurement system comprising:
a plurality of light irradiators for irradiating light rays on a subject;
a plurality of light receivers for receiving light rays passing through said subject;
wherein said plurality of light irradiators and said plurality of light receivers are disposed in lattice form alternatively; and
a display control unit for displaying a predetermined area on a display screen corresponding to presumptive measuring points on or in said subject, each presumptive measuring point being determined on a basis of a set of one of said light irradiators and one of said light receivers adjacent to each other, by a color or brightness corresponding to a data value detected by said one of the light receivers.
2. An optical measurement system according to claim 1, wherein a value at a position between said presumptive measuring points is determined through interpolation on a basis of data values detected by said light receivers corresponding to said presumptive measuring points, and wherein said display control unit displays said predetermined area by color or brightness corresponding to said value determined through the interpolation.
3. An optical measurement system according to claim 1, wherein a light propagation characteristic in said subject as determined by said set of said one of the light irradiators and said one of the light receivers adjacent to each other is calculated by numerical calculation, and wherein said display control unit displays an image on a basis of a calculated result.
4. An optical measurement system according to claim 1, wherein said each presumptive measuring point is an intermediate point between said one of the light irradiators and said one of the light receivers.
5. An optical measurement system according to claim 1, wherein said predetermined area is a square pixel having a center of gravity at said each presumptive measuring point.
6. An optical measurement system comprising:
a plurality of light irradiators for irradiating light rays on a subject;
a plurality of light receivers for receiving light rays passing through said subject;
wherein said plurality of light irradiators and said plurality of light receivers are disposed in lattice form alternatively; and
a display control unit for displaying as an image predetermined areas on a display screen corresponding to presumptive measuring points on or in said subject as determined on a basis of sets of ones of said light irradiators and ones of said light receivers adjacent to each other, by color or brightness corresponding to data values detected by said light receivers, wherein said display control unit displays said image in an order of measuring time points.
7. An optical measurement system according to claim 6, wherein each of said presumptive measuring points is an intermediate point between one of the light irradiators and one of the light receivers adjacent to each other.
8. An optical measurement system according to claim 6, wherein each area of said predetermined areas is a square pixel having a center of gravity at a corresponding one of said presumptive measuring points.
9. An optical measurement system comprising:
a plurality of light irradiators for irradiating light ray on a subject;
a plurality of light receivers for receiving light rays passing through said subject;
a plurality of signal separators for separating detected signals by said receivers into each signal coming from said each irradiator;
a display controller for providing pixels on the basis of the separated signals by said signal separators; and
a display unit for displaying an image on the basis of pixels.
10. An optical measurement system comprising:
a plurality of light irradiators for irradiating light ray on a subject;
a plurality of light receivers for receiving light rays passing through said subject;
a plurality of signal separators for separating detected signals by said receivers into respective signals, each respective signal being resultant from a differing light-irradiator/light-receiver combination;
a display controller for providing pixels on the basis of the separated signals by said signal separators; and
a display unit for displaying an image on the basis of pixels.
11. An optical measurement system comprising:
a plurality of light radiators for irradiating light ray on human body;
a plurality of light detectors for detecting light rays from the human body to generate electric signals;
a separator for separating a specific electric signals from said electric signals, said specific electric signal corresponding to one of said electric signals resulting from a specific one of said plurality of light irradiators; and
a display unit for displaying an image picture formed on the basis of the separated specific electric signal.
12. An optical measurement system comprising:
a plurality of light irradiators for irradiating light rays on human body, each of which has a specific wavelength;
a plurality of light detectors for detecting the light ray scattered by said human body, said detectors being disposed at a plurality of positions on said human body, and
a display controller for displaying the images on the basis of the signals detected in accordance with said plurality of positions.
13. An optical measurement method comprising steps of:
irradiating light ray on a plurality of portions of human body;
detecting light rays passed through the human body at a plurality of portions; and
displaying a moving picture relating to a state of blood of said human body on the basis of the detected light rays and the portions of the human body through which the detected light rays passed.
Priority Applications (5)
| Application Number | Priority Date | Filing Date | Title |
|---|---|---|---|
| US09/203,610 US6282438B1 (en) | 1994-10-06 | 1998-12-02 | Optical system for measuring metabolism in a body and imaging method |
| US09/900,144 US7286870B2 (en) | 1994-10-06 | 2001-07-09 | Optical system for measuring metabolism in a body and imaging method |
| US11/037,282 US7440794B2 (en) | 1994-10-06 | 2005-01-19 | Optical system for measuring metabolism in a body and imaging method |
| US11/037,339 US7715904B2 (en) | 1994-10-06 | 2005-01-19 | Optical system for measuring metabolism in a body and imaging method |
| US11/037,338 US8050744B2 (en) | 1994-10-06 | 2005-01-19 | Optical system for measuring metabolism in a body and imaging method |
Applications Claiming Priority (9)
| Application Number | Priority Date | Filing Date | Title |
|---|---|---|---|
| JP6-242592 | 1994-10-06 | ||
| JP24259294A JP3359756B2 (en) | 1994-10-06 | 1994-10-06 | Biological light measurement device |
| JP03097295A JP3325145B2 (en) | 1995-02-20 | 1995-02-20 | Biological light measurement device |
| JP7-030972 | 1995-02-20 | ||
| JP16982095A JP3599426B2 (en) | 1995-07-05 | 1995-07-05 | Biological light measurement device |
| JP7-169820 | 1995-07-05 | ||
| US08/539,871 US5803909A (en) | 1994-10-06 | 1995-10-06 | Optical system for measuring metabolism in a body and imaging method |
| US09/149,155 US6128517A (en) | 1994-10-06 | 1998-09-08 | Optical system for measuring metabolism in a body and imaging method |
| US09/203,610 US6282438B1 (en) | 1994-10-06 | 1998-12-02 | Optical system for measuring metabolism in a body and imaging method |
Related Parent Applications (1)
| Application Number | Title | Priority Date | Filing Date |
|---|---|---|---|
| US09/149,155 Continuation US6128517A (en) | 1994-10-06 | 1998-09-08 | Optical system for measuring metabolism in a body and imaging method |
Related Child Applications (1)
| Application Number | Title | Priority Date | Filing Date |
|---|---|---|---|
| US09/900,144 Continuation US7286870B2 (en) | 1994-10-06 | 2001-07-09 | Optical system for measuring metabolism in a body and imaging method |
Publications (1)
| Publication Number | Publication Date |
|---|---|
| US6282438B1 true US6282438B1 (en) | 2001-08-28 |
Family
ID=27287158
Family Applications (7)
| Application Number | Title | Priority Date | Filing Date |
|---|---|---|---|
| US08/539,871 Expired - Lifetime US5803909A (en) | 1994-10-06 | 1995-10-06 | Optical system for measuring metabolism in a body and imaging method |
| US09/149,155 Expired - Lifetime US6128517A (en) | 1994-10-06 | 1998-09-08 | Optical system for measuring metabolism in a body and imaging method |
| US09/203,610 Expired - Fee Related US6282438B1 (en) | 1994-10-06 | 1998-12-02 | Optical system for measuring metabolism in a body and imaging method |
| US09/900,144 Expired - Fee Related US7286870B2 (en) | 1994-10-06 | 2001-07-09 | Optical system for measuring metabolism in a body and imaging method |
| US11/037,338 Expired - Fee Related US8050744B2 (en) | 1994-10-06 | 2005-01-19 | Optical system for measuring metabolism in a body and imaging method |
| US11/037,282 Expired - Fee Related US7440794B2 (en) | 1994-10-06 | 2005-01-19 | Optical system for measuring metabolism in a body and imaging method |
| US11/037,339 Expired - Fee Related US7715904B2 (en) | 1994-10-06 | 2005-01-19 | Optical system for measuring metabolism in a body and imaging method |
Family Applications Before (2)
| Application Number | Title | Priority Date | Filing Date |
|---|---|---|---|
| US08/539,871 Expired - Lifetime US5803909A (en) | 1994-10-06 | 1995-10-06 | Optical system for measuring metabolism in a body and imaging method |
| US09/149,155 Expired - Lifetime US6128517A (en) | 1994-10-06 | 1998-09-08 | Optical system for measuring metabolism in a body and imaging method |
Family Applications After (4)
| Application Number | Title | Priority Date | Filing Date |
|---|---|---|---|
| US09/900,144 Expired - Fee Related US7286870B2 (en) | 1994-10-06 | 2001-07-09 | Optical system for measuring metabolism in a body and imaging method |
| US11/037,338 Expired - Fee Related US8050744B2 (en) | 1994-10-06 | 2005-01-19 | Optical system for measuring metabolism in a body and imaging method |
| US11/037,282 Expired - Fee Related US7440794B2 (en) | 1994-10-06 | 2005-01-19 | Optical system for measuring metabolism in a body and imaging method |
| US11/037,339 Expired - Fee Related US7715904B2 (en) | 1994-10-06 | 2005-01-19 | Optical system for measuring metabolism in a body and imaging method |
Country Status (1)
| Country | Link |
|---|---|
| US (7) | US5803909A (en) |
Cited By (16)
| Publication number | Priority date | Publication date | Assignee | Title |
|---|---|---|---|---|
| US20010047131A1 (en) * | 1994-10-06 | 2001-11-29 | Atsushi Maki | Optical system for measuring metabolism in a body and imaging method |
| US6522911B1 (en) * | 1998-11-20 | 2003-02-18 | Fuji Photo Film Co., Ltd. | Apparatus for imaging a blood vessel |
| US20040077960A1 (en) * | 2002-10-22 | 2004-04-22 | Hitachi, Ltd. | Measurement system for living bodies |
| US20040254475A1 (en) * | 1999-02-19 | 2004-12-16 | Atsushi Maki | Optical measuring instrument |
| US20050261578A1 (en) * | 2004-05-18 | 2005-11-24 | Tsuyoshi Yamamoto | Living body measurement system by light, image display methodology and program |
| US20060100526A1 (en) * | 2004-10-26 | 2006-05-11 | Yukari Yamamoto | Optical bioinstrumentation for living body |
| USRE41949E1 (en) * | 1999-09-14 | 2010-11-23 | The United States Of America As Represented By The Department Of Health And Human Services | System and method for tomographic imaging of dynamic properties of a scattering medium |
| US20100298675A1 (en) * | 2009-05-20 | 2010-11-25 | Ammar Al-Ali | Hemoglobin Display and Patient Treatment |
| US20110176713A1 (en) * | 2008-10-01 | 2011-07-21 | Hirokazu Asaka | Biological light measurement device and position display method of light irradiation position and light detection position or measurement channel |
| US8235894B2 (en) | 2004-09-02 | 2012-08-07 | Nagaoka University Of Technology | Emotional state determination method |
| USRE45607E1 (en) * | 1998-10-13 | 2015-07-14 | Covidien Lp | Multi-channel non-invasive tissue oximeter |
| USD763939S1 (en) | 2014-04-02 | 2016-08-16 | Cephalogics, LLC | Optical sensor array liner with optical sensor array pad |
| USD763938S1 (en) | 2014-04-02 | 2016-08-16 | Cephalogics, LLC | Optical sensor array |
| US9579039B2 (en) | 2011-01-10 | 2017-02-28 | Masimo Corporation | Non-invasive intravascular volume index monitor |
| US11191485B2 (en) | 2006-06-05 | 2021-12-07 | Masimo Corporation | Parameter upgrade system |
| US11317837B2 (en) | 2006-10-12 | 2022-05-03 | Masimo Corporation | System and method for monitoring the life of a physiological sensor |
Families Citing this family (80)
| Publication number | Priority date | Publication date | Assignee | Title |
|---|---|---|---|---|
| US6671540B1 (en) | 1990-08-10 | 2003-12-30 | Daryl W. Hochman | Methods and systems for detecting abnormal tissue using spectroscopic techniques |
| US6725072B2 (en) * | 1990-10-06 | 2004-04-20 | Hema Metrics, Inc. | Sensor for transcutaneous measurement of vascular access blood flow |
| US6240309B1 (en) * | 1995-10-06 | 2001-05-29 | Hitachi, Ltd. | Optical measurement instrument for living body |
| US20060184047A1 (en) * | 1995-11-17 | 2006-08-17 | Yuichi Yamashita | Optical measurement instrument for living body |
| ATE209017T1 (en) * | 1996-02-05 | 2001-12-15 | Diasense Inc | DEVICE FOR THE NON-INVASIVE DETERMINATION OF GLUCOSE |
| GB9823452D0 (en) * | 1998-10-28 | 1998-12-23 | Rolfe Peter | Improvements to optical monitoring |
| DE69929380T2 (en) | 1998-12-07 | 2006-08-31 | Hitachi, Ltd. | Device for controlling plants by means of body signals |
| JP3977947B2 (en) * | 1998-12-07 | 2007-09-19 | 株式会社日立製作所 | Optical measurement method and apparatus |
| US7047054B2 (en) * | 1999-03-12 | 2006-05-16 | Cas Medical Systems, Inc. | Laser diode optical transducer assembly for non-invasive spectrophotometric blood oxygenation monitoring |
| US7039454B1 (en) * | 1999-03-29 | 2006-05-02 | Hitachi Medical Corporation | Biological optical measuring instrument |
| WO2001019252A1 (en) * | 1999-09-14 | 2001-03-22 | Hitachi Medical Corporation | Biological light measuring instrument |
| JP3532800B2 (en) * | 1999-09-30 | 2004-05-31 | 独立行政法人 科学技術振興機構 | Stethoscope |
| JP3839202B2 (en) * | 1999-10-28 | 2006-11-01 | 株式会社日立製作所 | Biological light measuring device and program for causing this device to function |
| AU2001237963A1 (en) * | 2000-01-24 | 2001-07-31 | The General Hospital Corporation | Detection of stroke events using diffuse optical tomography |
| US6577884B1 (en) | 2000-06-19 | 2003-06-10 | The General Hospital Corporation | Detection of stroke events using diffuse optical tomagraphy |
| US6516214B1 (en) | 2000-01-24 | 2003-02-04 | The General Hospital Corporation | Detection of stroke events using diffuse optical tomography |
| EP1307135A4 (en) * | 2000-08-04 | 2006-05-31 | Photonify Technologies Inc | Systems and methods for providing information concerning chromophores in physiological media |
| US6587703B2 (en) | 2000-09-18 | 2003-07-01 | Photonify Technologies, Inc. | System and method for measuring absolute oxygen saturation |
| US6597931B1 (en) | 2000-09-18 | 2003-07-22 | Photonify Technologies, Inc. | System and method for absolute oxygen saturation |
| US6516209B2 (en) | 2000-08-04 | 2003-02-04 | Photonify Technologies, Inc. | Self-calibrating optical imaging system |
| US7463916B2 (en) * | 2000-10-16 | 2008-12-09 | Hitachi Medical Corporation | Optical measurement apparatus for living body |
| JP4090699B2 (en) * | 2001-04-02 | 2008-05-28 | 株式会社日立製作所 | Biological light measurement device |
| DE10117751A1 (en) * | 2001-04-09 | 2002-11-21 | Siemens Ag | Medical object and organ modeling method prior to surgical operation uses image data obtained earlier so that the current object state can be viewed |
| JP4642279B2 (en) * | 2001-06-28 | 2011-03-02 | 株式会社日立メディコ | Biological light measurement device |
| EP1475037B1 (en) * | 2002-02-14 | 2012-09-12 | Toshinori Kato | Apparatus for evaluating biological function |
| JP3916985B2 (en) * | 2002-03-26 | 2007-05-23 | 株式会社日立メディコ | Biological light measurement device |
| US7173078B2 (en) * | 2002-04-12 | 2007-02-06 | Cabot Corporation | Process for preparing modified pigments |
| US7072701B2 (en) | 2002-07-26 | 2006-07-04 | Cas Medical Systems, Inc. | Method for spectrophotometric blood oxygenation monitoring |
| US7330745B2 (en) * | 2002-09-05 | 2008-02-12 | Hitachi Medical Corporation | Living body photometric device |
| JP2004121702A (en) * | 2002-10-07 | 2004-04-22 | Hitachi Ltd | Biological light measuring apparatus |
| JP4164386B2 (en) * | 2003-02-28 | 2008-10-15 | 株式会社日立製作所 | Biological light measurement device |
| US6943881B2 (en) * | 2003-06-04 | 2005-09-13 | Tomophase Corporation | Measurements of optical inhomogeneity and other properties in substances using propagation modes of light |
| WO2005034761A1 (en) * | 2003-09-19 | 2005-04-21 | Hitachi Medical Corporation | Organism information signal processing system comprising combination of organism light measuring device and brain wave measuring device, and probe used for same |
| JP2005198788A (en) | 2004-01-14 | 2005-07-28 | National Institute Of Information & Communication Technology | Biological activity measuring device |
| JP4379150B2 (en) * | 2004-02-26 | 2009-12-09 | 株式会社日立製作所 | Biological light measuring device and signal processing method |
| DE102004032094A1 (en) * | 2004-07-01 | 2006-01-26 | Micro-Epsilon Messtechnik Gmbh & Co Kg | Blood oxygen saturation measuring method for use in field of anesthesia, involves comparing measured values, which are recorded from body of patient, with reference value for determining deviation of measured values from reference value |
| WO2006009178A1 (en) * | 2004-07-20 | 2006-01-26 | Toshinori Kato | Biofunction diagnosis device, biofunction diagnosis method, bioprobe, bioprobe wearing tool, bioprobe support tool, and bioprobe wearing assisting tool |
| US8498681B2 (en) * | 2004-10-05 | 2013-07-30 | Tomophase Corporation | Cross-sectional mapping of spectral absorbance features |
| US7970458B2 (en) * | 2004-10-12 | 2011-06-28 | Tomophase Corporation | Integrated disease diagnosis and treatment system |
| JP4012900B2 (en) * | 2004-10-21 | 2007-11-21 | 株式会社日立製作所 | Biological light measurement device |
| JP4118871B2 (en) * | 2004-12-03 | 2008-07-16 | 株式会社日立製作所 | Bio-light measurement probe and bio-light measurement apparatus using the same |
| JP4663387B2 (en) * | 2005-04-22 | 2011-04-06 | 株式会社日立製作所 | Biological light measurement device |
| WO2006124455A1 (en) | 2005-05-12 | 2006-11-23 | Cas Medical Systems, Inc. | Improved method for spectrophotometric blood oxygenation monitoring |
| US7831298B1 (en) | 2005-10-04 | 2010-11-09 | Tomophase Corporation | Mapping physiological functions of tissues in lungs and other organs |
| US8821391B2 (en) * | 2009-03-06 | 2014-09-02 | Ethicon Endo-Surgery, Inc. | Methods and devices for providing access into a body cavity |
| JPWO2007135993A1 (en) * | 2006-05-23 | 2009-10-01 | 株式会社日立メディコ | Biological light measurement device |
| US8320519B2 (en) | 2006-06-22 | 2012-11-27 | Koninklijke Philips Electronics N.V. | Multi-source encoded x-ray imaging |
| US10010277B2 (en) * | 2006-06-22 | 2018-07-03 | The General Hospital Corporation | Cancer detection by optical measurement of compression-induced transients |
| US8498695B2 (en) | 2006-12-22 | 2013-07-30 | Novadaq Technologies Inc. | Imaging system with a single color image sensor for simultaneous fluorescence and color video endoscopy |
| US7706646B2 (en) * | 2007-04-24 | 2010-04-27 | Tomophase Corporation | Delivering light via optical waveguide and multi-view optical probe head |
| WO2009108950A2 (en) * | 2008-02-29 | 2009-09-03 | Tomophase Corporation | Temperature profile mapping and guided thermotherapy |
| EP2268194B1 (en) * | 2008-03-18 | 2016-08-31 | Novadaq Technologies Inc. | Imaging system for combined full-color reflectance and near-infrared imaging |
| US8391942B2 (en) * | 2008-10-06 | 2013-03-05 | Cas Medical Systems, Inc. | Method and apparatus for determining cerebral desaturation in patients undergoing deep hypothermic circulatory arrest |
| US20100105998A1 (en) * | 2008-10-28 | 2010-04-29 | Cas Medical Systems, Inc. | Method and apparatus for spectrophotometric based oximetry of spinal tissue |
| US8467858B2 (en) * | 2009-04-29 | 2013-06-18 | Tomophase Corporation | Image-guided thermotherapy based on selective tissue thermal treatment |
| WO2011028628A2 (en) | 2009-08-26 | 2011-03-10 | Tomophase Corporation | Optical tissue imaging based on optical frequency domain imaging |
| US20110237910A1 (en) * | 2010-03-23 | 2011-09-29 | Cas Medical Systems, Inc. | Stabilized multi-wavelength laser system for non-invasive spectrophotometric monitoring |
| US10259204B2 (en) | 2010-04-30 | 2019-04-16 | Columbia Insurance Company | Resilient flooring product and methods of making same |
| BE1020391A3 (en) | 2010-04-30 | 2013-09-03 | Shaw Ind Group Inc | VINYL FREE ELASTIC FLOORING PRODUCT AND METHOD FOR THE PRODUCTION THEREOF. |
| EP2591732B8 (en) | 2010-07-06 | 2016-12-21 | Hitachi, Ltd. | Biological photometric device and biological photometry method using same |
| US9063074B2 (en) * | 2010-12-30 | 2015-06-23 | Empire Technology Development Llc | Analyzing tissue morphology in three dimensions |
| US9545223B2 (en) * | 2011-03-02 | 2017-01-17 | Board Of Regents, The University Of Texas System | Functional near infrared spectroscopy imaging system and method |
| BR112013022997A2 (en) | 2011-03-08 | 2018-07-03 | Novadaq Technologies Inc. | full spectrum led illuminator. |
| JP5382666B2 (en) * | 2011-04-21 | 2014-01-08 | 学校法人 聖マリアンナ医科大学 | Concentration measuring device and concentration measuring method |
| JP2013122443A (en) * | 2011-11-11 | 2013-06-20 | Hideo Ando | Biological activity measuring method, biological activity measuring device, method for transfer of biological activity detection signal and method for provision of service using biological activity information |
| JP5901327B2 (en) * | 2012-02-09 | 2016-04-06 | キヤノン株式会社 | Developing device, process cartridge, and image forming apparatus |
| US9649055B2 (en) * | 2012-03-30 | 2017-05-16 | General Electric Company | System and methods for physiological monitoring |
| US9848808B2 (en) | 2013-07-18 | 2017-12-26 | Cas Medical Systems, Inc. | Method for spectrophotometric blood oxygenation monitoring |
| JP6220065B2 (en) | 2014-06-23 | 2017-10-25 | 株式会社日立製作所 | Biological light measurement device and method |
| JP2017023455A (en) * | 2015-07-23 | 2017-02-02 | 株式会社アドバンテスト | Near-infrared bioinstrumentation apparatus and probe thereof |
| CN108289723B (en) | 2015-11-13 | 2021-07-06 | 史赛克欧洲运营有限公司 | System and method for illumination and imaging of an object |
| EP3408654B1 (en) | 2016-01-26 | 2022-08-03 | Stryker European Operations Limited | Fluorescence imaging system and method for fluorescence imaging |
| USD916294S1 (en) | 2016-04-28 | 2021-04-13 | Stryker European Operations Limited | Illumination and imaging device |
| EP3469420A4 (en) | 2016-06-14 | 2020-02-12 | Novadaq Technologies ULC | Methods and systems for adaptive imaging for low light signal enhancement in medical visualization |
| WO2018145193A1 (en) | 2017-02-10 | 2018-08-16 | Novadaq Technologies ULC | Open-field handheld fluorescence imaging systems and methods |
| CN110520057B (en) * | 2017-04-14 | 2022-05-13 | 国立研究开发法人产业技术综合研究所 | Brain function measuring device and brain function measuring method |
| CN108926340B (en) * | 2017-05-23 | 2023-04-28 | 松下知识产权经营株式会社 | Measuring device |
| KR102005832B1 (en) * | 2018-02-21 | 2019-08-01 | 주식회사 올리브헬스케어 | Signal processing device for bio-signal analysing and bio-signal analysing apparatus using the same |
| CN112770668A (en) | 2018-07-16 | 2021-05-07 | 布鲁恩医疗创新有限责任公司 | Perfusion and oxygenation measurements |
| US11314329B1 (en) * | 2019-01-28 | 2022-04-26 | Meta Platforms, Inc. | Neural decoding with co-learning for brain computer interfaces |
Citations (17)
| Publication number | Priority date | Publication date | Assignee | Title |
|---|---|---|---|---|
| US4170987A (en) | 1977-11-28 | 1979-10-16 | California Institute Of Technology | Medical diagnosis system and method with multispectral imaging |
| JPS5524004A (en) | 1978-06-22 | 1980-02-20 | Minolta Camera Kk | Oxymeter |
| US4281645A (en) | 1977-06-28 | 1981-08-04 | Duke University, Inc. | Method and apparatus for monitoring metabolism in body organs |
| JPS6072542A (en) | 1983-09-28 | 1985-04-24 | 株式会社島津製作所 | Light ray ct apparatus |
| US4515165A (en) | 1980-02-04 | 1985-05-07 | Energy Conversion Devices, Inc. | Apparatus and method for detecting tumors |
| JPS62231625A (en) | 1986-03-31 | 1987-10-12 | 住友電気工業株式会社 | Optical ct scanner |
| JPS63277038A (en) | 1987-05-08 | 1988-11-15 | Hamamatsu Photonics Kk | Diagnostic apparatus |
| US5088493A (en) | 1984-08-07 | 1992-02-18 | Sclavo, S.P.A. | Multiple wavelength light photometer for non-invasive monitoring |
| US5090415A (en) | 1989-02-14 | 1992-02-25 | Hamamatsu Photonics Kabushiki Kaisha | Examination apparatus |
| US5122974A (en) | 1989-02-06 | 1992-06-16 | Nim, Inc. | Phase modulated spectrophotometry |
| US5198977A (en) | 1990-11-27 | 1993-03-30 | Jesse Salb | System and method for localization of functional activity in the human brain |
| JPH05300887A (en) | 1992-04-27 | 1993-11-16 | Shimadzu Corp | Apparatus for measuring amount of cerebral blood |
| US5419320A (en) | 1990-10-26 | 1995-05-30 | Hitachi, Ltd. | Method and apparatus for obtaining an image indicating metabolism in a body |
| US5551422A (en) | 1992-11-09 | 1996-09-03 | Boehringer Mannheim Gmbh | Method and apparatus for analytical determination of glucose in a biological matrix |
| US5566673A (en) | 1994-08-03 | 1996-10-22 | Mitsubishi Denki Kabushiki Kaisha | Apparatus for measuring brain activity |
| US5678556A (en) * | 1994-07-14 | 1997-10-21 | Hitachi, Ltd. | Imaging method for spatial distributions of absorber concentrations |
| US5772597A (en) * | 1992-09-14 | 1998-06-30 | Sextant Medical Corporation | Surgical tool end effector |
Family Cites Families (69)
| Publication number | Priority date | Publication date | Assignee | Title |
|---|---|---|---|---|
| US3638640A (en) * | 1967-11-01 | 1972-02-01 | Robert F Shaw | Oximeter and method for in vivo determination of oxygen saturation in blood using three or more different wavelengths |
| US4222389A (en) * | 1977-10-18 | 1980-09-16 | Institute Of Applied Biology Special Cancer Research Project | Objective determination of the rate of oxygen utilization in peripheral tissue |
| US4281845A (en) * | 1979-07-05 | 1981-08-04 | Brown Lawrence G | Drive system for bicycles and other apparatus |
| DE2934190A1 (en) * | 1979-08-23 | 1981-03-19 | Müller, Gerhard, Prof. Dr.-Ing., 7080 Aalen | METHOD AND DEVICE FOR MOLECULAR SPECTROSCOPY, ESPECIALLY FOR DETERMINING METABOLISM PRODUCTS |
| JPS57115232A (en) | 1980-07-09 | 1982-07-17 | Deyuuku Univ Inc | Apparatus for measuring metabolic action in internal organ |
| JPH0785135B2 (en) * | 1983-09-05 | 1995-09-13 | オリンパス光学工業株式会社 | Endoscope device |
| US4610258A (en) * | 1984-11-13 | 1986-09-09 | General Electric Company | Method for calculating blood flow using freely diffusible inert gases and CT |
| US4736751A (en) | 1986-12-16 | 1988-04-12 | Eeg Systems Laboratory | Brain wave source network location scanning method and system |
| JPS63261449A (en) * | 1987-04-20 | 1988-10-28 | Hitachi Ltd | Data processor |
| US5103829A (en) * | 1987-05-08 | 1992-04-14 | Hamamatsu Photonics Kabushiki Kaisha | Examination apparatus for measuring oxygenation in body organs |
| JPS6446439A (en) | 1987-08-17 | 1989-02-20 | Hamamatsu Photonics Kk | Diagnostic apparatus |
| JPH0612224Y2 (en) | 1987-09-17 | 1994-03-30 | 日産ディーゼル工業株式会社 | Accelerator lever control device |
| US5137355A (en) | 1988-06-08 | 1992-08-11 | The Research Foundation Of State University Of New York | Method of imaging a random medium |
| JP3154997B2 (en) | 1988-06-08 | 2001-04-09 | エル. バーバー,ランダル | System for imaging random media |
| JPH0658325B2 (en) | 1988-09-01 | 1994-08-03 | 浜松ホトニクス株式会社 | Lateral light transmission measuring instrument |
| US5873821A (en) * | 1992-05-18 | 1999-02-23 | Non-Invasive Technology, Inc. | Lateralization spectrophotometer |
| US5111821A (en) * | 1988-11-08 | 1992-05-12 | Health Research, Inc. | Fluorometric method for detecting abnormal tissue using dual long-wavelength excitation |
| US5353799A (en) * | 1991-01-22 | 1994-10-11 | Non Invasive Technology, Inc. | Examination of subjects using photon migration with high directionality techniques |
| JP2734595B2 (en) | 1989-01-31 | 1998-03-30 | 株式会社島津製作所 | Optical measurement device |
| US5902235A (en) * | 1989-03-29 | 1999-05-11 | Somanetics Corporation | Optical cerebral oximeter |
| JPH02303250A (en) | 1989-04-27 | 1990-12-17 | Nec Software Ltd | Character synchronizing reception system |
| DE69007465T2 (en) | 1989-10-11 | 1994-10-20 | Baxter Int | INTEGRATED INTRACRANIAL PRESSURE MONITOR AND DRAINAGE CATHETER. |
| JPH0367409A (en) | 1990-06-15 | 1991-03-22 | Seiko Epson Corp | Semiconductor device |
| US6196226B1 (en) | 1990-08-10 | 2001-03-06 | University Of Washington | Methods and apparatus for optically imaging neuronal tissue and activity |
| US5465718A (en) | 1990-08-10 | 1995-11-14 | Hochman; Daryl | Solid tumor, cortical function, and nerve tissue imaging methods and device |
| US5215095A (en) | 1990-08-10 | 1993-06-01 | University Technologies International | Optical imaging system for neurosurgery |
| US5438989A (en) | 1990-08-10 | 1995-08-08 | Hochman; Darryl | Solid tumor, cortical function, and nerve tissue imaging methods and device |
| ATE165852T1 (en) * | 1990-10-03 | 1998-05-15 | Commw Scient Ind Res Org | EPOXY RESINS BASED ON MACROCYCLIC COMPOUNDS |
| EP0497021A1 (en) | 1991-01-31 | 1992-08-05 | Hamamatsu Photonics K.K. | Oximeter with monitor |
| US5441053A (en) * | 1991-05-03 | 1995-08-15 | University Of Kentucky Research Foundation | Apparatus and method for multiple wavelength of tissue |
| US5291888A (en) | 1991-08-26 | 1994-03-08 | Electrical Geodesics, Inc. | Head sensor positioning network |
| JPH0742417B2 (en) | 1991-09-27 | 1995-05-10 | ルアン株式会社 | Dye composition, dyeing method, and dyed protein fiber |
| JP2694785B2 (en) | 1991-10-17 | 1997-12-24 | 日本電気株式会社 | Biological condition adjustment device |
| JPH05103774A (en) | 1991-10-18 | 1993-04-27 | Olympus Optical Co Ltd | Measuring device for metabolism information |
| JPH05103773A (en) | 1991-10-18 | 1993-04-27 | Olympus Optical Co Ltd | Measuring device for metabolism information |
| US5271401A (en) * | 1992-01-15 | 1993-12-21 | Praxair Technology, Inc. | Radiological imaging method |
| JP3142079B2 (en) * | 1992-03-19 | 2001-03-07 | 株式会社日立製作所 | Optical CT device |
| US6397099B1 (en) * | 1992-05-18 | 2002-05-28 | Non-Invasive Technology, Inc. | Non-invasive imaging of biological tissue |
| US5853370A (en) * | 1996-09-13 | 1998-12-29 | Non-Invasive Technology, Inc. | Optical system and method for non-invasive imaging of biological tissue |
| US5954053A (en) | 1995-06-06 | 1999-09-21 | Non-Invasive Technology, Inc. | Detection of brain hematoma |
| JP3142376B2 (en) | 1992-07-01 | 2001-03-07 | 浜松ホトニクス株式会社 | Mental state measuring device |
| US5321265A (en) | 1992-07-15 | 1994-06-14 | Block Myron J | Non-invasive testing |
| AT399647B (en) * | 1992-07-31 | 1995-06-26 | Truppe Michael | ARRANGEMENT FOR DISPLAYING THE INTERIOR OF BODIES |
| US5368030A (en) * | 1992-09-09 | 1994-11-29 | Izi Corporation | Non-invasive multi-modality radiographic surface markers |
| JP3325056B2 (en) | 1992-11-18 | 2002-09-17 | オリンパス光学工業株式会社 | Optical tomographic imaging system |
| JPH06245938A (en) | 1993-02-23 | 1994-09-06 | Hitachi Ltd | Optical measuring instrument |
| US5987346A (en) * | 1993-02-26 | 1999-11-16 | Benaron; David A. | Device and method for classification of tissue |
| US5396571A (en) | 1993-05-21 | 1995-03-07 | Trimedyne, Inc. | Coupling device and method for improved transfer efficiency of light energy from a laser source into optical fibers |
| JP3433498B2 (en) | 1993-06-02 | 2003-08-04 | 浜松ホトニクス株式会社 | Method and apparatus for measuring internal information of scattering medium |
| JP3577335B2 (en) | 1993-06-02 | 2004-10-13 | 浜松ホトニクス株式会社 | Scattering absorber measurement method and device |
| US5673701A (en) * | 1994-10-07 | 1997-10-07 | Non Invasive Technology, Inc. | Optical techniques for examination of biological tissue |
| US5820558A (en) * | 1994-12-02 | 1998-10-13 | Non-Invasive Technology, Inc. | Optical techniques for examination of biological tissue |
| US6058324A (en) * | 1993-06-17 | 2000-05-02 | Non-Invasive Technology, Inc. | Examination and imaging of biological tissue |
| US5435309A (en) * | 1993-08-10 | 1995-07-25 | Thomas; Edward V. | Systematic wavelength selection for improved multivariate spectral analysis |
| JP3239553B2 (en) | 1993-09-20 | 2001-12-17 | 株式会社島津製作所 | Brain function analyzer |
| JP3478346B2 (en) | 1993-10-14 | 2003-12-15 | 株式会社アドバンス | Biological signal processing device |
| JP3304559B2 (en) | 1993-10-25 | 2002-07-22 | 株式会社日立製作所 | Optical measurement method and device |
| JPH07128231A (en) | 1993-11-08 | 1995-05-19 | Matsushita Electric Ind Co Ltd | Infrared gas sensor |
| JPH07148169A (en) | 1993-11-30 | 1995-06-13 | Technol Res Assoc Of Medical & Welfare Apparatus | Optical scanner |
| US5755269A (en) * | 1993-12-09 | 1998-05-26 | Ciba Corning Diagnostics Corp. | Fluid delivery system |
| US5803909A (en) * | 1994-10-06 | 1998-09-08 | Hitachi, Ltd. | Optical system for measuring metabolism in a body and imaging method |
| US6542772B1 (en) * | 1994-12-02 | 2003-04-01 | Non-Invasive Technology, Inc. | Examination and imaging of biological tissue |
| EP0808124B1 (en) * | 1995-01-03 | 2003-04-16 | Non-Invasive Technology, Inc. | Optical coupler for in vivo examination of biological tissue |
| US6618614B1 (en) * | 1995-01-03 | 2003-09-09 | Non-Invasive Technology, Inc. | Optical examination device, system and method |
| JP3505922B2 (en) | 1996-03-29 | 2004-03-15 | ブリヂストンスポーツ株式会社 | Three piece solid golf ball |
| US6009340A (en) * | 1998-03-16 | 1999-12-28 | Northrop Grumman Corporation | Multimode, multispectral imaging system |
| JP4055266B2 (en) * | 1998-10-13 | 2008-03-05 | 株式会社日立製作所 | Optical measuring device |
| USRE45616E1 (en) * | 1998-10-13 | 2015-07-21 | Covidien Lp | Multi-channel non-invasive tissue oximeter |
| JP3839202B2 (en) * | 1999-10-28 | 2006-11-01 | 株式会社日立製作所 | Biological light measuring device and program for causing this device to function |
-
1995
- 1995-10-06 US US08/539,871 patent/US5803909A/en not_active Expired - Lifetime
-
1998
- 1998-09-08 US US09/149,155 patent/US6128517A/en not_active Expired - Lifetime
- 1998-12-02 US US09/203,610 patent/US6282438B1/en not_active Expired - Fee Related
-
2001
- 2001-07-09 US US09/900,144 patent/US7286870B2/en not_active Expired - Fee Related
-
2005
- 2005-01-19 US US11/037,338 patent/US8050744B2/en not_active Expired - Fee Related
- 2005-01-19 US US11/037,282 patent/US7440794B2/en not_active Expired - Fee Related
- 2005-01-19 US US11/037,339 patent/US7715904B2/en not_active Expired - Fee Related
Patent Citations (17)
| Publication number | Priority date | Publication date | Assignee | Title |
|---|---|---|---|---|
| US4281645A (en) | 1977-06-28 | 1981-08-04 | Duke University, Inc. | Method and apparatus for monitoring metabolism in body organs |
| US4170987A (en) | 1977-11-28 | 1979-10-16 | California Institute Of Technology | Medical diagnosis system and method with multispectral imaging |
| JPS5524004A (en) | 1978-06-22 | 1980-02-20 | Minolta Camera Kk | Oxymeter |
| US4515165A (en) | 1980-02-04 | 1985-05-07 | Energy Conversion Devices, Inc. | Apparatus and method for detecting tumors |
| JPS6072542A (en) | 1983-09-28 | 1985-04-24 | 株式会社島津製作所 | Light ray ct apparatus |
| US5088493A (en) | 1984-08-07 | 1992-02-18 | Sclavo, S.P.A. | Multiple wavelength light photometer for non-invasive monitoring |
| JPS62231625A (en) | 1986-03-31 | 1987-10-12 | 住友電気工業株式会社 | Optical ct scanner |
| JPS63277038A (en) | 1987-05-08 | 1988-11-15 | Hamamatsu Photonics Kk | Diagnostic apparatus |
| US5122974A (en) | 1989-02-06 | 1992-06-16 | Nim, Inc. | Phase modulated spectrophotometry |
| US5090415A (en) | 1989-02-14 | 1992-02-25 | Hamamatsu Photonics Kabushiki Kaisha | Examination apparatus |
| US5419320A (en) | 1990-10-26 | 1995-05-30 | Hitachi, Ltd. | Method and apparatus for obtaining an image indicating metabolism in a body |
| US5198977A (en) | 1990-11-27 | 1993-03-30 | Jesse Salb | System and method for localization of functional activity in the human brain |
| JPH05300887A (en) | 1992-04-27 | 1993-11-16 | Shimadzu Corp | Apparatus for measuring amount of cerebral blood |
| US5772597A (en) * | 1992-09-14 | 1998-06-30 | Sextant Medical Corporation | Surgical tool end effector |
| US5551422A (en) | 1992-11-09 | 1996-09-03 | Boehringer Mannheim Gmbh | Method and apparatus for analytical determination of glucose in a biological matrix |
| US5678556A (en) * | 1994-07-14 | 1997-10-21 | Hitachi, Ltd. | Imaging method for spatial distributions of absorber concentrations |
| US5566673A (en) | 1994-08-03 | 1996-10-22 | Mitsubishi Denki Kabushiki Kaisha | Apparatus for measuring brain activity |
Cited By (34)
| Publication number | Priority date | Publication date | Assignee | Title |
|---|---|---|---|---|
| US7440794B2 (en) | 1994-10-06 | 2008-10-21 | Hitachi, Ltd. | Optical system for measuring metabolism in a body and imaging method |
| US8050744B2 (en) | 1994-10-06 | 2011-11-01 | Hitachi, Ltd. | Optical system for measuring metabolism in a body and imaging method |
| US20010047131A1 (en) * | 1994-10-06 | 2001-11-29 | Atsushi Maki | Optical system for measuring metabolism in a body and imaging method |
| US20050131303A1 (en) * | 1994-10-06 | 2005-06-16 | Atsushi Maki | Optical system for measuring metabolism in a body and imaging method |
| US20050171440A1 (en) * | 1994-10-06 | 2005-08-04 | Atsushi Maki | Optical system for measuring metabolism in a body and imaging method |
| US7715904B2 (en) | 1994-10-06 | 2010-05-11 | Hitachi, Ltd. | Optical system for measuring metabolism in a body and imaging method |
| US7286870B2 (en) * | 1994-10-06 | 2007-10-23 | Hitachi, Ltd. | Optical system for measuring metabolism in a body and imaging method |
| USRE45616E1 (en) * | 1998-10-13 | 2015-07-21 | Covidien Lp | Multi-channel non-invasive tissue oximeter |
| USRE45608E1 (en) * | 1998-10-13 | 2015-07-14 | Covidien Lp | Multi-channel non-invasive tissue oximeter |
| USRE45607E1 (en) * | 1998-10-13 | 2015-07-14 | Covidien Lp | Multi-channel non-invasive tissue oximeter |
| USRE45609E1 (en) * | 1998-10-13 | 2015-07-14 | Covidien Lp | Multi-channel non-invasive tissue oximeter |
| US6522911B1 (en) * | 1998-11-20 | 2003-02-18 | Fuji Photo Film Co., Ltd. | Apparatus for imaging a blood vessel |
| US6901284B1 (en) * | 1999-02-19 | 2005-05-31 | Hitachi, Ltd. | Optical measuring instrument |
| US20040254475A1 (en) * | 1999-02-19 | 2004-12-16 | Atsushi Maki | Optical measuring instrument |
| USRE41949E1 (en) * | 1999-09-14 | 2010-11-23 | The United States Of America As Represented By The Department Of Health And Human Services | System and method for tomographic imaging of dynamic properties of a scattering medium |
| EP1413244A1 (en) * | 2002-10-22 | 2004-04-28 | Hitachi, Ltd. | Measuremant system for living bodies |
| US20040077960A1 (en) * | 2002-10-22 | 2004-04-22 | Hitachi, Ltd. | Measurement system for living bodies |
| US7022083B2 (en) | 2002-10-22 | 2006-04-04 | Hitachi, Ltd. | Measurement system for living bodies |
| US20050261578A1 (en) * | 2004-05-18 | 2005-11-24 | Tsuyoshi Yamamoto | Living body measurement system by light, image display methodology and program |
| US8235894B2 (en) | 2004-09-02 | 2012-08-07 | Nagaoka University Of Technology | Emotional state determination method |
| US20060100526A1 (en) * | 2004-10-26 | 2006-05-11 | Yukari Yamamoto | Optical bioinstrumentation for living body |
| US7613502B2 (en) * | 2004-10-26 | 2009-11-03 | Hitachi, Ltd. | Optical bioinstrumentation for living body |
| US11191485B2 (en) | 2006-06-05 | 2021-12-07 | Masimo Corporation | Parameter upgrade system |
| US11857319B2 (en) | 2006-10-12 | 2024-01-02 | Masimo Corporation | System and method for monitoring the life of a physiological sensor |
| US11317837B2 (en) | 2006-10-12 | 2022-05-03 | Masimo Corporation | System and method for monitoring the life of a physiological sensor |
| US20110176713A1 (en) * | 2008-10-01 | 2011-07-21 | Hirokazu Asaka | Biological light measurement device and position display method of light irradiation position and light detection position or measurement channel |
| US8565501B2 (en) * | 2008-10-01 | 2013-10-22 | Hitachi Medical Corporation | Biological light measurement device and position display method of light irradiation position and light detection position or measurement channel |
| US20100298675A1 (en) * | 2009-05-20 | 2010-11-25 | Ammar Al-Ali | Hemoglobin Display and Patient Treatment |
| US8571619B2 (en) * | 2009-05-20 | 2013-10-29 | Masimo Corporation | Hemoglobin display and patient treatment |
| US11752262B2 (en) | 2009-05-20 | 2023-09-12 | Masimo Corporation | Hemoglobin display and patient treatment |
| US10687715B2 (en) | 2009-09-15 | 2020-06-23 | Masimo Corporation | Non-invasive intravascular volume index monitor |
| US9579039B2 (en) | 2011-01-10 | 2017-02-28 | Masimo Corporation | Non-invasive intravascular volume index monitor |
| USD763939S1 (en) | 2014-04-02 | 2016-08-16 | Cephalogics, LLC | Optical sensor array liner with optical sensor array pad |
| USD763938S1 (en) | 2014-04-02 | 2016-08-16 | Cephalogics, LLC | Optical sensor array |
Also Published As
| Publication number | Publication date |
|---|---|
| US7440794B2 (en) | 2008-10-21 |
| US8050744B2 (en) | 2011-11-01 |
| US20050171440A1 (en) | 2005-08-04 |
| US20050131303A1 (en) | 2005-06-16 |
| US7286870B2 (en) | 2007-10-23 |
| US5803909A (en) | 1998-09-08 |
| US7715904B2 (en) | 2010-05-11 |
| US6128517A (en) | 2000-10-03 |
| US20010047131A1 (en) | 2001-11-29 |
| US20050148857A1 (en) | 2005-07-07 |
Similar Documents
| Publication | Publication Date | Title |
|---|---|---|
| US6282438B1 (en) | Optical system for measuring metabolism in a body and imaging method | |
| JP5895025B2 (en) | Biological light measurement device | |
| JP3599426B2 (en) | Biological light measurement device | |
| JPH0998972A (en) | Measurement equipment of light from living body and image generation method | |
| JP3433498B2 (en) | Method and apparatus for measuring internal information of scattering medium | |
| JP5324999B2 (en) | Biological light measurement device and biological light measurement method | |
| WO2001019241A1 (en) | Calibration methods and systems for diffuse optical tomography and spectroscopy | |
| US20070014464A1 (en) | Optical coherence tomograph | |
| JPH0749307A (en) | Method and apparatus for measuring scattering absorbent | |
| JP3471788B1 (en) | Oxygen saturation meter | |
| US20050277817A1 (en) | Noninvasive measurement system for monitoring activity condition of living body | |
| US8406840B2 (en) | Spatially resolved oxymetry | |
| JP3304559B2 (en) | Optical measurement method and device | |
| JP3325145B2 (en) | Biological light measurement device | |
| JP3648497B2 (en) | Biological light measurement device and image creation method in the device | |
| JP3952045B2 (en) | Biological light measurement device | |
| JP4272024B2 (en) | Optical biological measurement device | |
| Cysewska-Sobusiak | Examples of acquisition and application of biooptical signals | |
| JP3646729B2 (en) | Biological light measurement device | |
| JPH0454439A (en) | Method and instrument for measuring living body | |
| JPH06181930A (en) | Organismic light measuring device |
Legal Events
| Date | Code | Title | Description |
|---|---|---|---|
| FEPP | Fee payment procedure |
Free format text: PAYOR NUMBER ASSIGNED (ORIGINAL EVENT CODE: ASPN); ENTITY STATUS OF PATENT OWNER: LARGE ENTITY |
|
| FPAY | Fee payment |
Year of fee payment: 4 |
|
| REMI | Maintenance fee reminder mailed | ||
| LAPS | Lapse for failure to pay maintenance fees | ||
| STCH | Information on status: patent discontinuation |
Free format text: PATENT EXPIRED DUE TO NONPAYMENT OF MAINTENANCE FEES UNDER 37 CFR 1.362 |
|
| FP | Lapsed due to failure to pay maintenance fee |
Effective date: 20090828 |