US7272516B2 - Failure rate adjustment for electric power network reliability analysis - Google Patents
Failure rate adjustment for electric power network reliability analysis Download PDFInfo
- Publication number
- US7272516B2 US7272516B2 US10/745,122 US74512203A US7272516B2 US 7272516 B2 US7272516 B2 US 7272516B2 US 74512203 A US74512203 A US 74512203A US 7272516 B2 US7272516 B2 US 7272516B2
- Authority
- US
- United States
- Prior art keywords
- power network
- network component
- failure rate
- information representative
- subcomponent
- Prior art date
- Legal status (The legal status is an assumption and is not a legal conclusion. Google has not performed a legal analysis and makes no representation as to the accuracy of the status listed.)
- Expired - Lifetime, expires
Links
- 238000004458 analytical method Methods 0.000 title abstract description 17
- 238000012423 maintenance Methods 0.000 claims abstract description 63
- 238000000034 method Methods 0.000 claims abstract description 33
- 238000013507 mapping Methods 0.000 claims description 20
- 238000005315 distribution function Methods 0.000 claims description 16
- 238000012545 processing Methods 0.000 claims description 14
- 230000001186 cumulative effect Effects 0.000 claims description 12
- 230000001131 transforming effect Effects 0.000 claims description 6
- 238000012886 linear function Methods 0.000 claims 4
- 230000001419 dependent effect Effects 0.000 abstract 1
- 238000013486 operation strategy Methods 0.000 abstract 1
- 230000006870 function Effects 0.000 description 67
- 238000009826 distribution Methods 0.000 description 30
- 238000009413 insulation Methods 0.000 description 28
- 239000002131 composite material Substances 0.000 description 15
- 230000007246 mechanism Effects 0.000 description 12
- 238000003860 storage Methods 0.000 description 12
- 230000000694 effects Effects 0.000 description 11
- 238000009434 installation Methods 0.000 description 11
- 239000004020 conductor Substances 0.000 description 10
- 230000000875 corresponding effect Effects 0.000 description 10
- 238000010586 diagram Methods 0.000 description 9
- 239000012212 insulator Substances 0.000 description 9
- 241001465754 Metazoa Species 0.000 description 8
- 238000003915 air pollution Methods 0.000 description 8
- 230000005540 biological transmission Effects 0.000 description 8
- 239000003990 capacitor Substances 0.000 description 8
- 238000004364 calculation method Methods 0.000 description 6
- 238000005516 engineering process Methods 0.000 description 6
- 238000004088 simulation Methods 0.000 description 6
- 238000009966 trimming Methods 0.000 description 6
- 238000004891 communication Methods 0.000 description 5
- 229920003020 cross-linked polyethylene Polymers 0.000 description 5
- 239000004703 cross-linked polyethylene Substances 0.000 description 5
- 238000013461 design Methods 0.000 description 5
- 230000003449 preventive effect Effects 0.000 description 5
- 239000007787 solid Substances 0.000 description 5
- 229920000181 Ethylene propylene rubber Polymers 0.000 description 4
- 108010014173 Factor X Proteins 0.000 description 4
- 230000008901 benefit Effects 0.000 description 4
- 230000008859 change Effects 0.000 description 4
- 230000007797 corrosion Effects 0.000 description 4
- 238000005260 corrosion Methods 0.000 description 4
- 238000000354 decomposition reaction Methods 0.000 description 4
- 230000007613 environmental effect Effects 0.000 description 4
- 239000007788 liquid Substances 0.000 description 4
- 238000010606 normalization Methods 0.000 description 4
- 230000008439 repair process Effects 0.000 description 4
- 238000012360 testing method Methods 0.000 description 4
- 239000004705 High-molecular-weight polyethylene Substances 0.000 description 3
- 230000004888 barrier function Effects 0.000 description 3
- 238000003745 diagnosis Methods 0.000 description 3
- 238000007689 inspection Methods 0.000 description 3
- 230000007935 neutral effect Effects 0.000 description 3
- 230000008646 thermal stress Effects 0.000 description 3
- 101100080611 Caenorhabditis elegans nsf-1 gene Proteins 0.000 description 2
- 229920006798 HMWPE Polymers 0.000 description 2
- 238000001816 cooling Methods 0.000 description 2
- 238000007418 data mining Methods 0.000 description 2
- 238000007872 degassing Methods 0.000 description 2
- 238000002372 labelling Methods 0.000 description 2
- 230000000670 limiting effect Effects 0.000 description 2
- 238000004519 manufacturing process Methods 0.000 description 2
- 238000012544 monitoring process Methods 0.000 description 2
- 230000036961 partial effect Effects 0.000 description 2
- 150000003071 polychlorinated biphenyls Chemical class 0.000 description 2
- 229910052573 porcelain Inorganic materials 0.000 description 2
- 230000001681 protective effect Effects 0.000 description 2
- 230000009466 transformation Effects 0.000 description 2
- 238000011179 visual inspection Methods 0.000 description 2
- 238000004804 winding Methods 0.000 description 2
- 101100281510 Neurospora crassa (strain ATCC 24698 / 74-OR23-1A / CBS 708.71 / DSM 1257 / FGSC 987) met-6 gene Proteins 0.000 description 1
- 206010039203 Road traffic accident Diseases 0.000 description 1
- 230000002411 adverse Effects 0.000 description 1
- 230000015556 catabolic process Effects 0.000 description 1
- 238000004140 cleaning Methods 0.000 description 1
- 238000010276 construction Methods 0.000 description 1
- 230000002596 correlated effect Effects 0.000 description 1
- 230000006378 damage Effects 0.000 description 1
- 230000007547 defect Effects 0.000 description 1
- 230000003831 deregulation Effects 0.000 description 1
- 238000001514 detection method Methods 0.000 description 1
- 230000006866 deterioration Effects 0.000 description 1
- 238000009429 electrical wiring Methods 0.000 description 1
- 239000000835 fiber Substances 0.000 description 1
- 230000009474 immediate action Effects 0.000 description 1
- 238000010348 incorporation Methods 0.000 description 1
- 230000007257 malfunction Effects 0.000 description 1
- 239000000463 material Substances 0.000 description 1
- 238000012986 modification Methods 0.000 description 1
- 230000004048 modification Effects 0.000 description 1
- 230000003287 optical effect Effects 0.000 description 1
- 238000006116 polymerization reaction Methods 0.000 description 1
- 230000008569 process Effects 0.000 description 1
- 230000004044 response Effects 0.000 description 1
- 238000012552 review Methods 0.000 description 1
- 238000012502 risk assessment Methods 0.000 description 1
- 230000001932 seasonal effect Effects 0.000 description 1
- 238000010206 sensitivity analysis Methods 0.000 description 1
- 230000002459 sustained effect Effects 0.000 description 1
- 238000012546 transfer Methods 0.000 description 1
- XLYOFNOQVPJJNP-UHFFFAOYSA-N water Substances O XLYOFNOQVPJJNP-UHFFFAOYSA-N 0.000 description 1
Images


Classifications
-
- H—ELECTRICITY
- H02—GENERATION; CONVERSION OR DISTRIBUTION OF ELECTRIC POWER
- H02J—CIRCUIT ARRANGEMENTS OR SYSTEMS FOR SUPPLYING OR DISTRIBUTING ELECTRIC POWER; SYSTEMS FOR STORING ELECTRIC ENERGY
- H02J3/00—Circuit arrangements for ac mains or ac distribution networks
-
- H—ELECTRICITY
- H02—GENERATION; CONVERSION OR DISTRIBUTION OF ELECTRIC POWER
- H02J—CIRCUIT ARRANGEMENTS OR SYSTEMS FOR SUPPLYING OR DISTRIBUTING ELECTRIC POWER; SYSTEMS FOR STORING ELECTRIC ENERGY
- H02J2203/00—Indexing scheme relating to details of circuit arrangements for AC mains or AC distribution networks
- H02J2203/20—Simulating, e g planning, reliability check, modelling or computer assisted design [CAD]
-
- Y—GENERAL TAGGING OF NEW TECHNOLOGICAL DEVELOPMENTS; GENERAL TAGGING OF CROSS-SECTIONAL TECHNOLOGIES SPANNING OVER SEVERAL SECTIONS OF THE IPC; TECHNICAL SUBJECTS COVERED BY FORMER USPC CROSS-REFERENCE ART COLLECTIONS [XRACs] AND DIGESTS
- Y02—TECHNOLOGIES OR APPLICATIONS FOR MITIGATION OR ADAPTATION AGAINST CLIMATE CHANGE
- Y02E—REDUCTION OF GREENHOUSE GAS [GHG] EMISSIONS, RELATED TO ENERGY GENERATION, TRANSMISSION OR DISTRIBUTION
- Y02E60/00—Enabling technologies; Technologies with a potential or indirect contribution to GHG emissions mitigation
-
- Y—GENERAL TAGGING OF NEW TECHNOLOGICAL DEVELOPMENTS; GENERAL TAGGING OF CROSS-SECTIONAL TECHNOLOGIES SPANNING OVER SEVERAL SECTIONS OF THE IPC; TECHNICAL SUBJECTS COVERED BY FORMER USPC CROSS-REFERENCE ART COLLECTIONS [XRACs] AND DIGESTS
- Y04—INFORMATION OR COMMUNICATION TECHNOLOGIES HAVING AN IMPACT ON OTHER TECHNOLOGY AREAS
- Y04S—SYSTEMS INTEGRATING TECHNOLOGIES RELATED TO POWER NETWORK OPERATION, COMMUNICATION OR INFORMATION TECHNOLOGIES FOR IMPROVING THE ELECTRICAL POWER GENERATION, TRANSMISSION, DISTRIBUTION, MANAGEMENT OR USAGE, i.e. SMART GRIDS
- Y04S40/00—Systems for electrical power generation, transmission, distribution or end-user application management characterised by the use of communication or information technologies, or communication or information technology specific aspects supporting them
- Y04S40/20—Information technology specific aspects, e.g. CAD, simulation, modelling, system security
Definitions
- the invention relates generally to reliability assessment of an electric power network and more particularly to a system and method for failure rate adjustment for power network reliability assessment.
- Typical power networks include individual components such as circuit breakers, disconnectors, grounding switches, tie breakers, potential transformers (PT), current transformers (CT), power transformers, overhead lines, underground cables, and the like.
- An individual component typically handles one function for the power network.
- the term power network is defined herein as a system having components for transmission and/or distribution of electrical power and includes any portion of the entire power network.
- the power network may be an entire power transmission and distribution system, a substation, a plurality of substations, a section of a transmission line, a section of a distribution line, and the like.
- reliability parameters are typically determined for each of the individual components.
- a reliability assessment may be performed to calculate some reliability measure for each component in the power network. For example, a reliability assessment system may calculate, for each component a total outage frequency (e.g., the expected number of times that a component will be de-energized per year).
- the total outage frequency may include a component failure rate (e.g., the expected number of times that a component will be de-energized due to a component fault, the probability of component failure in a given time period, and the like), a self maintenance outage frequency (e.g., the expected number of times that a component will be de-energized due to a maintenance of that component), another maintenance frequency (e.g., the expected number of times that a component will be de-energized due to maintenance of another component), and the like.
- component failure rate e.g., the expected number of times that a component will be de-energized due to a component fault, the probability of component failure in a given time period, and the like
- a self maintenance outage frequency e.g., the expected number of times that a component will be de-energized due to a maintenance of that component
- another maintenance frequency e.g., the expected number of times that a component will be de-energized due to maintenance of another component
- These reliability parameters may be determined
- the invention is directed to a system and method for power network reliability assessment with failure rate adjustment.
- a method for providing a reliability assessment of a power network includes determining information representative of a failure rate of a power network component based on a population of power network components of the same type as the power network component, receiving information representative of the condition of the power network component, and determining an adjusted failure rate for the power network component based on the information representative of the failure rate of the power network component and the information representative of the condition of the power network component.
- the method may also include modifying the adjustment index using a feedback loop and based on historical information of power network component failures.
- a system for providing a reliability assessment may include a first data store that includes information representative of a failure rate of a power network component based on a population of power network components of the same type as the power network component and information representative of the condition of the power network component, and a computing application cooperating with the first data store and performing receiving the information representative of a failure rate of a power network component based on a population of power network components of the same type as the power network component from the first data store, receiving the information representative of the condition of the power network component from the first data store, and determining an adjusted failure rate for the power network component based on the information representative of the failure rate of the power network component and the information representative of the condition of the power network component.
- the system may include a feedback loop that performs modifying the adjustment index based on historical information of power network component failures.
- the information representative of a failure rate of a power network component may be received from a data store containing failure rates of a plurality of power network components, the failure rates being based on a population of power network components of the same type as each power network component, by performing data mining on data representative of failures of a plurality of power network components of the same type as the power network component, by processing historical power network component failure data for a plurality of power network components of the same type as the power network component, and the like.
- the information representative of the condition of the power network component may be the age of the power network component, information representative of maintenance performed on the power network component, information representative of preventative maintenance performed on the power network component, information representative of the environment of the power network component, information representative of the operating conditions of the power network component, and the like.
- Determining the adjusted failure rate for the power network component may include determining a plurality of subcomponents contributing to the failure rate of the power network component, determining information representative of a failure rate of the power network component based on a population of power network components of the same type as the power network component, determining information representative of the condition of the power network component corresponding to each subcomponent, converting, for each subcomponent, the corresponding information representative of the condition of the power network component into an adjustment index, combining the adjustment indexes; and converting the combined adjustment index into an adjusted failure rate for the power network component based on the combined adjustment index.
- FIG. 1 is a graphical representation of an exemplary power network having individual power network components for which a power network reliability assessment may be determined in accordance with an embodiment of the invention
- FIG. 2 is a graphical representation of an exemplary power network having integrated components for which a power network reliability assessment may be determined in accordance with an embodiment of the invention
- FIG. 3 is a diagram of an illustrative computing environment and an illustrative system for power network reliability assessment in accordance with an embodiment of the invention
- FIG. 4 is a diagram of an illustrative networked computing environment with which the illustrative system for power network reliability assessment may be employed in accordance with an embodiment of the invention
- FIG. 5 is a diagram of an illustrative system for power network reliability assessment including an illustrative sub-system for failure rate adjustment in accordance with an embodiment of the invention
- FIG. 6 is a diagram of an illustrative system for power network reliability assessment including an indication of illustrative data flow within the system in accordance with an embodiment of the invention
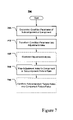
- FIG. 7 is a flow chart of an illustrative method for power network reliability assessment in accordance with an embodiment of the invention.
- FIG. 8 is a chart illustrating the concept of mapping a combined adjustment index into a subcomponent failure rate in accordance with an embodiment of the invention.
- FIG. 9 is a diagram of an illustrative system for modifying weights of a failure rate adjustment system based on historical data in accordance with an embodiment of the invention.
- FIG. 10 is an illustrative screen shot of an illustrative power transformer failure rate model in accordance with an embodiment of the invention.
- FIGS. 11 a–c are diagrams of illustrative functions for failure rate adjustment of subcomponents of a power transformer in accordance with an embodiment of the invention.
- FIG. 12 is an illustrative screen shot of an illustrative cable failure rate model in accordance with an embodiment of the invention.
- FIG. 13 is an illustrative screen shot of an illustrative circuit breaker failure rate model in accordance with an embodiment of the invention.
- FIGS. 14 a–b are illustrative screen shots of illustrative overhead line failure rate models in accordance with an embodiment of the invention.
- FIG. 15 is a diagram of an illustrative function for adjustment of a failure rate of an overhead line due to lightning in accordance with an embodiment of the invention.
- FIG. 16 is a diagram of another illustrative function for adjustment of a failure rate of an overhead line due to lightning in accordance with an embodiment of the invention.
- FIG. 1 illustrates an exemplary power network having individual components, which may each include subcomponents.
- generators 10 a–c are electrically connected to transformers 15 a–c , respectively.
- Transformers 15 a–c are electrically connected to circuit breakers 25 a–c , respectively, and current transformers (CTs) 20 a–c sense current from transformers 15 a–c , respectively.
- Circuit breakers 25 a–c are electrically connected to disconnectors 35 a–c , respectively, which are in turn electrically connected to bus bar 50 t–v , respectively.
- Grounding switches 30 a–c are electrically connected to circuit breakers 25 a–c respectively.
- Bus bars 50 t–v are electrically connected via tie breakers 40 r–s , as shown. From bus bars 50 , power is distributed to loads L 1 –L 4 , again through various circuit breakers 25 and disconnectors 35 . Tie breaker 40 p may connect loads L 1 and L 2 , and tie breaker 40 q may connect loads L 3 and L 4 .
- Tie breakers are normally open, but may be closed when reconfiguring a power network in response to a fault or maintenance. Reconfiguration of a power network attempts to power as many loads as possible, given the fault or maintenance on the power network.
- Faults are handled on a power network having individual components as follows. If a fault occurs on circuit breaker 25 f , power is interrupted with breakers 25 b , 25 j , 40 r , and 40 s , then disconnectors 35 j and 35 f are opened before repair is performed on circuit breaker 25 f . Also, the power network may be reconfigured to supply as many loads as possible during component repair. For example, tie breaker 40 p may be closed to provide power to load L 2 via circuit breaker 25 h , while circuit breaker 25 f is being repaired.
- integrated component 80 f includes disconnector 35 f , grounding switch 30 f , circuit breaker 25 f , and CT 20 f .
- the integrated component, module 80 f includes the functionality of several components. That is, module 80 f includes the functionality of a disconnector switch, a grounding switch, a circuit breaker and a CT. Therefore, the integrated component includes subcomponents (i.e., individual components), each of which, may in turn include several subcomponents.
- FIGS. 1 and 2 are exemplary only and are not intended to limit the invention to any particular configuration of power network components. The invention may be used in any power network reliability assessment using a failure rate.
- FIG. 3 shows computing system 320 that includes computer 320 a .
- Computer 320 a includes display device 320 a ′ and interface and processing unit 320 a ′′.
- Computer 320 a executes computing application 380 .
- computing application 380 includes a computing application processing and storage area 382 and a computing application display 381 .
- Computing application processing and storage area 382 may include reliability system 385 , reliability data 386 , and component condition data 387 .
- Reliability system 385 may implement systems and methods for power network reliability assessment.
- Computing application display 381 may include display content which may be used for power network reliability assessment.
- a user (not shown) may interface with computing application 380 through computer 320 a . The user may navigate through computing application 380 to input, display, and generate data and information for power network reliability assessment.
- Computing application 380 may generate an assessment of power network reliability, such as, for example, an adjusted component failure rate, an expected outage frequency (e.g., the expected number of times that a component will be de-energized per year), a self maintenance outage frequency (e.g., the expected number of times that a component will be de-energized due to a maintenance of that component), another maintenance frequency (e.g., the expected number of times that a component will be de-energized due to maintenance of another component), and the like.
- the power network reliability assessment may be displayed to the user as display content via computing application display 381 .
- FIG. 4 illustrates an exemplary networked computer environment having server computers in communication with client computers, in which systems and methods for power network reliability assessment may be implemented.
- a number of server computers 410 a , 410 b , etc. are interconnected via a communications network 450 with a number of client computers 420 a , 420 b , 420 c , etc., or other computing devices, such as, a mobile phone 430 , and a personal digital assistant 440 .
- Communication network 450 may be a wireless network, a fixed-wire network, a local area network (LAN), a wide area network (WAN), an intranet, an extranet, the Internet, or the like.
- server computers 410 can be Web servers with which client computers 420 communicate via any of a number of known communication protocols, such as, hypertext transfer protocol (HTTP), wireless application protocol (WAP), and the like.
- HTTP hypertext transfer protocol
- WAP wireless application protocol
- Each client computer 420 can be equipped with a browser 460 to communicate with server computers 410 .
- personal digital assistant 440 can be equipped with a browser 461 and mobile phone 430 can be equipped with a browser 462 to display and communicate data and information.
- the user may interact with computing application 380 to perform power network reliability assessment, as described above.
- the generated reliability assessments may be stored on server computers 410 , client computers 420 , or other client computing devices.
- the generated reliability assessments may be communicated to users via client computing devices, client computers 420 , or the like.
- systems and methods for power network reliability assessment can be implemented and used in a computer network environment having client computing devices for accessing and interacting with the network and a server computer for interacting with client computers.
- the systems and methods can be implemented with a variety of network-based and standalone architectures, and thus should not be limited to the examples shown.
- Computing application processing and storage area 382 may include a reliability data store 386 and a component condition data store 387 .
- Reliability data store 386 may include information representative of the reliability of power network components, such as, for example, historical information on the failure rate of a particular type of circuit breaker, historical information on the failure rate of a particular type of power transformer, historical information on the failure rate of a particular type of overhead power line, and the like. Such information may be available from various electric utility organizations and particular illustrations of such information are described in more detail below.
- the information may be in the form of a reference database (e.g., a library of component failure rates, aggregated and decomposed, national/regional average and utility-specific statistics, and the like). This component reliability data represents typical average system values for different types of components.
- the information in reliability data store 386 may be used by reliability system 385 to determine a failure rate for a type of power network component, which may in turn be used to determine a reliability assessment for the power network.
- Component condition data store 387 may include information representative of the condition of a particular power network component, such as, for example, the age of a particular circuit breaker, the number of problems experienced with a particular circuit breaker, the number of months since the last preventive maintenance performed on a particular circuit breaker, and the like. Such information is described in more detail below.
- the information in component condition data store 387 can be used by reliability system 385 to adjust the failure rate determined from reliability data store 386 .
- the information may include details of line sections of different feeders of a power network.
- the data may include the length, size and type of conductor, numbers of trees in the vicinity, the protective device, the number of customers, connectivity information for the line sections, and the like.
- the number of years since the last tree trimming may also be specified for some of the line sections.
- the information may also include a list of interruptions on feeders for a period of years, the time and date of the interruption, the duration of the interruption, the type of protective device that operated during the interruption, the number of customers interrupted, the location or most likely location of the interruption, the cause of the interruption, and the like.
- the information may also include weather data for the geographical location of the utility.
- This information may include daily average wind speed, daily peak wind speed, an indicator of thunderstorm activity for each day, and the like.
- Three wind related factors may include peak wind speed, number of days with peak speed higher than 16 miles/hour, and number of days with average speed higher than 10 miles/hour for a given year to determine a wind index for each year.
- reliability assessment system 385 may be able to more realistically model the reliability of a power network.
- Computing application processing and storage area 382 may include other data stores (not shown).
- computing application processing and storage area 382 may include a data store that contains information representative of the interconnectivity of individual components of a power network, for example, the interconnectivity of the components of FIG. 1 .
- the data store may include information representing that generator 10 a is electrically connected to transformer 15 a , etc.
- Computing application processing and storage area 382 may further include a data store that contains information representative of individual component maintenance times, maintenance frequencies, failure times, and the like, such as, for example, a maintenance frequency (MF), a mean time to maintain (MTTM), a mean time to repair (MTTR), a mean time to switch (MTTS) for switching components, and the like, which may be used to determine a reliability assessment for a power network.
- MF maintenance frequency
- MTTM mean time to maintain
- MTTR mean time to repair
- MTTS mean time to switch
- computing application processing and storage area 382 includes two databases
- computing application processing and storage area 382 may include any number of databases.
- the various data and information within computing application processing and storage area 382 may be distributed among various databases in any convenient fashion.
- the data and information in computing application processing and storage area 382 may be stored in any convenient manner, such as, for example, in a multidimensional database, a relational database, tables, data structures, an analytical database, an operational database, a hybrid database, a text file, and the like.
- One of the challenges of performing reliability assessment is to have an accurate set of component failure rates.
- analysis was performed with typical average values gleaned from the literature.
- components of the failure rate are generally not available (e.g., which portion of the failure rate is due to lightning, animal, trees, accident, subcomponents of the power component, etc.).
- failure rates are not currently available on a seasonal basis for determining the impact of lightning activity, storms, and the like.
- failure rates are not available that take into consideration the impact of preventive maintenance, such as, for example, tree trimming, insulator cleaning, and the like.
- Reliability system 385 may modify the conventional component failure rate (e.g., determined by analyzing a population of components of a similar type) according to factors that impact the actual failure rate, such as the condition of the component.
- the factors may include intrinsic factors, external factors, human errors, operation and maintenance factors, and the like.
- Intrinsic factors may include factors such as age of equipment, manufacturing defects, size of conductors, and the like.
- External factors may include factors such as exposure to trees, birds/animals, wind, lightning, ice, and the like.
- Human error factors may include factors, such as vehicular accidents, accidents caused by utility or contractor work crew, vandalism, and the like. Historical information can also be utilized to help tune the model, as described in more detail below.
- Reliability system 385 may determine adjusted failure rates for various power network components, such as, for example, transformers, cables, circuit breakers, overhead lines, and the like.
- a failure rate may be the frequency that a sustained fault will occur on a piece of equipment that needs to be fixed by crews, and is usually measured as the interruptions per mile-year for overhead lines and cables or the interruptions per year for transformers and circuit breakers, but may be described in other terms.
- Components may be assigned an adjusted failure rate close to or very different from the conventional failure rates depending on the component conditions. Under extreme conditions, components on the system may be expected to experience many more outages than the average failure rate. For example, it is expected that exposure to harsh environmental conditions or extended deterioration of a component can increase the frequency of service interruptions. Under ideal conditions, components on the system may be expected to experience less outages than the average failure rate. For example, it is expected that effective preventive maintenance can reduce the frequency of service interruptions.
- Reliability system 385 may modify or adjust the average failure rate based on a variety of factors.
- the component failure rate can be decomposed into failure rates associated with a number of predefined contribution factors (e.g., primary causes of interruptions or subcomponents).
- each contribution factor may be correlated to a number of sub-factors (e.g., features representing component conditions). These factors (or features) can be measured or observed based on predefined assessment criteria and may include preventive maintenance activities.
- Reliability system 385 may determine an adjusted failure rate to determine a reliability assessment of the power network.
- Reliability system 385 may include a reliability assessment system that uses the adjusted failure rate and also determines other reliability assessments of the power network.
- reliability system 385 may be implemented in a reliability assessment system 500 shown in FIG. 5 .
- Illustrative reliability assessment system 500 assesses the reliability of overhead lines (OHL), however, system 500 may assess the reliability of any power network component, may assess the reliability of the entire power network, a portion of the power network, and the like.
- system 500 receives information 505 that includes information representative of the condition of a power network component (e.g., the condition of an overhead line, the tree density near the overhead line, etc.).
- Module 510 determines an adjusted failure rate of a power network component based on information 505 .
- Root cause analysis module 520 may identify factors with the largest impact on power network reliability based on the adjusted failure rate.
- Criticality ranking module 530 may rank factors based on their impact on failure rates and may rank power network components based on their impact on the power network reliability.
- Options module 540 may receive various options (e.g., from a user interface or a part of an analysis program) related to operation, maintenance, and component replacement.
- Module 510 may determine various adjusted failure rates based on the various options received by module 540 .
- the adjusted failure rates may be used by reliability assessment module 550 (which may be a conventional reliability assessment module) to determine reliability assessments based on the various adjusted failure rates.
- the various reliability assessments may be received by cost/benefit calculation module 560 which may analyze the costs and benefits associated with the various operation, maintenance, and replacement options received by options module 540 .
- Cost/benefit calculation module 560 may then determine a recommended operation, maintenance, or replacement strategy 570 , such as, for example, a recommendation to trim trees near the overhead power line, and the like.
- the adjusted failure rate can be incorporated into a conventional reliability assessment system (e.g., via incorporation of failure rate module 510 into an existing reliability assessment system), thereby leveraging the existing investment in existing reliability assessment systems.
- Determining an adjusted failure rate may be implemented by reliability system 385 in a variety of ways.
- FIG. 6 shows illustrative details of reliability system 385 and
- FIG. 7 shows an illustrative method 700 for determining the adjusted failure rate. While the following description may include references to the computing system of FIG. 3 , method 700 and system 385 may be implemented in a variety of ways, such as, for example, by a single computing engine, by multiple computing engines, via a standalone computing system, via a networked computing system, via other knowledge-based systems, and the like.
- reliability system 385 determines condition features of the power network component.
- the condition features may include the age of the power network component, the maintenance performed on the power network component, and the like and may be received from component condition data store 387 .
- transform function 610 of reliability system 385 may transform the condition feature into an adjustment index, as described in more detail below. As shown in FIG. 6 , transform functions 610 a – 610 e may each receive a single or multiple features.
- combining function 620 of reliability system 385 may combine multiple adjustment indexes into a combined adjustment index. As shown in FIG. 6 , combining function 620 a combines the adjustment indexes from transform functions 610 a and 610 b and combining function 620 b combines the adjustment indexes from transform functions 610 c , 610 d , and 610 e.
- mapping function 630 of reliability system 385 maps the adjustment index from step 710 (or the combined adjustment index from step 720 if there is more than one adjustment index) into a subcomponent failure rate (or into a component failure rate if there is one adjustment index). As shown in FIG. 6 , mapping function 630 maps an adjustment index into a subcomponent failure rate. As shown, mapping function 630 a maps the combined adjustment index from combining function 620 a into a subcomponent failure rate and mapping function 630 b maps the combined adjustment index from combining function 620 b into a subcomponent failure rate.
- An appropriate cumulative distribution function can be defined for each type of component to represent the statistical characteristics of component failure rates or factor-related failure rates.
- the statistical characteristics of component failure rates can be represented by appropriate distribution functions, such as, for example, in the form of a WeiBull distribution or a Lognormal distribution. Furthermore, the parameters of such distribution functions can be properly determined based on the given average system failure rate and some boundary conditions.
- FIG. 8 shows an illustrative probability distribution function and a cumulative distribution function for determining a failure rate. As shown in the chart of FIG. 8 , the x-axis denotes a failure rate, the y-axis denotes a probability of failure.
- the probability distribution function curve is the probability distribution function of the failure rate of a specific type of network component.
- the cumulative probability distribution curve is the cumulative probability distribution function of the failure rate of a specific type of network component type.
- summing function 640 of reliability system 385 combines the subcomponent failure rates from step 730 into a component failure rate. As shown in FIG. 6 , summing function 640 sums the subcomponent failure rates from mapping functions 630 a and 630 b into a component failure rate.
- an adjusted component failure rate ( ⁇ C ) may be calculated as the sum of all factor or feature-related failure rates ( ⁇ F ). Weight multipliers may be applied to the component and the factor-related failure rates such that the failure rate model can generate a component reliability failure rate consistent with particular component system outage statistics, such as for example, given in Equation 1.
- ⁇ C W C ⁇ ⁇ i ⁇ ⁇ W F , i ⁇ ⁇ F , i Equation ⁇ ⁇ 1
- Each factor-related failure rate may be a single-input, single output (SISO) function of a composite per-unit factor value (CF) which represents the overall component exposure to forced outage relating to that particular cause or subcomponent.
- SISO single-input, single output
- CF composite per-unit factor value
- An appropriate cumulative distribution function typically in the form of WeiBull distribution or Lognormal distribution, may be defined to transform CF to ⁇ F .
- the composite per-unit factor value may be calculated as a product or a weighted sum of all normalized sub-factor values (NSF).
- Multiplier W SF is applied such that the failure rate model can be tuned to output an average-valued CF, for example 0.5, corresponding to a default or typical set of component conditions.
- Each normalized sub-factor value may be a SISO function of the original sub-factor value (SF) or input variable.
- the SISO function may be selected from a range of forms, including linear, power, exponential, logistic functions, and the like.
- NSF j ⁇ ( SF j ) Equation 5
- the failure rate model may receive a set of input variables or features representing the component condition that may have impacts on actual component reliability.
- the input variables may include design and operational characteristics, external conditions, environmental exposures, preventive maintenance activities, and the like.
- Default values may be predefined values representing component conditions associated with the average system failure rates. Value ranges may be predefined and assessment criteria may be objectively (e.g., operation history and testing) or subjectively (e.g., inspection and estimation) determined.
- An input variable may have an impact on multiple factor-related failure rates. Also, an input variable may be disabled if the information is not available.
- Normalization may be provided as a basis of performing intermediate multi-attribute calculations and to reflect any saturation effects.
- SISO functions can be implemented as normalization functions, all of the illustrative functions having two parameters (e.g., A and B).
- Various default normalization functions may be implemented for different types of input variables.
- mapping functions for substation transformers, cables, circuit breakers and overhead lines, are described in more detail below.
- the mapping functions may be defined based on Equations 3 and 4 and may provide quantitative relationships between factors and related features. With these mapping functions, the composite per-unit factor values can be calculated as a result of all features at the assessed component conditions.
- the composite per-unit factor values may then be transformed to the factor-related failure rates based on appropriate probability distributions.
- FIG. 8 shows the concept of such a transformation. It may be assumed that the failure rates of a specific type of component observes a particular probability distribution, for example, in the form of WeiBull distribution or Lognormal distribution. This means that the composite per-unit factor value may be regarded as the probability of a piece of equipment having an outage frequency equal to or higher than a corresponding failure rate. In other words, an appropriately defined cumulative distribution function (CDF) may be used to transform a composite per-unit factor value to a factor-related failure rate.
- CDF cumulative distribution function
- the composite per-unit factor value may first be transformed to a multiplier to the system average value of factor-related failure rate.
- the product of this multiplier and the system average value of factor-related failure rate may then give the expected factor-related failure rate for this particular component.
- the Lognomal CDF may be defined with two parameters ⁇ and ⁇ , where ⁇ is equal to zero and ⁇ should be valued such that the predefined boundary conditions can be satisfied. Specific illustrations of determining an adjusted failure rate are given below.
- Transformers can be categorized in different ways, for example, oil-filled or dry-type, three-phase or single-phase, by voltage level, and the like. Such categorizing may help reduce the complexity involved with trying to setup a universal model for all transformers. The illustration below considers a substation level oil-filled power transformer.
- Table 1 lists measurable and/or observable transformer features and categorizes them into eight component-related factors that may contribute to the overall failure rate.
- X May be very complex Oil treatment Gas-in-oil monitoring, oil replace or degassing X X Developing trend of condition A composite value based on history of gas-in-oil analysis.
- X May be very complex Loss Power factor (PF) X X X Electrical strength Breakdown level in kV/mm X X X Thermal Stress Condition of cooling system A composite value from the status of fans, pumps X X (Cooling equipment) Environment Average ambient temperature X X Load level Average load factor X X X Coil temperature Average top oil temperature and winding spot temperature from X internal sensors Core Structure tightness Noise level X X X Maintenance Tear down inspection X Bushing Type Gas filled, oil filled or paper X Loss Power factor X X X X Partial discharge (PD) PD intensity: discharge amplitude (pC) * discharge rate X (pulses per second) Voltage distribution Evenness of the voltage distribution X Structure Integrity Damage/leakage inspection/repair X X On-Lo
- X May be very complex Control & Protection Readiness Installation and settings X X Service time Time from last maintenance X Network characteristics Frequency of operating events X X X Weather characteristics Lightning activities X X X Auxiliary equipment Condition Condition of CT, PT and the like X Maintenance Maintenance of CT, PT and the like X X X
- the “Mini” model used the inverse Weibull CDF function and a weighted sum of the factors specified.
- the weights were defaulted to 1 because the decomposition of utility level failure rate into factor related failure rates already considered the utility failure rate statistics. However, a user may choose to change weights and the factor-related failure rates' distribution parameters to better reflect actual utility situations.
- the “Mini” model was implemented using an Excel spreadsheet. As shown in FIG. 10 , the model may include three parts: the upper-right “Transformer Type Selection” part, the middle “Modeling” part and the lower “Result Presentation” part. Changing the transformer type will change the values of column “FR — 0.5” and “FR_max” in the modeling part, but the user can override values in these two columns once the type is fixed.
- the modeling part includes five groups of columns: “Factors,” “Features,” “Feature Manipulation,” “Factor based FR Estimation,” and “Final Combination Weights.” The “Factor” column shows the name of the factor.
- the “Features” group includes three columns: the “Name” for identification, the “Value” for input, and the “Description” for unit explanation. Comments in the “Name” cells instruct users how to compute the input value.
- the “Feature Manipulation” group includes the “Normalization” of features where the feature-subfactor SISO functions are applied, and the “Combination” of subfactor values where the weighted sum or product operations take place and the subfactor-factor SISO functions are applied.
- the “Factor based FR Estimation” group may use the failure rate statistics to compute the failure rate related to each factor, and the final failure rate may be computed using the “Final Combination Weights” and the “Output” of “Factor based FR Estimation.”
- each final failure rate can be listed with its corresponding feature values and the transformer type, allowing a quick comparison between up to 11 scenarios or more. This is done by using the “Add” button once the feature values and the transformer type is fixed. The user can clear the presentation part using the “Clear” button. The user may be advised not to change anything other than work with the “Value” column in “Features” group, the three columns of “WeiBull CDF Parameters,” the “Final Combination Weights” column, and the combo boxes.
- SISO functions correspond to the “Mini” transformer failure rate model and were developed based on several IEEE standards and experience.
- FIGS. 11 a , 11 b , and 11 c show illustrative functions for thermal stress load level feature, core/tank noise level feature, and bushing power factor feature, respectively.
- Equations 8 and 9 are illustrative functions for an On-Load Tap Changer (OLTC) Load Level (LL) and Working Duty (Duty), respectively.
- OLTC On-Load Tap Changer
- LL Load Level
- Duty Working Duty
- Equation 11 is illustrative of a control and protection (CP) function that includes network and weather features.
- Table 4 is an illustrative look-up table implementing a function for an auxiliary equipment maintenance function.
- the “Mini” model used the inverse Weibull CDF function and a weighted sum of all factors specified by ⁇ Fi .
- the weights were defaulted to 1 because the decomposition of utility level failure rate into factor related failure rates already considered the utility failure rate statistics. However, the user may choose to change the weights or even the factor related failure rates' distribution parameters to better reflect the actual component situation.
- FIG. 12 shows an illustrative cable failure rate model, which is similar to the transformer failure rate model described above.
- Three data sources were used and the results are summarized in Table 6. Their description, references and mean failure rate (FR_Mean, per mile year) are listed below.
- FR_Mean mean failure rate
- FR_Insulation 60%*FR_Mean
- FR_JT 40%*FR_Mean based on the assumption that 40% of the cable faults may be related to joint/termination/accessories.
- Table 7 is an illustration of a look-up table implemented function for a cable insulation type function.
- HMWPE denotes High Molecular Weight Polyethylene
- XLPE denotes Cross-Linked Polyethylene
- EPR denotes Ethylene Propylene Rubber
- PILC Paper-Insulated Lead Covered
- TR means Tree-Retarded
- J means jacketed
- NJ means non-jacketed.
- the values of f(Insulation) were determined mainly from AEIC data.
- Table 8 is an illustrative look-up table implemented function for a cable installation mode function.
- Table 9 is an illustrative look-up table implemented function for a joint/termination type function.
- Table 10 is an illustrative look-up table implemented function for a joint/termination maintenance function.
- Table 11 shows illustrative transmission PCB outage statistics.
- outage statistics are reported by voltage classification and interrupting medium. Outage statistics are distinguished between subcomponent related interruptions and terminal equipment related interruptions. Failure rate is estimated by the Service Time Failure Rate, which is defined as the ratio of the total number of outages actually observed during a certain period of time and the total exposure time in component-years.
- Table 12 shows illustrative reliability data of 60 kV-149 kV PCBs in Canadian power networks, corresponding to a U.S. system (69 ⁇ 138 kV ratings). It can be seen that SF-6-Dead Tank and Air-Blast circuit breakers experienced higher failure rates than other types of PCBs. In this case, operating mechanisms, auxiliary equipment, and control & protection equipment are shown to be the main factors to the outages.
- Table 13 shows an illustrative list of features along with a proposed assessment criteria and value ranges. As shown, the feature of breaker type is used in the situation when the given outage statistics are aggregated for all types of interrupting medium, however, the feature of breaker type could be used in all cases.
- Table 14 shows an illustrative list of mapping functions in weighted sum forms.
- the failure rate associated with auxiliary equipment may be related to three features: breaker type, maintenance and environmental condition.
- the composite per-unit factor value for auxiliary equipment can then be determined by the following calculation in Equation 14, where NSF 1 , NSF 7 , and NSF 8 are the assessed feature values for a particular PCB and NSF 1-max , NSF 7-max , and NSF 8-max are the maximum feature values defined in Table 13.
- Multiplier W SF (default value of W SF is one) may be used to adjust the obtained failure rate such that the PCB reliability data set generated is consistent with the given system outage statistics.
- CF 7 W SF ⁇ 0.5 ⁇ NSF 1 + 0.3 ⁇ NSF 7 + 0.2 ⁇ NSF 8 0.5 ⁇ NSF 1 - max + 0.3 ⁇ NSF 7 - max + 0.2 ⁇ NSF 8 - max Equation ⁇ ⁇ 13
- FIG. 13 shows an illustrative spreadsheet model for PCB failure rate estimation.
- the lognormal cumulative distribution function may be used for mapping the composite per-unit factor values to factor-related failure rates.
- the user may also define an appropriate value range of multipliers under certain confidence level, say 95%.
- the value range may be set at 0 ⁇ 3.5 which means the estimated failure rate for an individual PCB would be anywhere from zero to three and half times of the average system failure rate value depending on the assessment of condition-related features.
- Table 15 shows an illustrative industry report on overhead line (OHL) outage statistics by primary causes of interruptions. As shown, outage statistics are reported by primary causes of interruptions, including intrinsic factors, external factors and human error factors. Each primary cause may be further decomposed if detailed information is available from a utility outage management system (OMS).
- OOMS utility outage management system
- the failure rate may be estimated by the Service Time Failure Rate, which is defined as the ratio of the total number of outages actually observed during a certain period of time and the total exposure time in mile-years.
- Table 16 shows an illustrative list of features along with a proposed assessment criteria and corresponding value ranges.
- the failure rate associated with tree contact may be related to three features: tree density, tree trimming and conductor size.
- the composite per-unit factor value for tree contact can then be determined by the following calculation, where NSF 8 , NSF 9 , and NSF 10 are the assessed feature values for a particular OHL segment and NSF 8-max , NSF 9-max , and NSF 10-max are the maximum feature values defined in Table 16.
- Multiplier W SF (default value of W SF is one) may be used to adjust the obtained failure rate such that the OHL reliability data set generated is consistent with the given system outage statistics.
- FIGS. 14 a and 14 b show an illustrative spreadsheet model for OHL failure rate estimation.
- the lognormal cumulative distribution function is used for mapping the composite per-unit factor values to factor-related failure rates.
- the evaluated failure rate in FIG. 14 a corresponds to typical or average system condition-related feature values while the evaluated failure rate in FIG. 14 b corresponds to a set of worse condition-related feature values.
- N direct-hit N d (1 ⁇ S f ) Equation 16
- S f the shielding factor of the line (S f is affected by nearby trees, buildings, relative altitude of the line, etc.)
- N d the flash collection rate of a line in open ground areas (no significant trees and buildings nearby).
- N d may be given by:
- N d N g ⁇ ( 28 ⁇ h 0.6 + b 10 ) ⁇ [ failures / 100 ⁇ ⁇ km ⁇ / ⁇ yr ] Equation ⁇ ⁇ 17
- h is the pole height (m)
- b is the structure width (m)
- N g is the ground flash density (GFD) of lightning [flashes/km 2 /yr].
- N direct-hit-flashover N direct-hit *Pct ( CFO, R i ) Equation 20
- Pct is the percentage of direct-hits caused flashovers. It is a function of the critical impulse flashover voltage (CFO) and the pole footing resistance (shielding wires are assumed to be grounded at every pole).
- CFO critical impulse flashover voltage
- pole footing resistance shielding wires are assumed to be grounded at every pole.
- a shield-wire modeling process may be used to obtain Pct(CFO, R i ), which may be simplified using the following logistic function:
- N induced GFD * ⁇ ( CFO, LineType) Equation 22
- LineType is “Ungrounded line” or “Line with a grounded neutral or shield wire”.
- a curve set in IEEE Std 1410-1997 represents the function in Equation 22. Again, this set may be simplified using the following logistic function:
- Equation 23 may be represented in FIG. 16 where the one curve corresponds to the “Ungrounded line” and the other curve corresponds to “Line with a grounded neutral or shield wire.”
- the number of flashovers is in the range between N induced calculated from Equation 22 and N d calculated from Equation 17.
- the user may decide which equation to use, or a simple FIS may be used to decide based on a user specification (e.g., conservative/moderate/aggressive).
- the model for determining an adjusted failure rate may be tuned to provide more accurate results over time.
- the model may be tuned such that the estimated component reliability data attempts to match the historical outage distribution either by primary causes or by subcomponents as appropriate or as desired by the user.
- the component reliability data could be adjusted such that the calculated system reliability index SAIFI matches the historical system reliability index SAIFI allocated to a particular type of component.
- FIG. 9 is a diagram of an illustrative system 900 showing the concept of failure rate model tuning.
- the following equations provide an embodiment for tuning the failure rate model to match historical outage cause distribution and SAIFI contribution statistics.
- the average component failure rates are calculated, both factor-related and component-aggregate, as well as the percentage contributions of factor-related failure rates to the component-aggregate failure rate.
- the value of factor-related multiplier W F for each factor is determined, which is defined as the ratio of historical percentage contribution (from historical outage distribution and SAIFI 920 ) to the calculated percentage contribution (from calculated outage distribution and SAIFI 910 ).
- the factor-related failure rate ( ⁇ F ) 940 a , 940 b associated with each individual component is multiplied by the calculated factor-related multiplier, W F .
- component multiplier W C is determined, which is defined as the ratio of historical average system failure rate (from historical outage distribution and SAIFI 920 ) to the calculated average system failure rate (from calculated outage distribution and SAIFI 910 ).
- the component failure rate ( ⁇ C ) associated with each individual component is multiplied by the calculated component multiplier, W C . Note that the outage distribution adjustment is performed after completing the component failure rate estimation to adjust the resulting component reliability data set, in terms of outage distribution pattern and average system failure rate value, so that the historically experienced outage statistics are satisfied.
- the SAIFI indices may be calculated via network reliability assessment simulation using the component failure rates obtained from the failure rate estimation model. They may not match the actual system reliability indices, even though the average system failure rate can be tuned consistent with historical data.
- the calculation of SAIFI involves the number of customers interrupted by the component outages, a factor that is independent of the component failure rate.
- a simple way is to further adjust the component multiplier W C , is scaling up or down based on the ratio of historical SAIFI contribution to the simulated SAIFI contribution.
- the features used as inputs to the models illustrate an embodiment using information that might be available from utility engineers. As far as the information that is actually available, this may be determined through the application of these models in consulting cases. The types of information available are expected to vary between utilities. However through experience, it is desired to identify various data set input “types” ranging from minimum data available to what would be available if more extensive component monitoring were in place. Once the desired feature sets are established, the failure rate models may be modified to accommodate this.
- the component reliability models developed may be largely based on literature reviews, other models may be based also on domain experts with extensive field experience, especially for transformer and cable models.
- the models may be developed as a web application that could be used in a web-based environment.
- a reliability assessment may be determined using conventional reliability assessment techniques.
- any fault or maintenance can contribute to the outage frequency and outage duration of a component.
- Modeling the faulting and maintaining of components within the power network with a specific FR, MTTR, MF, and MDs and simulating a fault and maintenance results in each component's total contribution to outage frequency and duration to every other component in the system.
- conventional reliability assessment systems may be easily integrated with the adjusted failure rate to provide more realistic reliability assessment while leveraging the existing base of conventional reliability assessment systems.
- the invention provides a system and method to adjust conventional failure rates to account for the condition of the particular power network component. Once the failure rate is adjusted, the adjusted failure rate can be used by conventional reliability assessment systems.
- the invention may be embodied in the form of program code (i.e., instructions) stored on a computer-readable medium, such as a magnetic, electrical, or optical storage medium, including without limitation a floppy diskette, CD-ROM, CD-RW, DVD-ROM, DVD-RAM, magnetic tape, flash memory, hard disk drive, or any other machine-readable storage medium, wherein, when the program code is loaded into and executed by a machine, such as a computer, the machine becomes an apparatus for practicing the invention.
- a computer-readable medium such as a magnetic, electrical, or optical storage medium, including without limitation a floppy diskette, CD-ROM, CD-RW, DVD-ROM, DVD-RAM, magnetic tape, flash memory, hard disk drive, or any other machine-readable storage medium, wherein, when the program code is loaded into and executed by a machine, such as a computer, the machine becomes an apparatus for practicing the invention.
- the invention may also be embodied in the form of program code that is transmitted over some transmission medium, such as over electrical wiring or cabling, through fiber optics, over a network, including the Internet or an intranet, or via any other form of transmission, wherein, when the program code is received and loaded into and executed by a machine, such as a computer, the machine becomes an apparatus for practicing the invention.
- program code When implemented on a general-purpose processor, the program code combines with the processor to provide a unique apparatus that operates analogously to specific logic circuits.
Abstract
Description
λF,i=ƒ(CF i) i=1, . . .
NSF j=ƒ(SF j)
| TABLE 1 | |||||
| Factor | Sub-factor | Feature | Mini | Medium | Complete |
| Solid Insulation | Age | Operating time in years | X | X | X |
| (Winding + Leads) | Mechanical strength | Degree of polymerization (DP) | X | ||
| Partial discharge (PD) | PD intensity: discharge amplitude (pC) * discharge rate (pulses | X | |||
| per second) | |||||
| Loss | Power factor (PF) | X | X | X | |
| Moisture | Water content (% weight), may be estimated from | X | X | ||
| gas-in-oil analysis | |||||
| External events | Number of experienced through faults | X | |||
| Liquid Insulation | Service time | Time from last service (replace, degassing) | X | X | |
| (Other) | Condition | A composite value based on gas-in-oil analysis. | X | ||
| May be very complex | |||||
| Oil treatment | Gas-in-oil monitoring, oil replace or degassing | X | X | ||
| Developing trend of condition | A composite value based on history of gas-in-oil analysis. | X | |||
| May be very complex | |||||
| Loss | Power factor (PF) | X | X | X | |
| Electrical strength | Breakdown level in kV/mm | X | X | X | |
| Thermal Stress | Condition of cooling system | A composite value from the status of fans, pumps | X | X | |
| (Cooling equipment) | Environment | Average ambient temperature | X | X | |
| Load level | Average load factor | X | X | X | |
| Coil temperature | Average top oil temperature and winding spot temperature from | X | |||
| internal sensors | |||||
| Core | Structure tightness | Noise level | X | X | X |
| Maintenance | Tear down inspection | X | |||
| Bushing | Type | Gas filled, oil filled or paper | X | ||
| Loss | Power factor | X | X | X | |
| Partial discharge (PD) | PD intensity: discharge amplitude (pC) * discharge rate | X | |||
| (pulses per second) | |||||
| Voltage distribution | Evenness of the voltage distribution | X | |||
| Structure Integrity | Damage/leakage inspection/repair | X | X | ||
| On-Load Tap Changer | External events | Number of experienced through faults | X | ||
| Load level | Average load factor | X | X | X | |
| Working duty | Real operation times per month over designed operation times per | X | X | X | |
| month | |||||
| Condition | A composite value based on gas-in-oil analysis. | X | |||
| May be very complex | |||||
| Control & Protection | Readiness | Installation and settings | X | X | |
| Service time | Time from last maintenance | X | |||
| Network characteristics | Frequency of operating events | X | X | X | |
| Weather characteristics | Lightning activities | X | X | X | |
| Auxiliary equipment | Condition | Condition of CT, PT and the like | X | ||
| Maintenance | Maintenance of CT, PT and the like | X | X | X | |
| TABLE 2 | ||
| Xfmr Type | ||
| One | All Tank | ||
| Factors | Three-Phase | Three Single-Phase | Arrangement |
| Solid Insulation | 0.00201542 | 0.00116043 | 0.01040682 |
| Liquid Insulation | 0.01703028 | 0.01334494 | 0.09082308 |
| Thermal Stress | 0.00211619 | 0.00116043 | 0.01087985 |
| Core/Tank | 0.00262004 | 0.00174064 | 0.01371807 |
| Bushings | 0.00836398 | 0.0040615 | 0.04257332 |
| OLTC | 0.01612334 | 0.00580215 | 0.08041627 |
| Control&Protection | 0.03657984 | 0.01450537 | 0.18353832 |
| Auxiliary Equipment | 0.00342621 | 0.00290107 | 0.01844844 |
ƒ(SI)=1−exp(−2.7726*ƒ(Age)*ƒ(SPF))
where Age is the age of the solid insulation in years and SPF is the solid insulation power factor.
ƒ(LI)=1−exp(−2.7726*ƒ(OES)*ƒ(OPF))
where OES is the oil electrical strength in kV/mm of the liquid insulation and OPF is the oil power factor.
ƒ(OLTC-LL)=(OLTC Average Load Level in %)/100
ƒ(OLTC-Duty)=(Number of operations per month)* (Designed life time in months)/(designed operation times)
ƒ(OLTC)=1−exp(−1.912*ƒ(OLTC-LL)*ƒ(OLTC-Duty))
| TABLE 3 | |||
| Network characteristics | f(Network) | ||
| Just a | 0 | ||
| Below average number of switching operations | 0.25 | ||
| Average number of switching operations | 0.5 | ||
| Above average number of switching operations | 0.75 | ||
| Excessive number of switching | 1 | ||
| Weather characteristics (lightning activities) | f(weather) | ||
| A | 0 | ||
| Below average number of lightnings | 0.25 | ||
| Average number of lightnings | 0.5 | ||
| Above average number of lightnings | 0.75 | ||
| Excessive number of | 1 | ||
The combination of the two sub-factors may use the following equation:
ƒ(CP)=1−exp(−2.7726*ƒ(Network)*ƒ(Weather))
| TABLE 4 | |||
| Auxiliary equipment maintenance | f(Aux) | ||
| No maintenance at all | 1 | ||
| Some kinds of maintenance | 0.75 | ||
| Normal maintenance practice | 0.5 | ||
| Frequent maintenance | 0.25 | ||
| | 0 | ||
Cables
| TABLE 5 | |||||
| Factor | SubFactor | Feature | Mini | Medium | Complete |
| Joints and Terminations | Type | Taped workmanship, Premolded technology, | X | X | X |
| (Including conductors) | Shrink technology | ||||
| Service Time | Years | X | X | ||
| Environment | Direct bury, manhole, or cabinent | X | X | ||
| Installation Practice | Crew skillness and responsibility | X | |||
| Maintenance Practice | Diagnosis/replacement/retrofit program | X | X | X | |
| Insulation | Type | HMWPE, XLPE, EPR, TR-XLPE, PILC | X | X | X |
| Service Time | Years | X | X | X | |
| Installation Mode | Direct bury (DB) or duct installation | X | X | X | |
| Maintenance Practice | Diagnosis/replacement/retrofit program | X | |||
| Load Level | Loading factor | X | X | ||
| TABLE 6 | ||
| Data Source | Code | |
| US Industry |
| 3 kV–25 kV [27] | 1 | 0.06 |
| Canada Transmission 69 kV–138 kV [23] | 2 | 0.03 |
| Dutch/US |
3 | 0.005 |
| TABLE 7 | |||
| Insulation Type | f(CblType) | ||
| HMWPE- |
1 | ||
| XLPE-NJ | 0.5 | ||
| XLPE-J | 0.03 | ||
| EPR | 0.05 | ||
| TR-XLPE | 0.03 | ||
| |
0 | ||
| TABLE 8 | |||
| Installation Mode | f(CblMode) | ||
| Direct bury | 1 | ||
| Duct installation | 0.05 | ||
The values of f(CblMode) were also determined mainly from AEIC data.
ƒ(Insulation)=1−exp(−5.545*ƒ(CblType)*ƒ(CblMode)*ƒ(CblAge))
where CblType is the type of cable, CblMode is the installation mode, and CblAge is the age of the cable in years.
| TABLE 9 | |||
| Joint/Termination Type | f(JT-Type) | ||
| |
1 | ||
| Careful Field Wrapping | 0.8 | ||
| Normal Premold Technology | 0.6 | ||
| Careful Premold Technology | 0.4 | ||
| Normal Shrink Technology | 0.2 | ||
| |
0 | ||
| TABLE 10 | |||
| Joint/Termination Maintenance | f(JT-M) | ||
| No maintenance at all | 1 | ||
| Selected visual inspection | 0.75 | ||
| Regular visual inspection | 0.5 | ||
| Routine testing/maintenance | 0.25 | ||
| Extensive testing/ |
0 | ||
ƒ(JT)=1−exp(−2.7726*ƒ(JT−Type)*ƒ(JT−M)) Equation 13
where JT-Type is the joint/termination type and JT-M is the joint/termination maintenance.
Circuit Breakers
| TABLE 11 |
| Circuit Breaker Statistics Involving Integral Subcomponent |
| Voltage | |||||
| Classification | Interrupting Medium | Integral Subcomponent | Outage | Asset Information | |
| 60–109 | Bulk Oil | Bushing (Including CTs) | Number of Outages | Component Years | |
| 110–149 | Minimum Oil | | Frequency | ||
| 150–199 | Air Blast | | Total Time | ||
| 200–299 | SF6 - Live Tank | Insulation System (Support Insulators) | |
||
| 300–399 | SF6 - Dead Tank | Resistors or Grounding | Median Duration | ||
| 500–599 | Vacuum | Interrupting Medium | Unavailability | ||
| 600–799 | All Interrupting Media | Auxiliary Equipment | |||
| Other | |||||
| All Integral Subcomponents | |||||
| Circuit Breaker Statistics Involving Terminal Equipment |
| Voltage | |||||
| Classification | Interrupting Medium | Terminal Equipment | Outage | Asset Information | |
| 60–109 | Bulk Oil | Control & Protection Equipment | Number of Outages | Component Years | |
| 110–149 | Minimum Oil | | Frequency | ||
| 150–199 | Air Blast | | Total Time | ||
| 200–299 | SF6 - Live Tank | | Mean Duration | ||
| 300–399 | SF6 - Dead Tank | Circuit | Median Duration | ||
| 500–599 | Vacuum | Current Transformer | Unavailability | ||
| 600–799 | All Interrupting Media | Potential Device | |||
| Other | |||||
| Unknown | |||||
| All Terminal Equipment | |||||
| TABLE 12 | ||||||
| Component | Number of | Frequency | Percentage | |||
| Interrupting Medium | Years | Subcomponent | Outages | (per a) | (%) | Breaker Type |
| Bulk Oil | 10740.5 | Bushing (Including CTs) | 21 | 0.0020 | 3 | PCB_BO100 |
| Operating Mechanisms | 228 | 0.0212 | 31 | |||
| Interruptors | 5 | 0.0005 | 1 | |||
| Insulation System (Support Insulators) | 7 | 0.0007 | 1 | |||
| Resistors or Grounding Capacitors | 0 | 0.0000 | 0 | |||
| Interrupting Medium | 5 | 0.0005 | 1 | |||
| Auxiliary Equipment | 95 | 0.0088 | 13 | |||
| Other | 43 | 0.0040 | 6 | |||
| Control and Protection Equipment | 327 | 0.0304 | 45 | |||
| All Integral Subcomponents | 731 | 0.0681 | 100 | |||
| Minimum Oil | 3993 | Bushing (Including CTs) | 2 | 0.0005 | 1 | PCB_MO100 |
| Operating Mechanisms | 55 | 0.0138 | 37 | |||
| Interruptors | 1 | 0.0003 | 1 | |||
| Insulation System (Support Insulators) | 11 | 0.0028 | 7 | |||
| Resistors or Grounding Capacitors | 0 | 0.0000 | 0 | |||
| Interrupting Medium | 16 | 0.0040 | 11 | |||
| Auxiliary Equipment | 7 | 0.0018 | 5 | |||
| Other | 5 | 0.0013 | 3 | |||
| Control and Protection Equipment | 50 | 0.0125 | 34 | |||
| All Integral Subcomponents | 147 | 0.0368 | 100 | |||
| Air Blast | 2493 | Bushing (Including CTs) | 6 | 0.0024 | 2 | PCB_AB100 |
| Operating Mechanisms | 82 | 0.0329 | 34 | |||
| Interruptors | 1 | 0.0004 | 0 | |||
| Insulation System (Support Insulators) | 8 | 0.0032 | 3 | |||
| Resistors or Grounding Capacitors | 2 | 0.0008 | 1 | |||
| Interrupting Medium | 13 | 0.0052 | 5 | |||
| Auxiliary Equipment | 21 | 0.0084 | 9 | |||
| Other | 9 | 0.0036 | 4 | |||
| Control and Protection Equipment | 101 | 0.0405 | 42 | |||
| All Integral Subcomponents | 243 | 0.0975 | 100 | |||
| SF6-Live Tank | 2792 | Bushing (Including CTs) | 1 | 0.0004 | 1 | PCB_SL100 |
| Operating Mechanisms | 8 | 0.0029 | 11 | |||
| Interruptors | 0 | 0.0000 | 0 | |||
| Insulation System (Support Insulators) | 10 | 0.0036 | 13 | |||
| Resistors or Grounding Capacitors | 0 | 0.0000 | 0 | |||
| Interrupting Medium | 4 | 0.0014 | 5 | |||
| Auxiliary Equipment | 1 | 0.0004 | 1 | |||
| Other | 0 | 0.0000 | 0 | |||
| Control and Protection Equipment | 52 | 0.0186 | 68 | |||
| All Integral Subcomponents | 76 | 0.0272 | 100 | |||
| SF6-Dead Tank | 1471 | Bushing (Including CTs) | 1 | 0.0007 | 1 | PCB_SD100 |
| Operating Mechanisms | 28 | 0.0190 | 17 | |||
| Interruptors | 0 | 0.0000 | 0 | |||
| Insulation System (Support Insulators) | 25 | 0.0170 | 15 | |||
| Resistors or Grounding Capacitors | 0 | 0.0000 | 0 | |||
| Interrupting Medium | 16 | 0.0109 | 10 | |||
| Auxiliary Equipment | 18 | 0.0122 | 11 | |||
| Other | 13 | 0.0088 | 8 | |||
| Control and Protection Equipment | 65 | 0.0442 | 39 | |||
| All Integral Subcomponents | 166 | 0.1128 | 100 | |||
| All Interupting Media | 21504.5 | Bushing (Including CTs) | 31 | 0.0014 | 2 | PCB_AM100 |
| Operating Mechanisms | 401 | 0.0186 | 29 | |||
| Interruptors | 7 | 0.0003 | 1 | |||
| Insulation System (Support Insulators) | 61 | 0.0028 | 4 | |||
| Resistors or Grounding Capacitors | 2 | 0.0001 | 0 | |||
| Interrupting Medium | 54 | 0.0025 | 4 | |||
| Auxiliary Equipment | 142 | 0.0066 | 10 | |||
| Other | 70 | 0.0033 | 5 | |||
| Control and Protection Equipment | 595 | 0.0277 | 44 | |||
| All Integral Subcomponents | 1363 | 0.0634 | 100 | |||
| TABLE 13 | |||
| Feature | Description | Assessment | Range |
| Age | In service years | <21 | 1 |
| 21–25 | 3 | ||
| 26–30 | 5 | ||
| 31–35 | 6 | ||
| 36–40 | 8 | ||
| >40 | 10 | ||
| Breaker type | Interrupting medium | SF6 - Live Tank | 1 |
| Minimum Oil | 3 | ||
| Bulk Oil | 5 | ||
| Other | 6 | ||
| SF6 - Dead Tank | 8 | ||
| Air Blast | 10 | ||
| Operation experience | Experienced operation problems | No failure or malfunction | 1 |
| Minor problems (i.e. leakage) | 6 | ||
| Failure caused by manufacturing problem | 10 | ||
| Breaking occurrence | Number of breaking operations | 0–1 | 1 |
| per year | 2–5 | 6 | |
| 6–10 | 10 | ||
| Switching occurrence | Number of switching operations | <50 | 1 |
| per year | 50–100 | 6 | |
| >100 | 10 | ||
| Driving mechanism | Mechanisms for opening and | Spring energy store | 1 |
| closing operation | Hydraulic-spring | 4 | |
| Hydraulic-N2 | 7 | ||
| Air | 10 | ||
| Maintenance | Months from last maintenance | <12 months | 1 |
| 13–18 months | 4 | ||
| 19–24 months | 7 | ||
| >24 months | 10 | ||
| Environment conditions | Air pollution, humidity, corrosion | No air pollution | 1 |
| and vibration | Moderate air pollution | 6 | |
| Heavy air pollution | 10 | ||
| Deviation of switching time | Deviation of switching time | <10% | 1 |
| (open/close) from setpoint | 10–20% | 6 | |
| >20% | 10 | ||
| Synchronism | Time difference of multi-phase | <2 ms | 1 |
| switching operations | 2–4 ms | 4 | |
| 5–7 ms | 7 | ||
| >7 ms | 10 | ||
| Deviation of contact travel | Deviation of contact travel from | No deviation | 1 |
| reference value | Minor deviation (within tolerable limits) | 6 | |
| Immediate action required | 10 | ||
| Gas/Oil analysis | Deviation from nominal value | Better than nominal value | 1 |
| Nominal value met | 6 | ||
| Exceeds tolerable limit | 10 | ||
| Operation time of driving motor | Operation time of driving motor | <10% | 1 |
| related to reference value | 10–20% | 4 | |
| 21–30% | 7 | ||
| >30% | 10 | ||
| Motor drive | Tolerance of wear and tear | OK | 1 |
| Tolerable wear and tear | 6 | ||
| Intolerable wear and tear (e.g. frequent | 10 | ||
| replacing of seals) | |||
| Control and auxiliary circuits | Insulation, labeling, and relay | OK | 1 |
| testing | Minor problems | 6 | |
| Missing labeling, weak insulation, failing relays | 10 | ||
| Arcing chamber | Flange corrosion, damaged | OK | 1 |
| porcelain and terminal hot spots, | Minor problems | 6 | |
| leaks | Flange corrosion, damaged porcelain, terminal | 10 | |
| hot spots, leaks | |||
| TABLE 14 | ||||||||||||||||
| SF1 | SF2 | SF3 | SF4 | SF5 | SF6 | SF7 | SF8 | SF9 | SF10 | SF11 | SF12 | SF13 | SF14 | SF15 | SF16 | |
| F1 | 0.5 | 0.5 | ||||||||||||||
| F2 | 0.2 | 0.2 | 0.1 | 0.1 | 0.1 | 0.1 | 0.1 | 0.1 | ||||||||
| F3 | 0.3 | 0.2 | 0.1 | 0.1 | 0.2 | 0.1 | ||||||||||
| F4 | 0.3 | 0.2 | 0.1 | 0.2 | 0.2 | |||||||||||
| F5 | 0.5 | 0.3 | 0.2 | |||||||||||||
| F6 | 0.2 | 0.2 | 0.1 | 0.2 | 0.3 | |||||||||||
| F7 | 0.5 | 0.3 | 0.2 | |||||||||||||
| F8 | 0.5 | 0.3 | 0.2 | |||||||||||||
| F9 | 0.3 | 0.2 | 0.5 | |||||||||||||
| F1 Bushing (Including CTs) | ||||||||||||||||
| F2 Operating Mechanisms | ||||||||||||||||
| F3 Interrupters | ||||||||||||||||
| F4 Insulation System (Support Insulators) | ||||||||||||||||
| F5 Resistors or Grounding Capacitors | ||||||||||||||||
| F6 Interrupting Medium | ||||||||||||||||
| F7 Auxiliary Equipment | ||||||||||||||||
| F8 Other | ||||||||||||||||
| F9 Control and Protection Equipment | ||||||||||||||||
| SF2 Breaker type | ||||||||||||||||
| SF3 Operation experience | ||||||||||||||||
| SF4 Breaking occurrence | ||||||||||||||||
| SF5 Switching occurrence | ||||||||||||||||
| SF6 Driving mechanism | ||||||||||||||||
| SF7 Maintenance | ||||||||||||||||
| SF8 Environment conditions | ||||||||||||||||
| SF9 Deviation of switching time | ||||||||||||||||
| SF10 Synchronism | ||||||||||||||||
| SF11 Deviation of contact travel | ||||||||||||||||
| SF12 Gas/oil analysis | ||||||||||||||||
| SF13 Operation time of driving motor | ||||||||||||||||
| SF14 Motor drive | ||||||||||||||||
| SF15 Control and auxiliary circuits | ||||||||||||||||
| SF16 Arcing chamber | ||||||||||||||||
| TABLE 15 | |||
| # of | Percentage | ||
| Primary Cause | Outages | Frequency (per mile, a) | (%) |
| TXU OMS Statistics |
| Equipment | 768 | 0.8649 | 27 |
| Foreign Object | 372 | 0.4189 | 13 |
| Human Error | 49 | 0.0552 | 2 |
| Lightning | 282 | 0.3176 | 10 |
| Other | 696 | 0.7838 | 24 |
| Tree Contact | 537 | 0.6047 | 19 |
| Unknown | 185 | 0.2083 | 6 |
| |
0 | 0.0000 | 0 |
| Total | 2889 | 3.2534 | 100 |
| Total Dist OHL miles | 296 | ||
| |
3 | ||
| Total mile- |
888 |
| SDG&E OMS Statistics |
| Equipment | 562 | 0.0513 | 26 |
| Foreign Object | 153 | 0.0140 | 7 |
| Human Error | 169 | 0.0154 | 8 |
| Lightning | 98 | 0.0090 | 5 |
| Other | 70 | 0.0064 | 3 |
| Tree Contact | 289 | 0.0264 | 13 |
| Unknown | 284 | 0.0259 | 13 |
| Weather | 544 | 0.0497 | 25 |
| Total | 2169 | 0.1981 | 100 |
| Total Dist OHL miles | 1564 | ||
| |
7 | ||
| Total mile-years | 10948 | ||
| TABLE 16 | |||
| Feature | Description | Assessment | Range |
| Age | In-service years | <21 | 1 |
| 21~25 | 3 | ||
| 26~30 | 5 | ||
| 31~35 | 6 | ||
| 36~40 | 8 | ||
| >40 | 10 | ||
| Animal population | Animal population relative to | Little | 1 |
| national/regional average | Below Normal | 3 | |
| Normal | 5 | ||
| Above Normal | 8 | ||
| Excessive | 10 | ||
| Animal guards | Installation of proper animal | None | 10 |
| guards | Some Sort of | 7 | |
| Standard | 4 | ||
| Extensive | 1 | ||
| OHL location | Metropolitan | 1 | |
| Suburb | 2 | ||
| Small Town | 3 | ||
| Rural Area | 4 | ||
| Wooden Area | 5 | ||
| OHL shielding | Not at all | 10 | |
| Partly | 8 | ||
| Moderately | 5 | ||
| Heavily | 3 | ||
| Fully | 1 | ||
| Lightning protection | Installation of surge arresters | None | 10 |
| Some Sort of | 8 | ||
| Standard | 5 | ||
| Good | 3 | ||
| Excellent | 1 | ||
| Tree density | Number of conflicting trees per | 0~5 | 1 |
| mile | 6~15 | 3 | |
| 15~30 | 5 | ||
| 31~50 | 8 | ||
| >50 | 10 | ||
| Tree trimming | Months from last tree trimming | <12 months | 1 |
| 12~24 months | 4 | ||
| 25~36 months | 7 | ||
| >36 months | 10 | ||
| Conductor size | Outer diameter in inches | >0.2 | 10 |
| 0.2~0.5 | 7 | ||
| 0.6~0.9 | 4 | ||
| >1.0 | 1 | ||
| Spacing of conductors | Conductor spacing to | No problems | 1 |
| withstand adverse wind- or ice- | Design standards met | 4 | |
| loading conditions | Inadequate (minor) | 7 | |
| Inadequate (significant) | 10 | ||
| Pole and structure | Strength and foundation | No problems | 1 |
| Design standards met | 4 | ||
| Inadequate (minor) | 7 | ||
| Inadequate (significant) | 10 | ||
| Barriers | Installation of barriers | None | 10 |
| Some Sort of | 7 | ||
| Standard | 4 | ||
| Extensive | 1 | ||
| Environment conditions | Air pollution, humidity, | No air pollution | 1 |
| corrosion and vibration | Moderate air pollution | 6 | |
| Heavy air pollution | 10 | ||
| O&M experience | System O&M staff working | Not good | 10 |
| experience | Good | 6 | |
| Excellent | 1 | ||
| TABLE 17 | ||||||||||||||
| SF1 | SF2 | SF3 | SF4 | SF5 | SF6 | SF7 | SF8 | SF9 | SF10 | SF11 | SF12 | SF13 | SF14 | |
| F1 | 0.5 | 0.2 | 0.3 | |||||||||||
| F2 | 0.3 | 0.4 | 0.3 | |||||||||||
| F3 | 0.2 | 0.3 | 0.5 | |||||||||||
| F4 | 0.4 | 0.4 | 0.2 | |||||||||||
| F5 | 0.5 | 0.5 | ||||||||||||
| F6 | 0.4 | 0.4 | 0.2 | |||||||||||
| F7 | 0.5 | 0.5 | ||||||||||||
| F8 | 0.2 | 0.3 | 0.5 | |||||||||||
| F1 Equipment | ||||||||||||||
| F2 Foreign Object | ||||||||||||||
| F3 Human Error | ||||||||||||||
| F4 Lightning | ||||||||||||||
| F5 Other | ||||||||||||||
| F6 Tree Contact | ||||||||||||||
| F7 Unknown | ||||||||||||||
| F8 Weather | ||||||||||||||
| SF1 Age | ||||||||||||||
| SF2 Animal population | ||||||||||||||
| SF3 Animal guards | ||||||||||||||
| SF4 OHL location | ||||||||||||||
| SF5 OHL shielding | ||||||||||||||
| SF6 Lightning protection | ||||||||||||||
| SF7 Tree density | ||||||||||||||
| SF8 Tree trimming | ||||||||||||||
| SF9 Conductor size | ||||||||||||||
| SF10 Spacing of conductors | ||||||||||||||
| SF11 Pole and structure | ||||||||||||||
| SF12 Barriers | ||||||||||||||
| SF13 Environment conditions | ||||||||||||||
| SF14 O&M experience | ||||||||||||||
N=N direct-hit +N induced Equation 15
N direct-hit =N d(1−S f)
where Sf is the shielding factor of the line (Sf is affected by nearby trees, buildings, relative altitude of the line, etc.), Nd is the flash collection rate of a line in open ground areas (no significant trees and buildings nearby). Nd may be given by:
where h is the pole height (m), b is the structure width (m), and Ng is the ground flash density (GFD) of lightning [flashes/km2/yr]. Ng may be calculated using the following two equations:
N g=0.04T d 1.25 Equation 18
or N g=0.054T h 1.1 Equation 19
where Td is the keraunic level (number of thunderstorm days per year) of the region (which may be obtained from the national weather center), Th is the number of thunderstorm hours per year (which may be obtained from national lightning detection network data for a particular region if enough years of data are available).
N direct-hit-flashover =N direct-hit *Pct(CFO, R i)
where Pct is the percentage of direct-hits caused flashovers. It is a function of the critical impulse flashover voltage (CFO) and the pole footing resistance (shielding wires are assumed to be grounded at every pole). A shield-wire modeling process may be used to obtain Pct(CFO, Ri), which may be simplified using the following logistic function:
where a and Rio are functions of CFO. Illustrative Pct function are given in
N induced =GFD*ƒ(CFO,LineType)
where LineType is “Ungrounded line” or “Line with a grounded neutral or shield wire”. A curve set in IEEE Std 1410-1997 represents the function in
where A is a constant for each type of line. For “Ungrounded line,” A(LineType)=320; for “Line with a grounded neutral or shield wire,” A(LineType)=250.
Outage_Distributioncalculated=Outage_DistributionHistorical Equation 24
The SAIFI contribution adjustment may be calculated according to Equation 25:
SAIFI_Contributioncalculated=SAIFI_ContributionHistorical Equation 25
Claims (20)
Priority Applications (1)
| Application Number | Priority Date | Filing Date | Title |
|---|---|---|---|
| US10/745,122 US7272516B2 (en) | 2002-12-23 | 2003-12-23 | Failure rate adjustment for electric power network reliability analysis |
Applications Claiming Priority (2)
| Application Number | Priority Date | Filing Date | Title |
|---|---|---|---|
| US43630802P | 2002-12-23 | 2002-12-23 | |
| US10/745,122 US7272516B2 (en) | 2002-12-23 | 2003-12-23 | Failure rate adjustment for electric power network reliability analysis |
Publications (2)
| Publication Number | Publication Date |
|---|---|
| US20040167731A1 US20040167731A1 (en) | 2004-08-26 |
| US7272516B2 true US7272516B2 (en) | 2007-09-18 |
Family
ID=32871844
Family Applications (1)
| Application Number | Title | Priority Date | Filing Date |
|---|---|---|---|
| US10/745,122 Expired - Lifetime US7272516B2 (en) | 2002-12-23 | 2003-12-23 | Failure rate adjustment for electric power network reliability analysis |
Country Status (1)
| Country | Link |
|---|---|
| US (1) | US7272516B2 (en) |
Cited By (33)
| Publication number | Priority date | Publication date | Assignee | Title |
|---|---|---|---|---|
| US20060041405A1 (en) * | 2004-06-22 | 2006-02-23 | Dingguo Chen | System and method for controlling the performance of a power generating system |
| US20070225845A1 (en) * | 2006-03-21 | 2007-09-27 | Hurley Robert P Iii | Achieving perceived reliability for repairable systems |
| US20080195895A1 (en) * | 2006-03-23 | 2008-08-14 | Fujitsu Siemens Computers Gmbh | Method and Management System for Configuring an Information System |
| US20080319923A1 (en) * | 2007-06-21 | 2008-12-25 | Copperleaf Technologies Inc | Investment Analysis and Planning System and Method |
| US20090144115A1 (en) * | 2007-12-04 | 2009-06-04 | Verizon Services Organization, Inc. | System and method for providing facilities management based on weather vulnerability |
| US20090271141A1 (en) * | 2008-04-25 | 2009-10-29 | Sun Microsystems, Inc. | Workload scheduling in multi-core processors |
| US20090281679A1 (en) * | 2008-05-09 | 2009-11-12 | Taft Jeffrey D | Intelligent monitoring of an electrical utility grid |
| US20120041688A1 (en) * | 2009-05-06 | 2012-02-16 | Rainer Frotscher | Method for gas analysis of on-load tap changers |
| US20130006439A1 (en) * | 2009-12-31 | 2013-01-03 | Abb Research Ltd | Method and control system for scheduling load of a power plant |
| CN103336879A (en) * | 2013-03-13 | 2013-10-02 | 云南电力试验研究院(集团)有限公司电力研究院 | Short-term reliability evaluation method of high-voltage breaker |
| US8576082B2 (en) | 2010-07-15 | 2013-11-05 | Jones Group Forensic Engineers | Busway joint parameter detection system |
| CN104143158A (en) * | 2013-05-31 | 2014-11-12 | 贵州电网公司电力调度控制中心 | Method for monitoring reliability of power system element under condition of multiple meteorological factors |
| US9064087B2 (en) * | 2013-06-20 | 2015-06-23 | International Business Machines Corporation | Semiconductor device reliability model and methodologies for use thereof |
| US9182429B2 (en) | 2012-01-04 | 2015-11-10 | Sentient Energy, Inc. | Distribution line clamp force using DC bias on coil |
| CN105184487A (en) * | 2015-09-08 | 2015-12-23 | 国家电网公司 | Power grid distribution reliability basic data automatic generation system |
| US9229036B2 (en) | 2012-01-03 | 2016-01-05 | Sentient Energy, Inc. | Energy harvest split core design elements for ease of installation, high performance, and long term reliability |
| CN102968556B (en) * | 2012-11-08 | 2016-03-09 | 重庆大学 | A kind of Distribution Network Reliability determination methods based on probability distribution |
| CN105956727A (en) * | 2016-04-11 | 2016-09-21 | 重庆大学 | Failure rate calculation method of improved electric power device |
| US20170212157A1 (en) * | 2016-01-22 | 2017-07-27 | Aerinet Solutions, L.L.C. | Real-Time Outage Analytics And Reliability Benchmarking System |
| CN107272642A (en) * | 2017-06-18 | 2017-10-20 | 丹凤县鑫伟电子有限公司 | A kind of transformer check and evaluation device and appraisal procedure |
| CN107292502A (en) * | 2017-06-13 | 2017-10-24 | 南京软核科技有限公司 | A kind of distribution network reliability evaluation method |
| CN107633320A (en) * | 2017-08-17 | 2018-01-26 | 广东电网有限责任公司惠州供电局 | A kind of power network line importance appraisal procedure based on weather prognosis and risk assessment |
| CN107909253A (en) * | 2017-11-02 | 2018-04-13 | 国网天津市电力公司电力科学研究院 | Intelligent distribution network scheduling controlling effect evaluation method based on interval based AHP |
| US9954354B2 (en) | 2015-01-06 | 2018-04-24 | Sentient Energy, Inc. | Methods and apparatus for mitigation of damage of power line assets from traveling electrical arcs |
| US9984818B2 (en) | 2015-12-04 | 2018-05-29 | Sentient Energy, Inc. | Current harvesting transformer with protection from high currents |
| US10634733B2 (en) | 2016-11-18 | 2020-04-28 | Sentient Energy, Inc. | Overhead power line sensor |
| EP3770617A1 (en) | 2019-07-26 | 2021-01-27 | Maschinenfabrik Reinhausen GmbH | Method and system for monitoring at least one inductive operating equipment |
| US11041915B2 (en) | 2018-09-18 | 2021-06-22 | Sentient Technology Holdings, LLC | Disturbance detecting current sensor |
| US11125832B2 (en) | 2018-12-13 | 2021-09-21 | Sentient Technology Holdings, LLC | Multi-phase simulation environment |
| US11233395B2 (en) * | 2017-07-13 | 2022-01-25 | State Grid Jiangsu Electric Power Co., Ltd Suzhou | Dynamic thunder and lightning protection method and system |
| US11294097B1 (en) * | 2021-01-29 | 2022-04-05 | State Grid Jiangsu Electric Power Co., Ltd. Suzhou Branch | Lightning prewarning-based method for active protection against lightning strike on important transmission channel |
| US11476674B2 (en) | 2018-09-18 | 2022-10-18 | Sentient Technology Holdings, LLC | Systems and methods to maximize power from multiple power line energy harvesting devices |
| US11609590B2 (en) | 2019-02-04 | 2023-03-21 | Sentient Technology Holdings, LLC | Power supply for electric utility underground equipment |
Families Citing this family (69)
| Publication number | Priority date | Publication date | Assignee | Title |
|---|---|---|---|---|
| US20050256682A1 (en) * | 2004-05-11 | 2005-11-17 | Galutia Barry C | Method of evaluation of space systems for safety assurance and residual risk to flightcrew |
| US8369230B1 (en) * | 2004-12-22 | 2013-02-05 | At&T Intellectual Property Ii, L.P. | Method and apparatus for determining a direct measure of quality in a packet-switched network |
| US20080184176A1 (en) * | 2007-01-26 | 2008-07-31 | Satoru Takase | Systems and Methods for Determining Electrical Characteristics of a Power Distribution Network Using a One-Dimensional Model |
| US8682623B1 (en) | 2007-04-24 | 2014-03-25 | University Of South Florida | Electric power distribution interruption risk assessment calculator |
| US7920997B2 (en) * | 2007-04-24 | 2011-04-05 | University Of South Florida | Electric power distribution interruption risk assessment calculator |
| US8949671B2 (en) * | 2008-01-30 | 2015-02-03 | International Business Machines Corporation | Fault detection, diagnosis, and prevention for complex computing systems |
| DE102008051653A1 (en) * | 2008-02-12 | 2009-08-20 | Abb Technology Ag | Method and system for determining an individual error rate for the assessment of an individual complex technical equipment |
| US8744638B2 (en) * | 2009-09-11 | 2014-06-03 | General Electric Company | Method and system for demand response in a distribution network |
| US8707091B2 (en) * | 2010-03-15 | 2014-04-22 | Cleversafe, Inc. | Failsafe directory file system in a dispersed storage network |
| JP5615385B2 (en) * | 2011-02-02 | 2014-10-29 | 三菱電機株式会社 | Operating time prediction device for power switchgear |
| CN102222907B (en) * | 2011-06-09 | 2013-06-05 | 重庆大学 | Distribution network reliability evaluation method applicable to multi-circuit identical-pole line construction |
| CN102255307B (en) * | 2011-06-09 | 2013-04-17 | 重庆大学 | Layering equivalence method for reliability estimation of distribution network |
| CN102255335B (en) * | 2011-07-25 | 2013-10-09 | 华北电力大学 | Grid-connected inverter PWM (Pulse Width Modulation) control method based on measured voltage modulation |
| US9419430B1 (en) * | 2011-08-04 | 2016-08-16 | Dynamic Ratings Pty Ltd | System for monitoring and modeling operation of a transformer |
| US10382285B2 (en) * | 2011-08-25 | 2019-08-13 | Siemens Industry, Inc. | Smart grid communication assessment and co-simulation tool |
| CN102981119B (en) * | 2012-08-10 | 2014-12-24 | 南车南京浦镇车辆有限公司 | Method for predicting railway vehicle relay work failure rate |
| US8689168B1 (en) * | 2012-09-28 | 2014-04-01 | Texas Instruments Incorporated | Reliability determination taking into account effect of component failures on circuit operation |
| US9160447B1 (en) * | 2013-03-14 | 2015-10-13 | CSC Holdings, LLC | Detection of impairments in a network system |
| CN103593707A (en) * | 2013-11-27 | 2014-02-19 | 国家电网公司 | Method and device for evaluating reliability of power distribution network |
| CN104700317A (en) * | 2013-12-05 | 2015-06-10 | 国家电网公司 | Assessment method and device of grid partition power supply mode |
| CN104715302A (en) * | 2013-12-11 | 2015-06-17 | 国家电网公司 | Electricity using information collecting training system |
| CN104732446A (en) * | 2013-12-23 | 2015-06-24 | 国家电网公司 | Data processing method and device for distribution automation running |
| US9473347B2 (en) * | 2014-01-06 | 2016-10-18 | International Business Machines Corporation | Optimizing application availability |
| CN104933625A (en) * | 2014-03-19 | 2015-09-23 | 中国石化工程建设有限公司 | System and method for petrochemical production device pipeline information automatic collection and generation |
| CN103971182B (en) * | 2014-05-26 | 2016-02-03 | 广东电网有限责任公司佛山供电局 | The online risk monitoring method of a kind of distribution feeder |
| CN104268792A (en) * | 2014-09-01 | 2015-01-07 | 国家电网公司 | Comprehensive energy efficiency evaluation model for high-energy-bearing electricity consumption enterprise |
| CN104766238A (en) * | 2014-10-23 | 2015-07-08 | 国家电网公司 | Price and tax computation engine system based on neurons and cloud deployment and method thereof |
| CN104361451A (en) * | 2014-11-15 | 2015-02-18 | 国网河南省电力公司开封供电公司 | Power distribution network control method based on mass data |
| CN104834963B (en) * | 2014-11-26 | 2018-10-26 | 国家电网公司 | Based on the distributing wind-electricity integration Optimal Configuration Method for improving ant colony algorithm |
| CN104715318A (en) * | 2014-12-04 | 2015-06-17 | 国家电网公司 | Multi-dimensional operational risk evaluating method for communication network |
| CN104657583B (en) * | 2014-12-10 | 2019-03-26 | 清华大学 | The multibreak face dynamic reliability appraisal procedure of regional power grid for black starting-up |
| CN104574211B (en) * | 2015-01-09 | 2017-12-22 | 广东电网有限责任公司电力调度控制中心 | Forming Electrical Dispatching Command Tickets method for prewarning risk and system based on risk source |
| CN104766246A (en) * | 2015-03-20 | 2015-07-08 | 国家电网公司 | Power system fault diagnosis method based on timing order fuzzy Petri net |
| CN104700324A (en) * | 2015-03-27 | 2015-06-10 | 国家电网公司 | Multifunctional application demonstration system of transformation operation maintenance station |
| CN104700326A (en) * | 2015-03-30 | 2015-06-10 | 国家电网公司 | Power distribution network risk assessment method |
| CN104732295A (en) * | 2015-03-31 | 2015-06-24 | 国家电网公司 | Power load predicating model based on big data technology |
| CN104794544A (en) * | 2015-04-24 | 2015-07-22 | 国家电网公司 | Intelligent algorithm based electricity-larceny-preventive monitoring method for distributed type photovoltaic power generation |
| CN104881709A (en) * | 2015-05-12 | 2015-09-02 | 国家电网公司 | Comprehensive configuration algorithm for optimizing short-circuit current-limiting reactance in electric system |
| CN104778565A (en) * | 2015-05-12 | 2015-07-15 | 国家电网公司 | Power distribution network frame graphic maintenance method and system |
| CN104866978B (en) * | 2015-06-03 | 2019-01-15 | 华北电力大学 | A method of based on time domain quantitative analysis intermittent energy source synergistic effect |
| CN105046575A (en) * | 2015-06-09 | 2015-11-11 | 国家电网公司 | Evaluation method for determining power network equipment utilization rate evaluation indexes |
| CN104915892B (en) * | 2015-06-12 | 2018-12-18 | 华北电力大学 | Electric system stochastic Time-Delay method for analyzing stability |
| CN104899666A (en) * | 2015-06-26 | 2015-09-09 | 国家电网公司 | Method for optimizing monitor indexes of enterprise operation analysis early warning system |
| CN105046355A (en) * | 2015-07-13 | 2015-11-11 | 国家电网公司 | System energy consumption modeling method based on improved mind evolutionary algorithm |
| CN105046444B (en) * | 2015-08-12 | 2019-04-12 | 国家电网公司 | Electric system is in the active and standby dual system of line computation and its switching method |
| CN105046374B (en) * | 2015-08-25 | 2019-04-02 | 华北电力大学 | A kind of power interval prediction technique based on core extreme learning machine model |
| US10346237B1 (en) * | 2015-08-28 | 2019-07-09 | EMC IP Holding Company LLC | System and method to predict reliability of backup software |
| CN105207211B (en) * | 2015-10-20 | 2017-08-01 | 河海大学 | A kind of wind stores up hybrid power system adequacy evaluation method |
| CN105761161A (en) * | 2015-12-21 | 2016-07-13 | 国家电网公司 | AC and DC power distribution network power supply mode evaluation method |
| CN106503908B (en) * | 2016-10-26 | 2020-04-17 | 南方电网科学研究院有限责任公司 | Method for evaluating operation quality of power transformation equipment |
| CN106651140B (en) * | 2016-11-16 | 2020-10-30 | 海南电力技术研究院 | Module difference evaluation method and device for power transmission line risk in typhoon area |
| CN107085653A (en) * | 2017-03-29 | 2017-08-22 | 国网上海市电力公司 | A kind of anti-electricity-theft real-time diagnosis method of data-driven |
| CN107103415B (en) * | 2017-04-17 | 2018-06-26 | 中国南方电网有限责任公司 | Power distribution network resource allocation method and system |
| DE102017110620A1 (en) * | 2017-05-16 | 2018-11-22 | Technische Universität Dortmund | Fault diagnosis in an electrical network |
| CN107341591B (en) * | 2017-06-15 | 2020-06-05 | 国网浙江省电力公司嘉兴供电公司 | Intelligent statistical analysis system and method for substation warning information |
| CN107292116B (en) * | 2017-07-12 | 2020-04-28 | 广东工业大学 | Power supply reliability assessment method for one-supply one-standby power distribution network in three-state space |
| US10426424B2 (en) | 2017-11-21 | 2019-10-01 | General Electric Company | System and method for generating and performing imaging protocol simulations |
| CN108428017B (en) * | 2018-04-23 | 2021-10-19 | 华北电力大学 | Wind power interval prediction method based on nuclear extreme learning machine quantile regression |
| CN109242239A (en) * | 2018-07-23 | 2019-01-18 | 中国电力科学研究院有限公司 | A kind of alternating current-direct current mixing network operation risk assessment method and device |
| CN111598339B (en) * | 2020-05-18 | 2023-08-04 | 华北电力大学 | Decision method for optimal power supply of AC/DC hybrid power distribution network connected with new energy |
| CN112348207A (en) * | 2020-09-30 | 2021-02-09 | 云南电网有限责任公司西双版纳供电局 | Power grid disaster prevention early warning method and device |
| CN113312722B (en) * | 2021-05-28 | 2023-05-05 | 广西大学 | Reliability prediction optimization method for key parts of urban rail train |
| CN113588452B (en) * | 2021-07-30 | 2023-10-27 | 国网青海省电力公司信息通信公司 | Cable life prediction method and device, processor and storage medium |
| CN113626963B (en) * | 2021-08-12 | 2022-05-27 | 四川大学 | Multi-level comprehensive evaluation method for reliability of energy storage grid-connected system |
| CN114091296A (en) * | 2021-10-29 | 2022-02-25 | 国网冀北电力有限公司电力科学研究院 | Fault early warning method and device for high-voltage direct-current circuit breaker |
| CN115907291B (en) * | 2022-11-11 | 2024-04-05 | 国网安徽省电力有限公司合肥供电公司 | Relay protection constant value performance evaluation method for active power distribution network |
| CN115994715B (en) * | 2023-03-22 | 2023-05-26 | 普华讯光(北京)科技有限公司 | Power distribution network reliability analysis and evaluation method, system and device |
| CN116628550B (en) * | 2023-05-23 | 2024-03-12 | 上海发电设备成套设计研究院有限责任公司 | Reliability high-precision prediction method for in-service nuclear power unit and nuclear power turbine |
| CN116775567A (en) * | 2023-08-25 | 2023-09-19 | 北京华电电子商务科技有限公司 | Safety operation and maintenance data analysis method based on multidimensional data |
Citations (9)
| Publication number | Priority date | Publication date | Assignee | Title |
|---|---|---|---|---|
| US5107497A (en) | 1989-07-28 | 1992-04-21 | At&T Bell Laboratories | Technique for producing an expert system for system fault diagnosis |
| US5699403A (en) | 1995-04-12 | 1997-12-16 | Lucent Technologies Inc. | Network vulnerability management apparatus and method |
| US5798939A (en) | 1995-03-31 | 1998-08-25 | Abb Power T&D Company, Inc. | System for optimizing power network design reliability |
| US6041287A (en) | 1996-11-07 | 2000-03-21 | Reliance Electric Industrial Company | System architecture for on-line machine diagnostics |
| US6167352A (en) | 1997-06-26 | 2000-12-26 | Agilent Technologies, Inc. | Model-based diagnostic system with automated procedures for next test selection |
| US6321187B1 (en) * | 1998-12-22 | 2001-11-20 | Hamilton Sundstrand Corporation | System reliability assessment tool |
| US6330935B1 (en) | 1998-01-09 | 2001-12-18 | Kone Corporation | Maintenance method for an elevator installation and elevator installation |
| US20020078403A1 (en) * | 2000-01-18 | 2002-06-20 | Gullo Louis J. | Reliability assessment and prediction system and method for implementing the same |
| US6671634B2 (en) * | 2000-12-27 | 2003-12-30 | Abb Research Ltd. | System and method for reliability assessment of a power system having integrated modules |
-
2003
- 2003-12-23 US US10/745,122 patent/US7272516B2/en not_active Expired - Lifetime
Patent Citations (9)
| Publication number | Priority date | Publication date | Assignee | Title |
|---|---|---|---|---|
| US5107497A (en) | 1989-07-28 | 1992-04-21 | At&T Bell Laboratories | Technique for producing an expert system for system fault diagnosis |
| US5798939A (en) | 1995-03-31 | 1998-08-25 | Abb Power T&D Company, Inc. | System for optimizing power network design reliability |
| US5699403A (en) | 1995-04-12 | 1997-12-16 | Lucent Technologies Inc. | Network vulnerability management apparatus and method |
| US6041287A (en) | 1996-11-07 | 2000-03-21 | Reliance Electric Industrial Company | System architecture for on-line machine diagnostics |
| US6167352A (en) | 1997-06-26 | 2000-12-26 | Agilent Technologies, Inc. | Model-based diagnostic system with automated procedures for next test selection |
| US6330935B1 (en) | 1998-01-09 | 2001-12-18 | Kone Corporation | Maintenance method for an elevator installation and elevator installation |
| US6321187B1 (en) * | 1998-12-22 | 2001-11-20 | Hamilton Sundstrand Corporation | System reliability assessment tool |
| US20020078403A1 (en) * | 2000-01-18 | 2002-06-20 | Gullo Louis J. | Reliability assessment and prediction system and method for implementing the same |
| US6671634B2 (en) * | 2000-12-27 | 2003-12-30 | Abb Research Ltd. | System and method for reliability assessment of a power system having integrated modules |
Non-Patent Citations (33)
| Title |
|---|
| "Electric Power Industry Applications of Lightning Data", Global Atmospherics Lightning Detection, http://www.glatmos.com/industries.article1.html, Sep. 17, 2001, 7 pages. |
| "IEEE Guide for Failure Investigation, Documentation and Analysis for Power Transformers and Shunt Reactors", IEEE Standards Board, 1992, C57, 125-1991. |
| "Working Group Report: Calculating the Lightning Performance of Distribution Lines", IEEE Transactions on Power Delivery, 1990, 5(3), 1408-1417. |
| Beshir, M.J. et al., "Comparison of Monte Carlo Simulation and State Enumeration Based Adequacy Assessment Programs: Cream and Comrel", IEEE, 1996, 438-444. |
| Brown, R.E., "Modeling the Impact of Substations on Distribution Reliabilty", IEEE Transactions on Power Systems, Feb. 1999, 14(2), 349-354. |
| Brown, R.E., "Probabilistic Reliability and Risk Assessment of Electric Power Distribution Systems", DistribuTECH Conference, San Diego, Ca, Feb. 2001. |
| Canadian Electricity Association 2000 Annual Service Continuity Report on Distribution System Performance in Electrical Utilities, May 2001, 1-78. |
| Canadian Electricity Association, Forced Outage Performance of Transmission Equipment- for the period Jan. 1, 1994 to Dec. 31, 1998, Feb. 2000, 1-142. |
| Carvalho, A. et al., "Functional Specification as Driver for Technical/Economical Optimisation of Substation", Presentation at CIGRE Session, Paris, France, 2000, 1-10. |
| Chow, M. et al., "Analysis and Prevention of Animal-Caused Faults in Power Distribution System", IEEE Transactions On Power Delivery, 1995, 10(2), 995-1001. |
| Cizelj, R.J., et al., "Component Reliability Assessment Using Quantitative and Qualitative Data", Reliability Engineering and System Safety, 2001, 71, 81-95. |
| Densley, J., "Ageing Mechanisms and Diagnostics for Power Cables- An Overview", IEEE Electrical Insulation Magazine, Jan./Feb. 2001, 17(1), 14-22. |
| Frazier, S.D., "Suggested Practices for Reducing Animal-Caused Outages", IEEE Industry Application Magazine, Jul./Aug. 1996, 25-31. |
| Frimpong, G.K., "Facilities Assessment Management Engineering(An Overview)", ABB Internal Report, Jun. 9, 2000, 19 pages. |
| Gupta, S., et al., "Predicting the Failure Rates of Overheard Distribution Lines Using an Adaptive-Fuzzy Technique", 2001, 1-5. |
| Horton, W.F., et al., "Determination of Failure Rates of Underground Distribution System Components from Historical Data", IEEE, 1991, 718-723. |
| Horton, W.F., et al., "The failure rates of overhead distribution system components", IEEE, 1991, 713-717. |
| IEEE Guide for Improving the Lighting Performance of Electric Power Overhead Distribution Lines, 1410-1997, Approved Jun. 26, 1997, 44 pages. |
| IEEE Recommended Practice for the Design of Reliable Industrial and Commercial Power Systems (Gold Book), IEEE Std 493-1997, Approved Dec. 16, 1997, 502 pages. |
| Kuntz, P.A., "Optimal reliability centered vegetation maintenance scheduling in electric power distribution system", Ph.D. Thesis of UOW, 1999. |
| Lang, B.P., "Power Distribution System Reliability Planning Using a Fuzzy Knowledge-Based Approach", IEEE Trans, on Power Delivery, Jan. 2000, 15(1), 279-284. |
| Marsden, H. et al., "Cable Diagnostics Business Technology Evaluation", ABB ETI Technical Report, # BDC-R-01002, Jan. 2001, 1-66. |
| McDermott, T.E. et al., "Lightning Protection of Distribution Lines", IEEE Transactions on Power Delivery, Jan. 1994, 9(1), 138-152 (Previously submitted as Reference #10 in IDS dated Nov. 3, 2004). |
| Morrison, W.G., "Using New Technology to Improve Reliability of an Industrial Cable Distribution System", IEEE Trans. On Industry Applications, Mar./Apr. 1992, 28(2), 275-281. |
| Pultrum, E. et al., "Dutch Distribution Cable Performance", IEEE Colloquium on "MV Paper Cables: Asset or Liability"? Capenhurst , Apr. 21, 1998, 3/1 thru 3/6. |
| Radmer, D.T., "Predicting Vegetation-Related Failure Rates in Electric Power Distribution System", Master Thesis of UOW, 1999, 61 pages. |
| Short, T.A., "Lightning Protection of Overhead Distribution Lines", http://www.pti-us.com/pti/consult/lightning protection of overhead.htm, Sep. 14, 2001, 9 page. |
| Short, T.A., "Monitoring Results of the Effectiveness of Surge Arrester Spacings on Distribution Line Protection", http://www.pti-us.com/pti/consult/lico.htm, Sep. 14, 2001, 12 pages. |
| Stember, L.H., et al., "Analysis of Filed Failure Data on HMWPE and XLPE Insulated High-Voltage Distribution Cable", IEEE Trans on Power Apparatus, 1985, vol. PAS-104(8), 1979-1985. |
| Tolbert, L.M., et al., "Reliability of Lightning Resistant Overhead Distribution Lines", IEEE I & CPS, May 1999, 147-152. |
| Van Casteren, J.F.L. et al., "Reliability Assessment in Electrical Power Systems: The Weibull-Markov Stochastic Model", IEEE Transactions on Industry Applications, May/Jun. 2000, 36(3), 911-915. |
| Volkmann, C.A. et al., "A Probabilistic Approach to Distribution System Reliability Assessment", Third International Conference on Probabilistic Methods Applied to Electric Power Systems, Jul. 3-5, 1991, 169-173 (Previously submitted as Reference # 13 in IDS dated Nov. 3, 2004). |
| Wang, Z., "Artificial Intelligence Applications in the Diagnosis of Power Transformer Incipient Faults", Virginia Tech, Ph.D., dissertation, Aug. 2000, 1-105. |
Cited By (54)
| Publication number | Priority date | Publication date | Assignee | Title |
|---|---|---|---|---|
| US8019485B2 (en) * | 2004-06-22 | 2011-09-13 | Siemens Energy, Inc. | System and method for controlling the performance of a power generating system |
| US20060041405A1 (en) * | 2004-06-22 | 2006-02-23 | Dingguo Chen | System and method for controlling the performance of a power generating system |
| US20070225845A1 (en) * | 2006-03-21 | 2007-09-27 | Hurley Robert P Iii | Achieving perceived reliability for repairable systems |
| US7376478B2 (en) * | 2006-03-21 | 2008-05-20 | Siemens Medical Solutions Usa, Inc. | Achieving perceived reliability for repairable systems |
| US7975185B2 (en) * | 2006-03-23 | 2011-07-05 | Fujitsu Siemens Computers Gmbh | Method and management system for configuring an information system |
| US20080195895A1 (en) * | 2006-03-23 | 2008-08-14 | Fujitsu Siemens Computers Gmbh | Method and Management System for Configuring an Information System |
| US20080319923A1 (en) * | 2007-06-21 | 2008-12-25 | Copperleaf Technologies Inc | Investment Analysis and Planning System and Method |
| US20090144115A1 (en) * | 2007-12-04 | 2009-06-04 | Verizon Services Organization, Inc. | System and method for providing facilities management based on weather vulnerability |
| US9104988B2 (en) * | 2007-12-04 | 2015-08-11 | Verizon Patent And Licensing Inc. | System and method for providing facilities management based on weather vulnerability |
| US20090271141A1 (en) * | 2008-04-25 | 2009-10-29 | Sun Microsystems, Inc. | Workload scheduling in multi-core processors |
| US7716006B2 (en) * | 2008-04-25 | 2010-05-11 | Oracle America, Inc. | Workload scheduling in multi-core processors |
| US20090281679A1 (en) * | 2008-05-09 | 2009-11-12 | Taft Jeffrey D | Intelligent monitoring of an electrical utility grid |
| US8121741B2 (en) * | 2008-05-09 | 2012-02-21 | International Business Machines Corporation | Intelligent monitoring of an electrical utility grid |
| US8738301B2 (en) * | 2009-05-06 | 2014-05-27 | Maschinenfabrik Reinhausen Gmbh | Method for gas analysis of on-load tap changers |
| US20120041688A1 (en) * | 2009-05-06 | 2012-02-16 | Rainer Frotscher | Method for gas analysis of on-load tap changers |
| US10013660B2 (en) * | 2009-12-31 | 2018-07-03 | Abb Research Ltd | Method and control system for scheduling load of a power plant |
| US20130006439A1 (en) * | 2009-12-31 | 2013-01-03 | Abb Research Ltd | Method and control system for scheduling load of a power plant |
| US8576082B2 (en) | 2010-07-15 | 2013-11-05 | Jones Group Forensic Engineers | Busway joint parameter detection system |
| US11789042B2 (en) | 2012-01-03 | 2023-10-17 | Sentient Technology Holdings, LLC | Energy harvest split core design elements for ease of installation, high performance, and long term reliability |
| US10901008B2 (en) | 2012-01-03 | 2021-01-26 | Sentient Technology Holdings, LLC | Energy harvest split core design elements for ease of installation, high performance, and long term reliability |
| US9229036B2 (en) | 2012-01-03 | 2016-01-05 | Sentient Energy, Inc. | Energy harvest split core design elements for ease of installation, high performance, and long term reliability |
| US9182429B2 (en) | 2012-01-04 | 2015-11-10 | Sentient Energy, Inc. | Distribution line clamp force using DC bias on coil |
| US9448257B2 (en) | 2012-01-04 | 2016-09-20 | Sentient Energy, Inc. | Distribution line clamp force using DC bias on coil |
| CN102968556B (en) * | 2012-11-08 | 2016-03-09 | 重庆大学 | A kind of Distribution Network Reliability determination methods based on probability distribution |
| CN103336879A (en) * | 2013-03-13 | 2013-10-02 | 云南电力试验研究院(集团)有限公司电力研究院 | Short-term reliability evaluation method of high-voltage breaker |
| CN104143158A (en) * | 2013-05-31 | 2014-11-12 | 贵州电网公司电力调度控制中心 | Method for monitoring reliability of power system element under condition of multiple meteorological factors |
| US9064087B2 (en) * | 2013-06-20 | 2015-06-23 | International Business Machines Corporation | Semiconductor device reliability model and methodologies for use thereof |
| US9954354B2 (en) | 2015-01-06 | 2018-04-24 | Sentient Energy, Inc. | Methods and apparatus for mitigation of damage of power line assets from traveling electrical arcs |
| CN105184487A (en) * | 2015-09-08 | 2015-12-23 | 国家电网公司 | Power grid distribution reliability basic data automatic generation system |
| US9984818B2 (en) | 2015-12-04 | 2018-05-29 | Sentient Energy, Inc. | Current harvesting transformer with protection from high currents |
| US20170212157A1 (en) * | 2016-01-22 | 2017-07-27 | Aerinet Solutions, L.L.C. | Real-Time Outage Analytics And Reliability Benchmarking System |
| US11204970B2 (en) | 2016-01-22 | 2021-12-21 | Aerinet Solutions, L.L.C. | Real-time outage analytics and reliability benchmarking system |
| US10592564B2 (en) * | 2016-01-22 | 2020-03-17 | Aerinet Solutions, L.L.C. | Real-time outage analytics and reliability benchmarking system |
| CN105956727A (en) * | 2016-04-11 | 2016-09-21 | 重庆大学 | Failure rate calculation method of improved electric power device |
| US10634733B2 (en) | 2016-11-18 | 2020-04-28 | Sentient Energy, Inc. | Overhead power line sensor |
| US11442114B2 (en) | 2016-11-18 | 2022-09-13 | Sentient Technology Holdings, LLC | Overhead power line sensor |
| CN107292502A (en) * | 2017-06-13 | 2017-10-24 | 南京软核科技有限公司 | A kind of distribution network reliability evaluation method |
| CN107292502B (en) * | 2017-06-13 | 2020-05-19 | 南京软核科技有限公司 | Power distribution network reliability assessment method |
| CN107272642A (en) * | 2017-06-18 | 2017-10-20 | 丹凤县鑫伟电子有限公司 | A kind of transformer check and evaluation device and appraisal procedure |
| CN107272642B (en) * | 2017-06-18 | 2019-09-27 | 汉中大成电子科技有限公司 | A kind of transformer check and evaluation device and appraisal procedure |
| US11233395B2 (en) * | 2017-07-13 | 2022-01-25 | State Grid Jiangsu Electric Power Co., Ltd Suzhou | Dynamic thunder and lightning protection method and system |
| CN107633320A (en) * | 2017-08-17 | 2018-01-26 | 广东电网有限责任公司惠州供电局 | A kind of power network line importance appraisal procedure based on weather prognosis and risk assessment |
| CN107909253B (en) * | 2017-11-02 | 2020-09-04 | 国网天津市电力公司电力科学研究院 | Intelligent power distribution network scheduling control effect evaluation method based on inter-zone analytic method |
| CN107909253A (en) * | 2017-11-02 | 2018-04-13 | 国网天津市电力公司电力科学研究院 | Intelligent distribution network scheduling controlling effect evaluation method based on interval based AHP |
| US11041915B2 (en) | 2018-09-18 | 2021-06-22 | Sentient Technology Holdings, LLC | Disturbance detecting current sensor |
| US11476674B2 (en) | 2018-09-18 | 2022-10-18 | Sentient Technology Holdings, LLC | Systems and methods to maximize power from multiple power line energy harvesting devices |
| US11125832B2 (en) | 2018-12-13 | 2021-09-21 | Sentient Technology Holdings, LLC | Multi-phase simulation environment |
| US11549997B2 (en) | 2018-12-13 | 2023-01-10 | Sentient Technology Holdings, LLC | Multi-phase simulation environment |
| US11835593B2 (en) | 2018-12-13 | 2023-12-05 | Sentient Technology Holdings, LLC | Multi-phase simulation environment |
| US11609590B2 (en) | 2019-02-04 | 2023-03-21 | Sentient Technology Holdings, LLC | Power supply for electric utility underground equipment |
| US11947374B2 (en) | 2019-02-04 | 2024-04-02 | Sentient Technology Holdings, LLC | Power supply for electric utility underground equipment |
| WO2021018478A1 (en) | 2019-07-26 | 2021-02-04 | Maschinenfabrik Reinhausen Gmbh | Method and system for monitoring at least one inductive operating means |
| EP3770617A1 (en) | 2019-07-26 | 2021-01-27 | Maschinenfabrik Reinhausen GmbH | Method and system for monitoring at least one inductive operating equipment |
| US11294097B1 (en) * | 2021-01-29 | 2022-04-05 | State Grid Jiangsu Electric Power Co., Ltd. Suzhou Branch | Lightning prewarning-based method for active protection against lightning strike on important transmission channel |
Also Published As
| Publication number | Publication date |
|---|---|
| US20040167731A1 (en) | 2004-08-26 |
Similar Documents
| Publication | Publication Date | Title |
|---|---|---|
| US7272516B2 (en) | Failure rate adjustment for electric power network reliability analysis | |
| Taylor et al. | Distribution reliability and power quality | |
| CA2302921C (en) | System for analysing reliability of an electrical distribution network | |
| Kazemi | Reliability evaluation of smart distribution grids | |
| US6671634B2 (en) | System and method for reliability assessment of a power system having integrated modules | |
| CN108491990A (en) | A kind of wind farm device state evaluation and maintenance decision support detection method and system | |
| dos Santos et al. | Stochastic modeling of power system faults | |
| Dokic et al. | Risk assessment of a transmission line insulation breakdown due to lightning and severe weather | |
| Al-Maghalseh | Evaluating the reliability worth indices of electrical medium voltage network: case study | |
| Souto et al. | Probabilistic impact assessment of lightning strikes on power systems incorporating lightning protection design and asset condition | |
| Massaro et al. | Electrical transient interaction between transformers and power system–Brazilian experience | |
| Okabe et al. | Occurrence probability of lightning failure rates at substations in consideration of lightning stroke current waveforms | |
| Balzer et al. | Strategies for optimizing the use of substation assets | |
| Ciapessoni et al. | A risk-based resilience assessment tool to anticipate critical system conditions in case of natural threats | |
| Safaei et al. | Calculation of UHV transformer insulation risk by extended Monte Carlo method | |
| Karlsson | Power system performance when implementing dynamic rating on a wind farm connected transformer | |
| Khalil | Qualitative and Quantitative FMECA on 220 kV Power Transformers | |
| Arana et al. | How to improve the design of the electrical system in future wind power plants | |
| Purnomoadi et al. | Dynamic Risk-Indexing Model for High Voltage Overhead Transmission Lines | |
| Srinuntawong et al. | Data Warehouse and Asset Management Intelligence Architecture for Condition Assessment of Major Equipment in Power Plant | |
| Chan et al. | Mitigation of thermal stress accelerants on key components of an electric grid | |
| Barakou et al. | Investigation of the necessary modeling depth in transmission systems with mixed OHL-cable configuration | |
| Andreotti et al. | New challenges for forecasting voltage sags due to lightning phenomena in distribution networks | |
| Balijepalli | Advances in distribution system reliability assessment | |
| Anagnos et al. | Electrical substation equipment damage database for updating fragility estimates |
Legal Events
| Date | Code | Title | Description |
|---|---|---|---|
| AS | Assignment |
Owner name: ABB INC., NORTH CAROLINA Free format text: ASSIGNMENT OF ASSIGNORS INTEREST;ASSIGNORS:WANG, ZHENYUAN;PAN, JIUPING;LUBKEMAN, DAVID;AND OTHERS;REEL/FRAME:014856/0140;SIGNING DATES FROM 20031210 TO 20031217 |
|
| AS | Assignment |
Owner name: ABB RESEARCH LTD., SWITZERLAND Free format text: ASSIGNMENT OF ASSIGNORS INTEREST;ASSIGNOR:ABB INC.;REEL/FRAME:014290/0719 Effective date: 20040119 |
|
| STCF | Information on status: patent grant |
Free format text: PATENTED CASE |
|
| FEPP | Fee payment procedure |
Free format text: PAYOR NUMBER ASSIGNED (ORIGINAL EVENT CODE: ASPN); ENTITY STATUS OF PATENT OWNER: LARGE ENTITY |
|
| REMI | Maintenance fee reminder mailed | ||
| FPAY | Fee payment |
Year of fee payment: 4 |
|
| SULP | Surcharge for late payment | ||
| FPAY | Fee payment |
Year of fee payment: 8 |
|
| MAFP | Maintenance fee payment |
Free format text: PAYMENT OF MAINTENANCE FEE, 12TH YEAR, LARGE ENTITY (ORIGINAL EVENT CODE: M1553); ENTITY STATUS OF PATENT OWNER: LARGE ENTITY Year of fee payment: 12 |
|
| AS | Assignment |
Owner name: ABB SCHWEIZ AG, SWITZERLAND Free format text: MERGER;ASSIGNOR:ABB RESEARCH LTD.;REEL/FRAME:051419/0309 Effective date: 20190416 |
|
| AS | Assignment |
Owner name: ABB POWER GRIDS SWITZERLAND AG, SWITZERLAND Free format text: ASSIGNMENT OF ASSIGNORS INTEREST;ASSIGNOR:ABB SCHWEIZ AG;REEL/FRAME:052916/0001 Effective date: 20191025 |
|
| AS | Assignment |
Owner name: HITACHI ENERGY SWITZERLAND AG, SWITZERLAND Free format text: CHANGE OF NAME;ASSIGNOR:ABB POWER GRIDS SWITZERLAND AG;REEL/FRAME:058666/0540 Effective date: 20211006 |
|
| AS | Assignment |
Owner name: HITACHI ENERGY LTD, SWITZERLAND Free format text: MERGER;ASSIGNOR:HITACHI ENERGY SWITZERLAND AG;REEL/FRAME:065549/0576 Effective date: 20231002 |