US7551908B2 - High-frequency signal level detection apparatus and high-frequency signal receiver apparatus using the same - Google Patents
High-frequency signal level detection apparatus and high-frequency signal receiver apparatus using the same Download PDFInfo
- Publication number
- US7551908B2 US7551908B2 US10/553,902 US55390204A US7551908B2 US 7551908 B2 US7551908 B2 US 7551908B2 US 55390204 A US55390204 A US 55390204A US 7551908 B2 US7551908 B2 US 7551908B2
- Authority
- US
- United States
- Prior art keywords
- frequency
- frequency signal
- signal level
- inputted
- measured
- Prior art date
- Legal status (The legal status is an assumption and is not a legal conclusion. Google has not performed a legal analysis and makes no representation as to the accuracy of the status listed.)
- Expired - Fee Related, expires
Links
Images


Classifications
-
- H—ELECTRICITY
- H03—ELECTRONIC CIRCUITRY
- H03G—CONTROL OF AMPLIFICATION
- H03G3/00—Gain control in amplifiers or frequency changers without distortion of the input signal
- H03G3/20—Automatic control
- H03G3/30—Automatic control in amplifiers having semiconductor devices
- H03G3/3052—Automatic control in amplifiers having semiconductor devices in bandpass amplifiers (H.F. or I.F.) or in frequency-changers used in a (super)heterodyne receiver
- H03G3/3068—Circuits generating control signals for both R.F. and I.F. stages
Definitions
- the present invention relates to a high-frequency signal level detection apparatus for detecting a signal level of a high-frequency signal which is received by either an antenna or a cable, and to a high-frequency signal receiver apparatus using the same high-frequency signal level detection apparatus.
- the signal level is basically detected based on an AGC (Automatic Gain Control) voltage that is a control voltage outputted from an AGC circuit that controls the signal level of a received high-frequency signal to be substantially constant.
- AGC Automatic Gain Control
- the apparatus described in, for example, the prior art document 1 (hereinafter, referred to as a prior art apparatus) is characterized by generating a mapping function by correcting an AGC value by a predetermined value for a signal at a predetermined frequency or higher at which a change in the AGC value is greater according to characteristics of a high-frequency circuit block, storing the generated mapping function in a memory, correcting an AGC voltage by a predetermined value when a reception frequency at which an input level is displayed exceeds the predetermined frequency, and calculating a display level value of an inputted signal by the mapping function so as to reduce a display error in the display of the input level, and this leads to that an error may be caused due to a difference in reception frequency.
- the prior art apparatus stores mapping function data in the memory. Due to this, in order to realize the display of the signal level with higher accuracy, a frequency range is divided into narrow frequency ranges and the mapping function data are stored for respective narrow frequency ranges, resulting in an increase in a memory capacity. When the signal level is displayed with a predetermined memory capacity, there is caused such a problem that the accuracy is insufficiently low.
- the prior art apparatus calculates the signal level based only on a relationship between the signal level and an RFAGC voltage. As a result, there is caused such a problem that the accuracy for displaying the signal level is often deteriorated. Besides, when an interference signal is present on an adjacent channel, there is caused such a problem that the RFAGC voltage is influenced by the interference signal, resulting in deterioration of the accuracy for displaying the signal level.
- the object of the present invention is therefore to provide a high-frequency signal level detection apparatus capable of solving the above-stated problems and detecting a signal level of a high-frequency signal with accuracy higher than that of the prior art, and a high-frequency signal receiver apparatus using the same.
- a high-frequency signal level detection apparatus which includes an AGC circuit and detecting means.
- the AGC circuit executes an automatic gain control on an intermediate frequency signal obtained by converting a frequency of a received high-frequency signal, using an RFAGC value for controlling a gain of the high-frequency signal and an IFAGC value for controlling a gain of the intermediate frequency signal based on the intermediate frequency signal so that an output level of the intermediate frequency signal is substantially constant.
- the detecting means previously measures first relational data indicating an RFAGC value relative to an inputted signal level of the received high-frequency signal and second relational data indicating an IFAGC value relative to the inputted signal level of the received high-frequency signal.
- the detecting means measures the RFAGC value and the IFAGC value and detects the inputted signal level of the received high-frequency signal using the measured first and second relational data based on the measured RFAGC value and IFAGC value.
- the detecting means preferably detects the inputted signal level of the received high-frequency signal using only the second relational data based on the measured IFAGC value when the gain of the high-frequency signal is a maximum value thereof.
- the detecting means preferably detects the inputted signal level of the received high-frequency signal using only the first relational data based on the measured RFAGC value when the gain of the high-frequency signal is not a maximum value thereof.
- the detecting means preferably detects a first inputted signal level of the received high-frequency signal using the measured first relational data based on the measured RFAGC value, then detects a second inputted signal level of the received high-frequency signal using the measured second relational data based on the measured IFAGC value, and then detects an average value of the detected first and second inputted signal levels as the inputted signal level of the received high-frequency signal.
- the received high-frequency signal preferably has a plurality of frequencies.
- the detecting means preferably previously measures a first relational data indicating the RFAGC value relative to the inputted signal level and a second relational data indicating the IFAGC value relative to the inputted signal level using a high-frequency signal having a substantial central frequency among the frequencies.
- the received high-frequency signal preferably has a plurality of frequencies.
- the detecting means preferably previously measures the following parts using two high-frequency signals having a maximum frequency and a minimum frequency among the frequencies, respectively:
- detecting means detects a first inputted signal level of the received high-frequency signal using the measured first part of the first relational data based on the measured RFAGC value, then detects a second inputted signal level of the received high-frequency signal using the measured first part of the second relational data based on the measured IFAGC value, and then detects an average value of the detected first and second inputted signal levels as the inputted signal level of the high-frequency signal having the maximum frequency.
- detecting means detects a third inputted signal level of the received high-frequency signal using the measured second part of the first relational data based on the measured RFAGC value, then detects a fourth inputted signal level of the received high-frequency signal using the measured second part of the second relational data based on the measured IFAGC value, and then detects an average value of the detected third inputted signal level and the detected fourth inputted signal level as the inputted signal level of the high-frequency signal having the minimum frequency.
- detecting means calculates the inputted signal level of the high-frequency signal to be measured using a linear approximation method for linearly approximating the inputted signal level relative to a reception frequency of the high-frequency signal to be measured based on the detected inputted signal level of the high-frequency signal having the maximum frequency and on the detected inputted signal level of the high-frequency signal having the minimum frequency.
- the received high-frequency signal preferably has a plurality of frequencies, and a frequency range including the frequencies is divided into a plurality of frequency ranges.
- the detecting means preferably previously measures the first and second relational data in each of the divided frequency ranges, and then detects the inputted signal level of the received high-frequency signal using the measured first and second relational data corresponding to the frequency range to which the frequency of the high-frequency signal to be measured belongs.
- the detecting means preferably previously measures third relational data, that is a detected error in the IFAGC value of the second relational data indicating the IFAGC value relative to the inputted signal level of the received high-frequency signal, the detected error being caused, between a case with an interference signal of a further high-frequency signal in the vicinity of the frequency of the high-frequency signal to be measured, and a case with no interference signal thereof.
- the detecting means preferably detects the detected error using the third relational data based on the IFAGC value measured for the high-frequency signal to be measured, and corrects the detected inputted signal level using the, detected error.
- the detecting means preferably previously measures the following parts:
- the detecting means preferably detects one of the first and second detected errors based on the IFAGC value measured for the high-frequency signal to be measured using one of the first and second parts of the third relational data which respectively correspond to states in which the high-frequency signal to be measured is in the first and second cases, and corrects the detected inputted signal level using the detected error.
- the detecting means preferably represents the first relational data and the second relational data by predetermined approximate functions, respectively, and detects the inputted signal level of the received high-frequency signal using the approximate function of the first relational data and the approximate function of the second relational data.
- the above-mentioned high-frequency signal level detection apparatus preferably further includes display means for displaying the inputted signal level detected by the detecting means.
- a high-frequency signal receiver apparatus which includes a receiver for receiving a high-frequency signal, for converting the received high-frequency signal into an intermediate frequency signal, and for outputting the intermediate frequency signal and the above-mentioned high-frequency signal level detection apparatus.
- the first relational data indicating the RFAGC value relative to the inputted signal level of the received high-frequency signal and the second relational data indicating the IFAGC value relative to the inputted signal level of the received high-frequency signal are measured in advance.
- the RFAGC value and the IFAGC value when the high-frequency signal to be measured is received are measured.
- the inputted signal level of the received high-frequency signal is detected using the measured first and second relational data. Therefore, it is possible to detect the signal level of the high-frequency signal with accuracy higher than that of the prior art.
- FIG. 1 is a block diagram showing a configuration of a television receiver 100 that includes a high-frequency signal level detection and display function according to a first preferred embodiment of the present invention.
- FIG. 2 is a block diagram showing a configuration of a measurement control system for generating a display control program for the high-frequency signal level detection and display function of the television receiver 100 shown in FIG. 1 .
- FIG. 3 is a figure showing one example of a channel allocation of cable television broadcasting signals in the U.S.A.
- FIG. 4 is a flowchart showing a processing for generating the display control program, which is executed by a controller 60 of the measurement control system shown in FIG. 2 .
- FIG. 5 is a flowchart showing a processing for controlling display, which is executed by a controller 50 shown in FIG. 1 .
- FIG. 6 is a graph showing an example of measurement results of an RFAGC register value and an IFAGC register value relative to an inputted signal level in the television receiver 100 shown in FIG. 1 .
- FIG. 7 is a graph showing an approximate function obtained by approximating measurement results of a relationship of the inputted signal level to the RFAGC register value shown in FIG. 6 by using a predetermined approximate function.
- FIG. 8 is a graph showing an approximate function obtained by approximating measurement results of a relationship of the inputted signal level to the IFAGC register value shown in FIG. 6 by using a predetermined approximate function.
- FIG. 9 is a figure showing frequency ranges FR 1 and FR 2 that are obtained by dividing a frequency range of a broadcasting signal into two ranges and used in a television receiver 100 according to a second preferred embodiment of the present invention.
- FIG. 10 is a flowchart showing a processing for generating a display control program, which is executed by a controller 60 of a measurement control system according to the second preferred embodiment.
- FIG. 11 is a flowchart showing a processing for controlling display, which is executed by a controller 50 according to the second preferred embodiment.
- FIG. 12 is a figure showing minimum frequencies f 1min and f 2min , maximum frequencies f 1max and f 2max in respective frequency ranges FR 1 and FR 2 obtained by dividing a frequency range into two ranges, and a reception frequency f rec , which are used in a television receiver 100 according to a third preferred embodiment of the present invention.
- FIG. 13 is a flowchart showing a first part of a processing for generating a display control program, which is executed by a controller 60 of a measurement control system according to the third preferred embodiment.
- FIG. 14 is a flowchart showing a second part of a processing for generating a display control program, which is executed by a controller 60 of a measurement control system according to the third preferred embodiment.
- FIG. 15 is a flowchart showing a processing for controlling display, which is executed by a controller 50 according to the third preferred embodiment.
- FIG. 16 is a flowchart showing a processing for generating a display control program, which is executed by a controller 60 of a measurement control system according to a fourth preferred embodiment.
- FIG. 17 is a flowchart showing a processing for controlling display, which is executed by a controller 50 according to the fourth preferred embodiment.
- FIG. 18 is a graph showing an approximate function AF 52 obtained by approximating measurement results of a relationship of an inputted signal level equal to or larger than a predetermined threshold value to an RFAGC register value by using a predetermined approximate function.
- FIG. 19 is a graph showing an approximate function AF 51 obtained by approximating measurement results of a relationship of the inputted signal level equal to or smaller than the predetermined threshold value to an IFAGC register value by using a predetermined approximate function.
- FIG. 20 is a flowchart showing a first part of a processing for generating a display control program, which is executed by a controller 60 of a measurement control system according to a fifth preferred embodiment.
- FIG. 21 is a flowchart showing a second part of a processing for generating a display control program, which is executed by a controller 60 of a measurement control system according to a fifth preferred embodiment.
- FIG. 22 is a flowchart showing a processing for controlling display, which is executed by a controller 50 according to the fifth preferred embodiment.
- FIG. 23 is a flowchart showing a first part of a processing for generating a display control program, which is executed by a controller 60 of a measurement control system according to a sixth preferred embodiment.
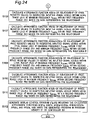
- FIG. 24 is a flowchart showing a second part of a processing for generating a display control program, which is executed by a controller 60 of a measurement control system according to a sixth preferred embodiment.
- FIG. 25 is a flowchart showing a processing for controlling display, which is executed by a controller 50 according to the sixth preferred embodiment.
- FIG. 26 is a spectral view showing such a case that two interference signals on adjacent channels are present on both sides of a reception channel for a television receiver 100 according to a seventh preferred-embodiment.
- FIG. 27 is a graph showing IFAGC register values and RFAGC register values relative to inputted signal levels in three cases when the interference signal on adjacent channel is not present, when one interference signal is present, and when two interference signals are present, respectively, in the television receiver 100 according to the seventh preferred embodiment.
- FIG. 28 is a graph showing the IFAGC register value relative to a ratio (U/D) of an interference signal power to a desired wave power in the television receiver 100 according to the seventh preferred embodiment.
- FIG. 29 is a graph showing a display error ER 2 of the inputted signal level relative to the IFAGC register value in the television receiver 100 according to the seventh preferred embodiment.
- FIG. 30 is a flowchart showing a characteristic part of a processing for controlling display executed by a controller 50 according to the seventh preferred embodiment.
- FIG. 1 is a block diagram showing a configuration of a television receiver 100 that includes a high-frequency signal level detection and display function according to a first preferred embodiment of the present invention
- FIG. 2 is a block diagram showing a configuration of a measurement control system for generating a display control program for the high-frequency signal level detection and display function of the television receiver 100 shown in FIG. 1 .
- the television receiver 100 is a high-frequency signal receiver apparatus that includes a set-top box (where a video signal processing is executed by a part up to an RGB switch 17 shown in FIG. 1 , and an audio signal processing is executed by a part up to a low frequency amplifier 20 shown in FIG. 1 ) for receiving a digital broadcasting signal such as a cable television (hereinafter, referred to as a CATV).
- a set-top box where a video signal processing is executed by a part up to an RGB switch 17 shown in FIG. 1 , and an audio signal processing is executed by a part up to a low frequency amplifier 20 shown in FIG. 1 .
- CATV digital broadcasting signal
- the television receiver 100 includes an AGC circuit 30 that generates an RFAGC voltage for controlling an attenuation amount of an attenuator 4 so as to keep a signal level of a high-frequency (RF) signal substantially constant, and an IFAGC voltage for controlling an amplification factor of an intermediate frequency amplifier 7 so as to keep a signal level of an intermediate frequency (IF) signal substantially constant.
- an AGC circuit 30 that generates an RFAGC voltage for controlling an attenuation amount of an attenuator 4 so as to keep a signal level of a high-frequency (RF) signal substantially constant
- an IFAGC voltage for controlling an amplification factor of an intermediate frequency amplifier 7 so as to keep a signal level of an intermediate frequency (IF) signal substantially constant.
- a controller 60 of the measurement control system is characterized by controlling a high-frequency signal generator 65 to change an inputted signal level of a high-frequency signal inputted to an input terminal 1 , calculating each of approximate functions AF 1 and AF 2 based on relationships of an IFAGC register value and an RFAGC register value to the changed inputted signal levels, respectively, generating a display control program ( FIG. 5 ) including these approximate functions AF 1 and AF 2 , and writing the generated display control program into a program memory 51 of a controller 50 .
- the controller 50 of the television receiver 100 is characterized by executing the display control program shown in FIG.
- a head end apparatus of a CATV broadcasting company is connected to the input terminal 1 through, for example, a coaxial cable.
- a front end circuit 2 is configured to include a high-frequency amplifier 3 , the attenuator 4 , the attenuation amount of which is controlled by the RFAGC voltage outputted from a low-pass filter (LPF) 45 within the AGC circuit 30 , the local oscillator 5 , a local oscillation frequency of which is controlled by the controller 50 , so as to control a frequency of a broadcasting channel from the television receiver 100 , and a mixer 6 .
- LPF low-pass filter
- the digital broadcasting signal from the head end apparatus is inputted to the mixer 6 through the input terminal 1 , the high-frequency amplifier 3 , and the attenuator 4 .
- a local oscillation signal from the local oscillator 5 is inputted to the mixer 6 .
- the mixer 6 mixes up the two inputted signals, and outputs a resultant mixed signal to an A/D converter 10 through the intermediate frequency amplifier 7 , an SAW bandpass filter 8 , and an intermediate frequency amplifier 9 .
- the SAW bandpass filter 8 substantially band-passes only a signal component on one channel of the broadcasting signal, so as to extracts a low frequency converted intermediate frequency signal (hereinafter, referred to as an IF signal) corresponding to the signal component on one channel of the broadcasting signal, from the resultant mixed signal.
- the A/D converter 10 converts the inputted IF signal into a digital signal at a predetermined sampling frequency, and outputs the digital signal to a digital demodulator 11 and an AGC detector circuit 31 that includes an RF-IF control function and that is provided in the AGC circuit 30 .
- the digital demodulator 11 includes an error correction circuit and digitally demodulates the inputted digital signal and outputs the demodulated signal to a TS decoder 12 .
- the TS decoder 12 transmits the inputted digitally-demodulated digital signal to a descrambler 14 through an POD card section 13 that stores security information on the broadcasting company. Then the descrambler 14 descrambles the digitally-demodulated digital signal, extracts a transport stream signal (hereinafter, referred to as a TS signal) from the descrambled digital signal, and outputs the extracted TS signal to an AV decoder 15 .
- a transport stream signal hereinafter, referred to as a TS signal
- the AV decoder 15 decodes a digital video signal and a digital audio signal from the inputted TS signal, outputs the digital video signal to an RGB processor 16 , and outputs the digital audio signal to the low frequency amplifier 20 .
- the RGB processor 16 converts the inputted digital video signal into an RGB video signal, and outputs the RGB video signal to a liquid crystal display 18 through the RGB switch 17 .
- the RGB switch 17 superimposes an RGB signal generated by an OSD (On Screen Display) controller 19 based on data of the inputted signal level of the broadcasting signal from the controller 50 , on the RGB signal from the RGB processor 16 , and outputs a resultant superimposed RGB signal to the liquid crystal display 18 as will be described later in detail.
- the low frequency amplifier 20 includes an A/D converter and converts inputted two channels of digital audio signals into analog audio signals, and outputs the analog audio signals to left and right loudspeakers 22 and 21 .
- the AGC circuit 30 is configured to include the AGC detector circuit 31 that includes the RF-IF control function, loop filters 32 and 42 , an IFAGC register 33 , an RFAGC register 433 pulse width modulators 34 and 44 , and low-pass filters 35 and 45 .
- the AGC detector circuit 31 detects the IF signal inputted from the A/D converter 10 , determines an operating ratio of an RFAGC to an IFAGC from a level value of the IF signal, generates an RFAGC signal and an IFAGC signal based on the determined ratio, and then, controls an RFAGC loop and an IFAGC loop, so as to adjust the broadcasting signal inputted at various kinds of inputted signal levels depending on a reception location or a reception channel (e.g., at an inputted signal level difference of about 90 dB when the received broadcasting signal is a terrestrial digital broadcasting signal, and at an inputted signal level difference of about 30 dB for a digital cable) to substantially such a constant amplitude level that the digital demodulator 11 in rear of the AGC detector circuit 31 can correctly demodulate the broadcasting signal.
- a reception location or a reception channel e.g., at an inputted signal level difference of about 90 dB when the received broadcasting signal is a terrestrial digital broadcasting signal, and at an inputted
- the IFAGC signal from the AGC detector circuit 31 is subjected to time averaging by the loop filter 32 that serves as a predetermined low-pass filter, and a signal value of the resultant IFAGC signal is temporarily stored in the IFAGC register 33 .
- the pulse width modulator 34 modulates a pulse width of the IFAGC signal according to an IFAGC register value stored in the IFAGC register 33 using, for example, ⁇ - ⁇ modulation method, and the pulse width modulated IFAGC signal is transformed to the IFAGC voltage through the bandpass filter 35 , and the IFAGC voltage becomes a control signal for controlling the amplification factor of the intermediate frequency amplifier 7 .
- the RFAGC signal from the AGC detector circuit 31 is subjected to time averaging by the loop filter 42 that serves as a predetermined low-pass filter, and a signal value of the resultant RFAGC signal is temporarily stored in the RFAGC register 43 .
- the pulse width modulator 44 modulates a pulse width of the RFAGC signal according to an RFAGC register value stored in the RFAGC register 43 using, for example, the ⁇ - ⁇ modulation method, and the pulse width modulated RFAGC signal is transformed to the RFAGC voltage through the bandpass filter 45 , and the RFAGC voltage becomes a control signal for controlling the attenuation amount of the attenuator 4 .
- the IFAGC register value and the RFAGCA register value stored in the IFAGC register 33 and the RFAGC register 43 , respectively, are read out by the controller 50 , and used to generate the approximate functions AF 1 and AF 2 , to be described later in detail, as well as to calculate the inputted signal level Pin.
- the controller 50 which is constituted by, for example, a microcomputer, controls entirety of the television receiver 100 according to a program stored in the program memory. 51 , and stores data that is temporarily calculated during execution of the program in the data memory 52 .
- An input unit 53 for inputting a channel number for selecting a broadcasting channel, a command to display the inputted signal level and the like is connected to the controller 50 .
- the liquid crystal display 54 for displaying input values and set values inputted or set to the controller 50 is connected to the controller 50 .
- the controller 50 executes the display control program generated by the controller 60 shown in FIG. 2 and stored in the program memory 51 , so as to calculate and display the inputted signal level of the digital broadcasting signal which the user views and listens to.
- a high-frequency signal generator 65 is connected to the input terminal 1 of the television receiver 100 , and the controller 60 controls a frequency of a high-frequency signal generated -by the high-frequency signal generator 65 .
- the controller 60 which is constituted by, for example, a microcomputer, controls entirety of the measurement control system according to a program stored in a program memory 61 , and stores data that is temporarily calculated during execution of the program in a data memory 62 .
- An input unit 63 for inputting a command to generate a display control program and the like is connected to the controller 60 .
- a liquid crystal display 64 for displaying input values and set values inputted or set to the controller 60 and an operating state is connected to the controller 60 .
- the controller 60 executes the processing for generating the display control program shown in FIG. 4 stored in the program memory 61 as will be described later in detail. Then the controller 60 controls the high-frequency signal generator 65 to change the inputted signal level of the high-frequency signal inputted to the input terminal 1 , calculates the approximate functions AF 1 and AF 2 based on the relationships of IFAGC register values and RFAGC register values to the changed inputted signal levels, respectively, generates the display control program ( FIG. 5 ) including these approximate functions AF 1 and AF 2 , and writes the generated display control program into the program memory 51 of the controller 50 .
- FIG. 3 is a figure showing one example of a channel allocation of CATV broadcasting signals in the US.
- the channels of the CATV broadcasting signals in the US include broadcasting signals from a 57-MHz broadcasting signal on Channel 2 to an 861-MHz broadcasting signal on Channel 135 through a 459-MHz broadcasting signal on Channel 63 .
- FIG. 4 is a flowchart showing a processing for generating the display control program, which is executed by the controller 60 of the measurement control system shown in FIG. 2 .
- step S 1 with controlling the high-frequency signal generator 65 to change the inputted signal level of the high-frequency signal inputted to the input terminal 1 and having a general central frequency of, for example, 459 MHz from ⁇ 20 dBmV to +20 dBmV every one dBmV, the controller 60 reads out IFAGC register values and RFAGC register values corresponding to respective inputted signal levels from the IFAGC register 33 and the RFAGC register 43 , respectively, and stores the read-out same values in the data memory 62 .
- step S 2 the controller 60 calculates the approximate function AF 1 of the relationship of the IFAGC register values to the respective inputted signal levels based on the data representing the relationship.
- the controller 60 calculates the approximate function AF 2 of the relationship of the RFAGC register values to the respective inputted signal levels based on the data representing the relationship. Further, at step S 4 , the controller 60 generates the display control program ( FIG. 5 ) including the calculated approximate functions AF 1 and AF 2 , and writes the generated program in the program memory 51 of the controller 50 , thus finishing the processing for generating the display control program.
- forms and calculation methods of approximate functions are similar to those according to the present invention.
- FIG. 5 is a flowchart showing a processing for controlling display, which is executed by the controller 50 shown in FIG. 1 .
- step S 11 the controller 50 judges whether or not a command to display the inputted signal level is inputted from the input unit 53 . If YES at step S 11 , the processing flow goes to step S 12 . If NO at step S 11 , the processing flow returns to step S 11 . Then, at step S 12 , the controller 50 reads out the IFAGC register value from the IFAGC register 33 and reads out the RFAGC register value from the RFAGC register value 43 . At step S 13 , the controller 50 calculates the inputted signal level Pif using the approximate function AF 1 based on the read-out IFAGC register value.
- step S 16 the controller 50 generates display data for displaying the calculated inputted signal level Pin, and outputs the generated display data to the OSD controller 19 .
- the processing flow then returns to step S 11 .
- FIG. 6 is a graph showing an example of measurement results of the RFAGC register value and the IFAGC register value relative to the inputted signal level in the television receiver 100 shown in FIG. 1 .
- the RFAGC register value is substantially constant relative to the inputted signal level of up to about ⁇ 6 dBmV at which level the attenuation amount of the attenuator 4 becomes the minimum and an RF gain is set to the maximum thereof, and gradually decreases relative to the inputted signal level of greater than about ⁇ 6 dBmV.
- the IFAGC register value gradually decreases relative to the inputted signal level of up to about ⁇ 6 dBmV, and being constant relative to the inputted signal level of greater than about ⁇ 6 dBmV.
- FIG. 7 is a graph showing an approximate function AF 2 obtained by approximating the measurement results of the relationship of the inputted signal level to the RFAGC register value shown in FIG. 6 by using a predetermined approximate function.
- the obtained approximate function AF 2 generally coincides with the measured values in the other range.
- FIG. 8 is a graph showing an approximate function AF 1 obtained by approximating the measurement results of the relationship of the inputted signal level to the IFAGC register value shown in FIG. 6 by using a predetermined approximate function.
- the obtained approximate function AF 1 generally coincides with the measured values in the other range.
- the inputted signal level Pif is calculated using the approximate function AF 1 based on the IFAGC register value
- the inputted signal level Prf is calculated using the approximate function AF 2 based on the RFAGC register value
- the average value of the inputted signal levels Pif and Prf is calculated and displayed as the inputted signal level Pin. Therefore, it is possible to average the errors shown in FIGS. 7 and 8 described above, and detect and display the inputted signal level of the received broadcasting signal with accuracy higher than that of the prior art.
- FIG. 9 is a figure showing frequency ranges FR 1 and FR 2 that are obtained by dividing a frequency range of a broadcasting signal into two ranges and used in a television receiver 100 according to a second preferred embodiment of the present invention.
- the second preferred embodiment is characterized as follows. If an inputted signal level of a digital broadcasting signal is to be detected, attention is paid to a fact that the characteristic shown in FIG. 6 is changed according to the frequency of the broadcasting signal, and a frequency range including all channels of CATV broadcasting signals is divided into two ranges, i.e., a first frequency range FR 1 and a second frequency range FR 2 as shown in FIG. 9 .
- An approximate function AF 11 representing a relationship between the inputted signal level and an IFAGC register value and an approximate function AF 12 representing a relationship between the inputted signal level and an RFAGC register value at a general central frequency f 1c in the first frequency range FR 1
- an approximate function AF 21 representing a relationship between the inputted signal level and the IFAGC register value and an approximate function AF 22 representing a relationship between the inputted signal level and the RFAGC register value at a general central frequency f 2c in the second frequency range FR 2
- Inputted signal levels Pif and Prf are calculated using the two approximate functions of a corresponding frequency range in which a channel that user views and listens to is included. Thereafter, similarly to the first preferred embodiment, these inputted signal levels Pif and Prf are averaged to calculate an inputted signal level Pin.
- FIG. 10 is a flowchart showing a processing for generating a display control program, which is executed by a controller 60 of a measurement control system according to the second preferred embodiment.
- step S 21 with controlling a high-frequency signal generator 65 to change the inputted signal level of the high-frequency signal inputted to an input terminal 1 and having the general central frequency f 1c of 255 MHz within the first frequency range FR 1 from ⁇ 20 dBmV to +20 dBmV every one dBmV, the controller 60 reads out IFAGC register values and RFAGC register values corresponding to the respective inputted signal levels from an IFAGC register 33 and an RFAGC register 43 , respectively, and stores the read-out same values in a data memory 62 .
- step S 22 with controlling the high-frequency signal generator 65 to change the inputted signal level of the high-frequency signal inputted to the input terminal 1 and having the general central frequency f 2c of 663 MHz within the second frequency range FR 2 from ⁇ 20 dBmV to +20 dBmV every one dBmV, the controller 60 reads out IFAGC register values and RFAGC register values corresponding to the respective inputted signal levels from the IFAGC register 33 and the RFAGC register 43 , respectively, and stores the read-out same values in the data memory 62 .
- the controller 60 calculates the approximate function AF 11 of the relationship of the IFAGC register values to the respective inputted signal levels within the first frequency range FR 1 based on the data representing the relationship.
- the controller 60 calculates the approximate function AF 12 of the relationship of the RFAGC register values to the respective inputted signal levels within the first frequency range FR 1 based on the data representing the relationship.
- the controller 60 calculates the approximate function AF 21 of the relationship of the IFAGC register values to the respective inputted signal levels within the second frequency range FR 2 based on the data representing the relationship.
- the controller 60 calculates the approximate function AF 22 of the relationship of the RFAGC register values to the respective inputted signal levels within the second frequency range FR 2 based on the data representing the relationship. Further, at step S 27 , the controller 60 generates a display control program ( FIG. 11 ) including the calculated approximate functions AF 11 , AF 12 , AF 21 , and AF 22 , and writes the generated display control program into the program memory 51 of the controller 50 , thus finishing the processing for generating the display control program.
- a display control program FIG. 11
- FIG. 11 is a flowchart showing a processing for controlling display, which is executed by a controller 50 according to the second preferred embodiment.
- step S 31 the controller 50 judges whether or not a command to display the inputted signal level is inputted from an input unit 53 . If YES at step S 31 , the processing flow goes to step S 32 . If NO at step S 31 , the processing flow returns to step S 31 .
- step S 32 the controller 50 reads out the IFAGC register value from the IFAGC register 33 and reads out the RFAGC register value from the RFAGC register value 43 .
- step S 33 the controller 50 judges whether or not a current reception frequency f rec is fallen within the first frequency range FR 1 . If YES at step S 22 , the processing flow goes to step S 34 .
- step S 34 the controller 50 calculates the inputted signal level Pif using the approximate function AF 11 based on the read-out IFAGC register value.
- step S 35 the controller 50 calculates the inputted signal level Prf using the approximate function AF 12 based on the read-out RFAGC register value, and the processing flow goes to step S 38 .
- step S 36 the controller 50 calculates the inputted signal level Pif using the approximate function AF 21 based on the read-out IFAGC register value.
- step S 37 the controller 50 calculates the inputted signal level Prf using the approximate function AF 22 based on the read-out RFAGC register value, and the processing flow goes to step S 38 . Further, at step S 38 , the controller 50 calculates an average value of the calculated inputted signal levels Pif and Prf as the inputted signal level Pin using the equation (1) based on the calculated inputted signal levels Pif and Prf. At step S 39 , the controller 50 generates display data for displaying the calculated inputted signal level Pin, and outputs the generated display data to an OSD controller 19 . The processing flow then returns to step S 31 .
- the inputted signal level Pif is calculated using the approximate function AF 11 or AF 21 corresponding to the frequency range FR 1 or FR 2 included in the frequency of the viewed digital broadcasting signal based on the IFAGC register value
- the inputted signal level Prf is calculated using the approximate function AF 12 or AF 22 corresponding to the frequency range FR 1 or FR 2 included in the frequency of the viewed digital broadcasting signal based on the RFAGC register value
- the average value of the inputted signal levels Pif and Prf is calculated and displayed as the inputted signal level Pin. Therefore, it is possible to average the errors shown in FIGS. 7 and 8 described above, substantially eliminate the error due to the change in the frequency of the broadcasting signal, and detect and display the inputted signal level of the received broadcasting signal with accuracy higher than that of the prior art.
- the frequency range of the broadcasting signal is divided into the two frequency ranges FR 1 and FR 2 .
- the frequency range may be divided into three or more frequency ranges and approximate functions may be calculated. The same thing is true for the subsequent preferred embodiments.
- FIG. 12 is a figure showing minimum frequencies f 1min and f 2min , maximum frequencies f 1max and f 2max in respective frequency ranges FR 1 and FR 2 obtained by dividing a frequency range into two ranges, and a reception frequency f rec , which are used in a television receiver 100 according to a third preferred embodiment of the present invention.
- the third preferred embodiment is characterized as follows. If an inputted signal level of a digital broadcasting signal is to be detected, attention is paid to a fact that the characteristic shown in FIG. 6 is changed according to a frequency of the broadcasting signal, and the frequency range of all channels of CATV broadcasting signals is divided into the two ranges, i.e., the first frequency range FR 1 and the second frequency range FR 2 as shown in FIG. 12 . In addition, the following approximate functions are calculated.
- inputted signal levels Pif and Prf are calculated using the two corresponding approximate-functions, and similarly to the first preferred embodiment, these inputted signal levels Pif and Prf are averaged to calculate average values P fmin and P fmax of the inputted signal levels at the minimum frequency and the maximum frequency in this frequency range, respectively.
- an inputted signal level Pin is calculated using the following equation (2) by a linear approximation method for linearly approximating the inputted signal level relative to a reception frequency on assumption that the inputted signal level is linearly changed relative to a frequency between the minimum frequency and the maximum frequency in a predetermined frequency range:
- f rec denotes a reception frequency
- n is one in the first frequency range FR 1 and two in the second frequency range FR 2 .
- FIGS. 13 and 14 are flowcharts showing a processing for generating a display control program, which is executed by a controller 60 of a measurement control system according to the third preferred embodiment.
- step S 41 with controlling a high-frequency signal generator 65 to change the inputted signal level of the high-frequency signal inputted to an input terminal 1 and having the minimum frequency f 1min of 57 MHz within the first frequency range FR 1 from ⁇ 20 dBmV to +20 dBmV every one dBmV, the controller 60 reads out IFAGC register values and RFAGC register values corresponding to the respective inputted signal levels from an IFAGC register 33 and an RFAGC register 43 , respectively, and stores the read-out same values in a data memory 62 .
- step S 42 with controlling the high-frequency signal generator 65 to change the inputted signal level of the high-frequency signal inputted to the input terminal 1 and having the maximum frequency f 1max of 459 MHz within the first frequency range FR 1 and the minimum frequency f 2min of 459 MHz within the second frequency range FR 2 from ⁇ 20 dBmV to +20 dBmV every one dBmV, the controller 60 reads out IFAGC register values and RFAGC register values corresponding to the respective inputted signal levels from the IFAGC register 33 and the RFAGC register 43 , respectively, and stores the read-out same values in the data memory 62 .
- step S 43 with controlling the high-frequency signal generator 65 to change the inputted signal level of the high-frequency signal inputted to the input terminal 1 and having the maximum frequency f 2max of 861 MHz within the second frequency range FR 2 from ⁇ 20 dBmV to +20 dBmV every one dBmV, the controller 60 reads out IFAGC register values and RFAGC register values corresponding to the inputted signal levels from the IFAGC register 33 and the respective RFAGC register 43 , respectively, and stores the read-out same values in the data memory 62 .
- step S 44 the controller 60 calculates the approximate function AF 31 a of the relationship of the IFAGC register values to the respective inputted signal levels at the minimum frequency f min within the first frequency range FR 1 based on the data representing the relationship.
- step S 45 the controller 60 calculates the approximate function AF 31 b of the relationship of the RFAGC register values to the respective inputted signal levels at the minimum frequency f 1min within the first frequency range FR 1 based on the data representing the relationship.
- step S 46 shown in FIG. 14 .
- step S 48 the controller 60 calculates the approximate function AF 42 a of the relationship of the IFAGC register values to the respective inputted signal levels at the maximum frequency f 2max within the second frequency range FR 2 based on the data representing the relationship.
- step S 49 the controller 60 calculates the approximate function AF 42 b for the relationship of the RFAGC register values to the respective inputted signal levels at the maximum frequency f 2max within the second frequency range FR 2 based on the data representing the relationship.
- step S 50 the controller 60 generates a display control program ( FIG.
- FIG. 15 is a flowchart showing a processing for controlling display, which is executed by a controller 50 according to the third preferred embodiment.
- step S 51 the controller 50 judges whether or not a command to display the inputted signal level is inputted from an input unit 53 . If YES at step S 51 , the processing flow goes to step S 52 . If NO at step S 51 , the processing flow returns to step S 51 .
- step S 52 the controller 50 reads out the IFAGC register value from the IFAGC register 33 and reads out the RFAGC register value from the RFAGC register value 43 .
- step S 53 the controller 50 judges whether or not a current reception frequency f rec is fallen within the first frequency range FR 1 . If YES at step S 53 , the processing flow goes to step S 54 . If NO at step S 53 , the processing flow goes to step S 56 .
- the controller 50 calculates the inputted signal level Pif at the minimum frequency f 1min using the approximate function AF 31 a based on the read-out IFAGC register value.
- the controller 50 calculates the inputted signal level Prf at the minimum frequency f 1min using the approximate function AF 31 b based on the read-out RFAGC register value.
- the controller 50 calculates the inputted signal level Pif at the maximum frequency f 1max using the approximate function AF 32 a based on the read-out IFAGC register value.
- the controller 50 calculates the inputted signal level Pif at the minimum frequency f 2min using the approximate function AF 41 a based on the read-out IFAGC register value.
- the controller 50 calculates the inputted signal level Prf at the minimum frequency f 2min using the approximate function AF 41 b based on the read-out RFAGC register value.
- the controller 50 calculates the inputted signal level Pif at the maximum frequency f 2max using the approximate function AF 42 a based on the read-out IFAGC register value.
- step S 58 the controller 50 calculates the inputted signal level Pin using the equation (2) by the linear approximation method based on the calculated inputted signal levels P fmin and P fmax .
- step S 59 the controller 50 generates display data for displaying the calculated inputted signal level Pin, and outputs the generated display data to an OSD controller 19 . The processing flow then returns to step S 51 .
- the inputted signal level Pif is calculated using the approximate function corresponding to the minimum frequency within the frequency range FR 1 or FR 2 included in the frequency of the viewed digital broadcasting signal based on the IFAGC register value.
- the inputted signal level Prf is calculated using the approximate function corresponding to the minimum frequency within the frequency range FR 1 or FR 2 included in the frequency of the viewed digital broadcasting signal based on the RFAGC register value.
- the average value of the inputted signal levels Pif and Prf is calculated as the inputted signal level P fmin of the minimum frequency.
- the inputted signal level Pif is calculated using the approximate function corresponding to the maximum frequency within the frequency range FR 1 or FR 2 included in the frequency of the viewed digital broadcasting signal based on the IFAGC register value.
- the inputted signal level Prf is calculated using the approximate function corresponding to the maximum frequency within the frequency range FR 1 or FR 2 included in the frequency of the viewed digital broadcasting signal based on the RFAGC register value.
- the average value of the inputted signal levels Pif and Prf is calculated as the inputted signal level P fmax of the maximum frequency.
- the inputted signal level Pin is calculated and displayed using the equation (2) by the linear approximation method. Therefore, it is possible to average the errors shown in FIGS. 7 and 8 described above, correct the error due to a change in the frequency of the broadcasting signal in light of a frequency deviations from the minimum frequency and the maximum frequency, and detect and display the inputted signal level of the received broadcasting signal with accuracy higher than that of the prior art.
- FIG. 16 is a flowchart showing a processing for generating a display control program, which is executed by a controller 60 of a measurement control system according to a fourth preferred embodiment.
- FIG. 17 is a flowchart showing a processing for controlling display, which is executed by a controller 50 according to the fourth preferred embodiment.
- the fourth preferred embodiment is characterized as follows. Attention is paid to facts, as apparent from the graph of FIG. 6 , that when an RFAGC register value is the maximum value thereof (when an inputted signal level is smaller than a predetermined threshold value (about ⁇ 6 dBmV in FIG. 6 )), only the IFAGC register value is generally changed relative to the inputted signal level and that when the IFAGC register value is not the maximum value thereof (when the inputted signal level exceeds the threshold value), only an RFAGC register value is generally changed relative to the inputted signal level. In the former case, the inputted signal level is detected based on the IFAGC register value. On the other hand, in the latter case, the inputted signal level is detected based on the RFAGC register value.
- the maximum value of measured RFAGC register values is searched.
- a range of the inputted signal level at which the RFAGC register value is the maximum value thereof (where an attenuation amount of the attenuator 4 shown in FIG. 1 has the minimum value thereof and a gain for a high-frequency signal has the maximum value thereof) is searched, and the searched range is set as a first level range LR 1 .
- a range of the inputted signal level, at which the RFAGC register value does not have the maximum value thereof, is set as a second level range LR 2 .
- an inputted signal level Pin is calculated using an approximate function AF 51 in this range LR 1 based on the IFAGC register value.
- the second level range LR 2 the inputted signal level Pin is calculated using an approximate function AF 52 in this range LR 2 based on the RFAGC register value.
- step S 61 with controlling a high-frequency signal generator 65 to change the inputted signal level of the high-frequency signal inputted to an input terminal 1 from ⁇ 20 dBmV to +20 dBmV every one dBmV, the controller 60 measures IFAGC register values and RFAGC register values corresponding to the inputted signal levels, and stores the measured same values in a data memory 62 .
- step S 62 the controller 50 searches the maximum value of the RFAGC register values based on the measured RFAGC register values and stores the searched maximum value in the data memory 62 .
- the controller 50 searches a range of the inputted signal level when the RFAGC register value has the maximum value thereof, and sets the searched range as the first level range LR 1 .
- the controller 50 sets a range of the inputted signal level when the RFAGC register value does not have the maximum value thereof as the second level range LR 2 .
- the controller 60 calculates the approximate function AF 51 of the relationship of the IFAGC register values to the respective inputted signal levels within the first level range LR 1 based on the data representing this relationship.
- the controller 60 calculates the approximate function AF 52 of the relationship of the RFAGC register values to the respective inputted signal levels within the second level range LR 2 based on the data representing this relationship.
- step S 65 the controller 60 generates a display control program ( FIG. 17 ) including the calculated approximate functions AF 51 and AF 52 , and writes the generated display control program in a program memory 51 of the controller 50 , thus finishing the processing for generating the display control program.
- step S 71 the controller 50 judges whether or not a command to display the inputted signal level is inputted from an input unit 53 . If YES at step S 71 , the processing flow goes to step S 72 . If NO at step S 71 , the processing flow returns to step S 71 .
- step S 72 the controller 50 reads out the IFAGC register value from an IFAGC register 33 and reads out the RFAGC register value from an RFAGC register value 43 . Then, at step S 73 , the controller 50 judges whether or not the read-out RFAGC register value is the maximum value of the RFAGC register values.
- step S 74 the processing flow goes to step S 74 . If NO at step S 73 , the processing flow goes to step S 75 .
- step S 74 the controller 50 calculates the inputted signal level Pin using the approximate function AF 51 based on the read-out IFAGC register value. Thereafter, the processing flow goes to step S 76 .
- step S 75 the controller 50 calculates the inputted signal level Pin using the approximate function AF 52 based on the read-out RFAGC register value. Thereafter, the processing flow goes to step S 76 . Further, at step S 76 , the controller 50 generates display data for displaying the calculated inputted signal level Pin, and outputs the generated display data to an OSD controller 19 . The processing flow then returns to step S 71 .
- FIG. 18 is a graph showing an approximate function AF 52 obtained by approximating measurement results of the relationship of the inputted signal level equal to or larger than a predetermined threshold value to the RFAGC register value by using a predetermined approximate function.
- FIG. 19 is a graph showing an approximate function AF 51 obtained by approximating measurement results of the relationship of the inputted signal level equal to or smaller than the predetermined threshold value to an IFAGC register value by using a predetermined approximate function.
- the inputted signal level can be detected uniquely from the RFAGC register value and the IFAGC register value on each of the graphs. The reason for this is as follows.
- a linear function part linear part
- a quadric function curve part
- an error may be caused between the approximate function and actual inputted signal level.
- the control flow may be branched based on the condition of the inputted signal level at step S 73 shown in FIG. 17 , and this leads to that these two functions are not present simultaneously on the same graph. Therefore, an approximate function calculation error is small. Accordingly, the accuracy for detecting the inputted signal level can be advantageously and remarkably improved.
- FIGS. 20 and 21 are flowcharts showing a processing for generating a display control program, which is executed by a controller 60 of a measurement control system according to a fifth preferred embodiment.
- FIG. 22 is a flowchart showing a processing for controlling display, which is executed by a controller 50 according to the fifth preferred embodiment.
- the fifth preferred embodiment is characterized by the use of the calculation of approximate functions by dividing the frequency range of the broadcasting signal into the two ranges according to the second preferred embodiment in addition to such a use that the control flow is branched based on the condition of the inputted signal level according to the fourth preferred embodiment.
- step S 81 with controlling a high-frequency signal generator 65 to change the inputted signal level of a high-frequency signal inputted to an input terminal 1 and having a general central frequency f 1c of 255 MHz-within a first frequency range FR 1 from ⁇ 20 dBmV to +20 dBmV every one dBmV, the controller 60 reads out IFAGC register values and RFAGC register values corresponding to the respective inputted signal levels from an IFAGC register 33 and an RFAGC register 43 , respectively, and stores the read-out same values in a data memory 62 .
- the controller 60 searches the maximum value of the RFAGC register values based on the measured RFAGC register values for the first frequency range FR 1 , and stores the searched maximum value thereof in the data memory 62 .
- the controller 60 searches a range of the inputted signal level when the RFAGC register value has the maximum value thereof, and sets the searched range as a level range LR 11 of the first frequency range FR 1 .
- the controller 60 sets a range of the inputted signal level when the RFAGC register value does not have the maximum value thereof as a level range LR 12 of the first frequency range FR 1 .
- step S 83 the controller 60 calculates an approximate function AF 61 of a relationship of the IFAGC register values to the respective inputted signal levels within the level range LR 11 based on the data representing this relationship.
- step S 84 the controller 60 calculates an approximate function AF 62 of a relationship of the RFAGC register values to the respective inputted signal levels within the level range LR 12 based on the data representing this relationship.
- step S 85 with controlling the high-frequency signal generator 65 to change the inputted signal level of the high-frequency signal inputted to the input terminal 1 and having a general central frequency f 2c of 255 MHz within a second frequency range FR 2 from ⁇ 20 dBmV to +20 dBmV every one dBmV, the controller 60 reads out IFAGC register values and RFAGC register values corresponding to the respective inputted signal levels from the IFAGC register 33 and the RFAGC register 43 , respectively, and stores the read-out same values in the data memory 62 . Thereafter, the processing flow goes to step S 86 shown in FIG. 21 .
- the controller 60 searches the maximum value of the RFAGC register values based on the measured RFAGC register values for the second frequency range FR 2 , and stores the searched maximum value thereof in the data memory 62 .
- the controller 60 searches a range of the inputted signal levels when the RFAGC register value has the maximum value thereof, and sets the searched range as a level range LR 21 of the second frequency range FR 2 .
- the controller 60 sets the range of the inputted signal levels when the RFAGC register value does not have the maximum value thereof as a level range LR 22 of the second frequency range FR 2 .
- step S 87 the controller 60 calculates an approximate function AF 71 of a relationship of the IFAGC register values to the respective inputted signal levels within the level range LR 21 based on the data representing this relationship.
- step S 88 the controller 60 calculates an approximate function AF 72 of a relationship of the RFAGC register values to the respective inputted signal levels within the level range LR 22 based on the data representing this relationship.
- step S 89 the controller 60 generates a display control program ( FIG. 22 ) including the calculated approximate functions AF 61 , AF 62 , AF 71 and AF 72 , and writes the generated display control program in a program memory 51 of the controller 50 , thus finishing the processing for generating the display control program.
- step S 91 the controller 50 judges whether or not a command to display the inputted signal level is inputted from an input unit 53 . If YES at step S 91 , the processing flow goes to step S 92 . On the other hand, if NO at step S 91 , the processing flow returns to step S 91 .
- step S 92 the controller 50 reads out the IFAGC register value from an IFAGC register 33 and reads out the RFAGC register value from an RFAGC register value 43 .
- step S 93 the controller 50 judges whether or not a current reception frequency is fallen within the first frequency range FR 1 .
- step S 94 the processing flow goes to step S 94 .
- step S 97 the controller 50 judges whether or not the read-out RFAGC register value is the maximum value of the RFAGC register values. If YES at step S 94 , the processing flow goes to step S 95 . On the other hand, if NO at step S 94 , the processing flow goes to step S 96 .
- step S 95 the controller 50 calculates an inputted signal level Pin using the approximate function AF 61 based on the read-out IFAGC register value, and the processing flow goes to step S 100 .
- step S 96 the controller 50 calculates the inputted signal level Pin using the approximate function AF 62 based on the read-out RFAGC register value, and the processing flow goes to step S 100 .
- step-S 97 the controller 50 judges whether or not the read-out RFAGC register value is the maximum value of the RFAGC register values. If YES at step S 97 , the processing flow goes to step S 98 . On the other hand, if NO at step S 97 , the processing flow goes to step S 99 .
- step S 98 the controller 50 calculates the inputted signal level Pin using the approximate function AF 71 based on the read-out IFAGC register value, and the processing flow goes to step S 100 .
- step S 99 the controller 50 calculates the inputted signal level Pin using the approximate function AF 72 based on the read-out RFAGC register value, and the processing flow goes to step S 100 . Further, at step S 100 , the controller 50 generates display data for displaying the calculated inputted signal level Pin, and outputs the generated display data to an OSD controller 19 . The processing flow then returns to step S 91 .
- the fifth preferred embodiment by using the calculation of the approximate functions by dividing the frequency range of the broadcasting signal into the two ranges according to the second preferred embodiment in addition to such a use that the control flow is branched based on the condition of the inputted signal level according to the fourth preferred embodiment, accuracy for detecting the inputted signal level of the high-frequency signal can be more remarkably improved.
- FIGS. 23 and 24 are flowcharts showing a processing for generating a display control program, which is executed by a controller 60 of a measurement control system according to a sixth preferred embodiment.
- FIG. 25 is a flowchart showing a processing for controlling display, which is executed by a controller 50 according to the sixth preferred embodiment.
- the sixth preferred embodiment is characterized by detecting an inputted signal level based on such a condition as to whether or not the RFAGC register value is the maximum value thereof according to the fourth preferred embodiment in addition to such a use that the control flow is branched based on the condition of the inputted signal level according to the fourth preferred embodiment as well as the use of the calculation of approximate functions by dividing the frequency range of the broadcasting signal into the two ranges according to the second preferred embodiment.
- step S 101 with controlling a high-frequency signal generator 65 to change the inputted signal level of the high-frequency signal inputted to an input terminal 1 and having a minimum frequency f 1min of 57 MHz within a first, frequency range FR 1 from ⁇ 20 dBmV to + 20 dBmV every one dBmV, the controller 60 reads out.
- IFAGC register values and RFAGC register values corresponding to the respective inputted signal levels from an IFAGC register 33 and an RFAGC register 43 , respectively, and stores the read-out same values in a data memory 62 .
- step S 102 with controlling the high-frequency signal generator 65 to change the inputted signal level of the high-frequency signal inputted to the input terminal 1 and having a maximum frequency f 1max of 459 MHz within the first frequency range FR 1 and a minimum frequency f 2min of 459 MHz within a second frequency range FR 2 from ⁇ 20 dBmV to +20 dBmV every one dBmV, the controller 60 reads out IFAGC register values and RFAGC register values corresponding to the respective inputted signal levels from the IFAGC register 33 and the RFAGC register 43 , respectively, and stores the read-out same values in the data memory 62 .
- step S 103 with controlling the high-frequency signal generator 65 to change the inputted signal level of the high-frequency signal inputted to the input terminal 1 and having a maximum frequency f 2max of 861 MHz within the second frequency range FR 2 from ⁇ 20 dBmV to +20 dBmV every one dBmV, the controller 60 reads out IFAGC register values and RFAGC register values corresponding to the respective inputted signal levels from the IFAGC register 33 and the RFAGC register 43 , respectively, and stores the read-out same values in the data memory 62 .
- the controller 60 searches the maximum value of the RFAGC register values based on the measured RFAGC register values at the minimum frequency f 1min of the first frequency range FR 1 , and stores the searched maximum value thereof in the data memory 62 as the maximum value of the RFAGC register values within the first frequency range FR 1 .
- the controller 60 searches a range of the inputted signal levels when the RFAGC register value has the maximum value thereof, and sets the searched range as a level range LR 11 of the first frequency range FR 1 .
- the controller 60 sets the range of the inputted signal level when the RFAGC register value does not have the maximum value thereof as a level range LR 12 of the first frequency range FR 1 .
- the controller 60 searches the maximum value of the RFAGC register values based on the measured RFAGC register values at the minimum frequency f 2min in the second frequency range FR 2 , and stores the searched maximum values thereof within the data memory 62 as the maximum value of the RFAGC register values in the second frequency range FR 2 .
- the controller 60 searches a range of the inputted signal levels when the RFAGC register value has the maximum value thereof, and sets the searched range as a level range LR 21 of the second frequency range FR 2 .
- the controller 60 sets the range of the inputted signal levels when the RFAGC register value does not have the maximum value thereof as a level range LR 22 of the second frequency range FR 2 .
- the controller 60 calculates an approximate function AF 81 a of a relationship of the IFAGC register values to the respective inputted signal levels within the level range LR 11 at the minimum frequency f 1min within the first frequency range FR 1 based on the data representing this relationship.
- the controller 60 calculates an approximate function AF 81 b of a relationship of the RFAGC register values to the respective inputted signal levels within the level range LR 12 at the minimum frequency f 1min within the first frequency range FR 1 based on the data representing this relationship.
- the controller 60 calculates an approximate function AF 92 a of a relationship of the IFAGC register values to the respective inputted signal levels within the level range LR 21 at the maximum frequency f 2max within the second frequency range FR 2 based on the data representing this relationship.
- the controller 60 calculates an approximate function AF 92 b of a relationship of the RFAGC register values to the respective inputted signal levels within the level range LR 22 at the maximum frequency f 2max within the second frequency range FR 2 based on the data representing this relationship.
- the controller 60 generates a display control program ( FIG.
- step S 121 the controller 50 judges whether or not a command to display the inputted signal level is inputted from an input unit 53 . If YES at step S 121 , the processing flow goes to step S 122 . On the other hand, if NO at step S 121 , the processing flow returns to step S 121 .
- step S 122 the controller 50 reads out the IFAGC register value from an IFAGC register 33 and reads out the RFAGC register value from an RFAGC register value 43 .
- step S 123 the controller 50 judges whether or not a current reception frequency f rec is fallen within the first frequency range FR 1 . If YES at step S 123 , the processing flow goes to step S 124 . On the other hand, if NO at step S 123 , the processing flow goes to step S 127 .
- step S 124 the controller 50 judges whether or not the read-out RFAGC register value is the maximum value of the RFAGC register values. If YES at step S 124 , the processing flow goes to step S 125 . On the other hand, if NO at step S 124 , the processing flow goes to step S 126 .
- step S 125 the controller 50 calculates an inputted signal level P fmin at the minimum frequency f 1min using the approximate function AF 81 a and an inputted signal level P fmax at the maximum frequency f 1max using the approximate function AF 82 a based on the read-out IFAGC register value, and the processing flow goes to step S 130 .
- step S 126 the controller 50 calculates an inputted signal level P fmin at the minimum frequency f 1min using the approximate function AF 81 b and an inputted signal level P fmax at the maximum frequency f 1max using the approximate function AF 82 b based on the read-out RFAGC register value, and the processing flow goes to step S 130 .
- step S 127 the controller 50 judges whether or not the read-out RFAGC register value is the maximum value of the RFAGC register values. If YES at step S 127 , the processing flow goes to step S 128 . On the other hand, if NO at step S 127 , the processing flow goes to step S 129 .
- step S 128 the controller 50 calculates the inputted signal level P fmin at the minimum frequency f 1min using the approximate function AF 91 a and the inputted signal level P fmax at the maximum frequency f 1max using the approximate function AF 92 a based on the read-out IFAGC register value, and the processing flow goes to step S 130 .
- step S 129 the controller 50 calculates the inputted signal level P fmin at the minimum frequency f 1min using the approximate function AF 91 b and the inputted signal level P fmax at the maximum frequency f 1max using the approximate function AF 92 b based on the read-out RFAGC register value, and the processing flow goes to step S 130 .
- the controller 50 calculates an inputted signal level Pin using the equation (2) by the linear approximation method based on the calculated inputted signal levels P fmin and P fmax .
- the controller 50 generates display data for displaying the calculated inputted signal level Pin, and outputs the generated display data to an OSD controller 19 , thus finishing the processing for controlling display.
- the inputted signal level is detected based on condition as to whether or not the RFAGC register value is the maximum value thereof according to the fourth preferred embodiment in addition to such a use that the control flow is branched based on the inputted signal level according to the condition according to the fourth preferred embodiment as well as the use of the calculation of approximate functions by dividing the frequency range of the broadcasting signal into the two ranges according to the second preferred embodiment. Therefore, the accuracy for detecting the inputted signal level of the high-frequency signal can be further improved.
- FIG. 26 is a spectral view showing such a case that two interference signals on adjacent channels are present in the vicinity and on both sides of a reception channel for a television receiver 100 according to a seventh preferred embodiment.
- a spectral energy of a broadcasting signal on the adjacent channel is present on each or one side of the reception channel on which an inputted signal level is detected, there is caused such a problem that one or two interference signals due to a broadcasting signal on each adjacent channel causes a detected error in detection of the inputted signal level of the broadcasting signal.
- An intermediate frequency signal processing circuit such as the bandpass filter 8 shown in FIG. 1 does not exhibit a sharp bandpass filtering characteristic that the circuit can completely remove the interference signal on the adjacent channel.
- FIG. 27 is a graph showing IFAGC register values and RFAGC register values relative to inputted signal levels in three cases when the interference signal on adjacent channel is not present, when one interference signal is present, and when two interference signals are present, respectively, in the television receiver 100 according to the seventh preferred embodiment.
- display errors may be caused to the RFAGC register values and the IFAGC register values relative to the respective inputted signal levels.
- a detected error ER 1 is caused when one interference signal is present as compared with such a case that no interference signal is present
- a detected error ER 2 (>ER 1 ) is caused when two interference signals are present as compared with such a case that no interference signal is present.
- the detected error due to the interference signal is greater when the inputted signal level is almost equal to or larger than about ⁇ 10 dBmV (in other words, when the RFAGC register value is not the maximum value thereof).
- FIG. 27 exemplarily shows the above-stated three cases.
- various kinds of patterns of a relationship of a DU ratio of a broadcasting signal on a reception channel to a broadcasting signal on an adjacent channel are present. Therefore, according to the present preferred embodiment, such a case that the reception channel is located at an intermediate position in a channel allocation and that adjacent channels (two interference signals) are present on both sides of the reception channel, respectively, and such a case that the reception channel is located at an end in the channel allocation and that an adjacent channel (one interference signal) is present only on one side of the reception channel are considered.
- An approximate function AF 102 of the detected error ER 2 in the former case and an approximate function AF 101 for the detected error ER 1 in the latter case are measured in advance.
- a detection level of the inputted signal level of the received broadcasting signal is corrected using the detected error ER 1 or ER 2 calculated using the approximate function AF 101 or AF 102 based on the IFAGC register value, whose change amount is larger than that of the RFAGC register value.
- FIG. 28 is a graph showing the IFAGC register value relative to a ratio (U/D) of an interference signal power to a desired wave power in the television receiver 100 according to the seventh preferred embodiment. As apparent from FIG. 28 , as the ratio (U/D) of the interference signal power to the desired wave power becomes greater, the IFAGC register value also increases.
- FIG. 29 is a graph showing a display error ER 2 of the inputted signal level relative to the IFAGC register value in the television receiver 100 according to the seventh preferred embodiment.
- the approximate function AF 102 when two interference signals are present is shown.
- the approximate function AF 101 when one interference signal is present is calculated in advance.
- the present preferred embodiment is characterized as follows. By executing a processing for correcting the detected error shown in FIG. 30 using these two approximate functions AF 101 and AF 102 , the detected error in the inputted signal level can be corrected based on the IFAGC register value, in particular when the IFAGC register value is not the maximum value thereof and the detected error is relatively large.
- FIG. 30 is a flowchart that showing a characteristic part of a processing for controlling display, which is executed by a controller 50 according to the seventh preferred embodiment.
- the characteristic part of this processing relates to the processing for correcting the detected error, and is inserted between steps S 130 and S 131 shown in FIG. 25 .
- step S 141 the controller 50 judges whether or not the read-out RFAGC register value is the maximum value of the RFAGC values. If YES at step S 141 , the processing flow goes to step S 131 shown in FIG. 25 . On the other hand, if NO at step S 141 , the processing flow goes to step S 142 . At step S 142 , the controller 50 judges whether or not adjacent channels are present on the both sides of the reception channel. If YES at step S 142 , the controller 50 judges that two interference signals are present and the processing flow goes to step S 143 .
- step S 142 the controller 50 judges that one interference signal is present and the processing flow goes to step S 145 .
- step S 143 the controller 50 calculates the detected error ER 2 using the approximate function AF 102 of the detected error of the inputted signal level based on the read-out IFAGC register value.
- step S 144 the controller 50 sets the detected error ER 2 as a detected error ER, and the processing flow goes to step S 147 .
- step S 145 the controller 50 calculates the detected error ER 1 using the approximate function AF 101 of the detected error in the inputted signal level based on the read-out IFAGC register value.
- step S 144 the controller 50 sets the detected error ER 1 as the detected error ER, and the processing flow goes to step S 147 . Further, at step S 147 , the controller 50 adds the detected error ER to the previously calculated inputted signal level Pin, and sets an addition result as the inputted signal level Pin. Thereafter, the processing flow goes to step S 131 shown in FIG. 25 .
- the processing for correcting the detected error shown in FIG. 30 is executed using the two approximate functions AF 101 and AF 102 calculated in advance, and this leads to that the detected error in the inputted signal level is corrected based on the IFAGC register value, in particular when the IFAGC register is not the maximum value thereof and the detected error is relatively large. Then it is possible to remarkably improve the detected error in the inputted signal level of the broadcasting signal.
- control flow is branched into such a case of one interference signal and such another case of two interference signals at step S 142 .
- the latter case applies to most cases. Therefore, only the processing in the latter case may be executed. Further, an average value of the detected errors in these two cases may be used as the detected error and the inputted signal level may be corrected using this detected error.
- the processing for correcting the detected error according to the seventh preferred embodiment stated above is inserted between steps S 130 and S 131 shown in FIG. 25 .
- the present invention is not limited to this.
- the processing for correcting the detected error according to the present preferred embodiment may be executed for the detected value of the inputted signal level Pin in any of the first to fifth preferred embodiments stated above.
- the attenuation amount of the attenuator 4 is changed so as to control the gain for the high-frequency signal in the television receiver 100 shown in FIG. 1 .
- the preset invention is not limited to this.
- the amplification factor of the high-frequency amplifier 3 may be changed.
- the amplification factor of the intermediate frequency amplifier 7 is changed so as to control the gain for the intermediate frequency signal in the television receiver 100 shown in FIG. 1 .
- the present invention is not limited to this.
- the amplification ratio of the other intermediate frequency amplifier 9 or the attenuation amount of the attenuator inserted while the frequency is the intermediate frequency may be changed.
- the television receiver 100 shown in FIG. 1 has been described.
- the present invention is not limited to this.
- a part of a set-top box that includes a function of detecting the inputted signal level may be separately provided.
- a high-frequency signal level detection apparatus or a high-frequency signal receiver apparatus that include a function of detecting an inputted signal level of a high-frequency signal other than the broadcasting signal may be provided.
- the first relational data indicating the RFAGC value relative to the inputted signal level of the received high-frequency signal and the second relational data indicating the IFAGC value relative to the inputted signal level of the received high-frequency signal are measured in advance.
- the RFAGC value and the IFAGC value when the high-frequency signal to be measured is received are measured.
- the inputted signal level of the received high-frequency signal is detected using the measured first and second relational data. Therefore, it is possible to provide the high-frequency signal level detection apparatus capable of detecting the signal level of the high-frequency signal with accuracy higher than that of the prior art, and the high-frequency signal receiver apparatus using the same.
- the high-frequency signal level detection apparatus can be applied to, for example, a high-frequency signal receiver apparatus such as a set-top box or a television receiver that receives a radio broadcasting signal in addition to a CATV set-top box or a CATV television receiver.
- a high-frequency signal receiver apparatus such as a set-top box or a television receiver that receives a radio broadcasting signal in addition to a CATV set-top box or a CATV television receiver.
Abstract
Description
Pin=(Pif+Prf)/2 (1).
Claims (20)
Applications Claiming Priority (5)
| Application Number | Priority Date | Filing Date | Title |
|---|---|---|---|
| JP2003-115553 | 2003-04-21 | ||
| JP2003115553 | 2003-04-21 | ||
| JP2003327789 | 2003-09-19 | ||
| JP2003-327789 | 2003-09-19 | ||
| PCT/JP2004/005707 WO2004095725A1 (en) | 2003-04-21 | 2004-04-21 | High frequency signal level determining device and high frequency signal receiver apparatus using the same |
Publications (2)
| Publication Number | Publication Date |
|---|---|
| US20070041480A1 US20070041480A1 (en) | 2007-02-22 |
| US7551908B2 true US7551908B2 (en) | 2009-06-23 |
Family
ID=33312608
Family Applications (1)
| Application Number | Title | Priority Date | Filing Date |
|---|---|---|---|
| US10/553,902 Expired - Fee Related US7551908B2 (en) | 2003-04-21 | 2004-04-21 | High-frequency signal level detection apparatus and high-frequency signal receiver apparatus using the same |
Country Status (5)
| Country | Link |
|---|---|
| US (1) | US7551908B2 (en) |
| JP (1) | JP4249180B2 (en) |
| CA (1) | CA2522271A1 (en) |
| MX (1) | MXPA05011285A (en) |
| WO (1) | WO2004095725A1 (en) |
Cited By (1)
| Publication number | Priority date | Publication date | Assignee | Title |
|---|---|---|---|---|
| US20070287379A1 (en) * | 2004-09-01 | 2007-12-13 | Matsushita Electric Industrial Co., Ltd. | Mobile Terminal Apparatus |
Families Citing this family (5)
| Publication number | Priority date | Publication date | Assignee | Title |
|---|---|---|---|---|
| JP2006295363A (en) * | 2005-04-07 | 2006-10-26 | Nippon Hoso Kyokai <Nhk> | Reception level measurement device |
| JP4846368B2 (en) * | 2006-01-24 | 2011-12-28 | Dxアンテナ株式会社 | Amplifier for joint reception system |
| US8237870B2 (en) * | 2007-09-28 | 2012-08-07 | Intel Corporation | Receiver system for multiple bandwidth television channels |
| TWI389467B (en) * | 2009-04-08 | 2013-03-11 | Ind Tech Res Inst | Automatic gain control method and apparatus |
| US8953670B1 (en) * | 2013-10-25 | 2015-02-10 | Mitsubishi Electric Research Laboratories, Inc. | Digital power encoder for direct digital-RF transmitter |
Citations (19)
| Publication number | Priority date | Publication date | Assignee | Title |
|---|---|---|---|---|
| US4125809A (en) * | 1977-11-09 | 1978-11-14 | The United States Of America As Represented By The Secretary Of The Navy | Digital C/kT meter |
| US4189750A (en) * | 1977-12-29 | 1980-02-19 | Hans Sadel | Method and apparatus for measuring television sound and picture |
| US4501020A (en) * | 1982-09-15 | 1985-02-19 | Her Majesty In Right Of Canada | Spectrum surveillance receiver system |
| JPS6062246A (en) | 1983-09-16 | 1985-04-10 | Hitachi Ltd | Receiver |
| JPS6293843A (en) | 1985-09-30 | 1987-04-30 | アールシーエー トムソン ライセンシング コーポレイシヨン | Correcting apparatus of deflection distortion of video display |
| US5451839A (en) * | 1993-01-12 | 1995-09-19 | Rappaport; Theodore S. | Portable real time cellular telephone and pager network system monitor |
| JPH09199962A (en) | 1996-01-23 | 1997-07-31 | Sanyo Electric Co Ltd | Electric field strength detection circuit for radio receiver |
| JPH11355079A (en) | 1998-06-12 | 1999-12-24 | Sharp Corp | Automatic gain control circuit and tuner for receiving satellite broadcast |
| JP2000209118A (en) | 1999-01-14 | 2000-07-28 | Sharp Corp | Receiver |
| JP2001102947A (en) | 1999-09-29 | 2001-04-13 | Toshiba Corp | Automatic gain control circuit and receiver |
| JP2001186083A (en) | 1999-12-24 | 2001-07-06 | Toshiba Corp | Mobile wireless terminal |
| US6310646B1 (en) * | 1996-11-29 | 2001-10-30 | Wavetek Corporation | Method and apparatus for measuring a radio frequency signal having program information and control information |
| JP2002084205A (en) | 2000-06-26 | 2002-03-22 | Matsushita Electric Ind Co Ltd | Automatic gain controller |
| JP2002217763A (en) | 2001-01-19 | 2002-08-02 | Sony Corp | Input level display method, input level display device |
| US20020131533A1 (en) | 2001-03-19 | 2002-09-19 | Haruo Koizumi | Automatic gain control method and automatic gain control circuit |
| US6668164B2 (en) * | 2000-06-01 | 2003-12-23 | Motorola, Inc. | Method and apparatus for reducing intermodulation distortion in a low current drain automatic gain control system |
| US6934522B2 (en) | 2000-06-26 | 2005-08-23 | Matsushita Electric Industrial Co., Ltd. | Automatic gain control apparatus |
| US6996383B2 (en) * | 2000-05-30 | 2006-02-07 | Motorola, Inc. | Digitized automatic gain control system and methods for a controlled gain receiver |
| US7006824B1 (en) * | 2002-09-10 | 2006-02-28 | Marvell International Ltd. | Frame/packet-based calibration for wireless transceivers |
-
2004
- 2004-04-21 US US10/553,902 patent/US7551908B2/en not_active Expired - Fee Related
- 2004-04-21 JP JP2005505761A patent/JP4249180B2/en not_active Expired - Fee Related
- 2004-04-21 MX MXPA05011285A patent/MXPA05011285A/en active IP Right Grant
- 2004-04-21 CA CA002522271A patent/CA2522271A1/en not_active Abandoned
- 2004-04-21 WO PCT/JP2004/005707 patent/WO2004095725A1/en active Application Filing
Patent Citations (21)
| Publication number | Priority date | Publication date | Assignee | Title |
|---|---|---|---|---|
| US4125809A (en) * | 1977-11-09 | 1978-11-14 | The United States Of America As Represented By The Secretary Of The Navy | Digital C/kT meter |
| US4189750A (en) * | 1977-12-29 | 1980-02-19 | Hans Sadel | Method and apparatus for measuring television sound and picture |
| US4501020A (en) * | 1982-09-15 | 1985-02-19 | Her Majesty In Right Of Canada | Spectrum surveillance receiver system |
| JPS6062246A (en) | 1983-09-16 | 1985-04-10 | Hitachi Ltd | Receiver |
| JPS6293843A (en) | 1985-09-30 | 1987-04-30 | アールシーエー トムソン ライセンシング コーポレイシヨン | Correcting apparatus of deflection distortion of video display |
| US5451839A (en) * | 1993-01-12 | 1995-09-19 | Rappaport; Theodore S. | Portable real time cellular telephone and pager network system monitor |
| JPH09199962A (en) | 1996-01-23 | 1997-07-31 | Sanyo Electric Co Ltd | Electric field strength detection circuit for radio receiver |
| US6310646B1 (en) * | 1996-11-29 | 2001-10-30 | Wavetek Corporation | Method and apparatus for measuring a radio frequency signal having program information and control information |
| JPH11355079A (en) | 1998-06-12 | 1999-12-24 | Sharp Corp | Automatic gain control circuit and tuner for receiving satellite broadcast |
| JP2000209118A (en) | 1999-01-14 | 2000-07-28 | Sharp Corp | Receiver |
| US6650878B1 (en) | 1999-09-29 | 2003-11-18 | Kabushiki Kaisha Toshiba | Automatic gain control circuit and receiver having the same |
| JP2001102947A (en) | 1999-09-29 | 2001-04-13 | Toshiba Corp | Automatic gain control circuit and receiver |
| JP2001186083A (en) | 1999-12-24 | 2001-07-06 | Toshiba Corp | Mobile wireless terminal |
| US6996383B2 (en) * | 2000-05-30 | 2006-02-07 | Motorola, Inc. | Digitized automatic gain control system and methods for a controlled gain receiver |
| US6668164B2 (en) * | 2000-06-01 | 2003-12-23 | Motorola, Inc. | Method and apparatus for reducing intermodulation distortion in a low current drain automatic gain control system |
| JP2002084205A (en) | 2000-06-26 | 2002-03-22 | Matsushita Electric Ind Co Ltd | Automatic gain controller |
| US6934522B2 (en) | 2000-06-26 | 2005-08-23 | Matsushita Electric Industrial Co., Ltd. | Automatic gain control apparatus |
| JP2002217763A (en) | 2001-01-19 | 2002-08-02 | Sony Corp | Input level display method, input level display device |
| US20020131533A1 (en) | 2001-03-19 | 2002-09-19 | Haruo Koizumi | Automatic gain control method and automatic gain control circuit |
| JP2002280852A (en) | 2001-03-19 | 2002-09-27 | Sharp Corp | Automatic gain control method, and, automatic gain control circuit |
| US7006824B1 (en) * | 2002-09-10 | 2006-02-28 | Marvell International Ltd. | Frame/packet-based calibration for wireless transceivers |
Cited By (1)
| Publication number | Priority date | Publication date | Assignee | Title |
|---|---|---|---|---|
| US20070287379A1 (en) * | 2004-09-01 | 2007-12-13 | Matsushita Electric Industrial Co., Ltd. | Mobile Terminal Apparatus |
Also Published As
| Publication number | Publication date |
|---|---|
| MXPA05011285A (en) | 2006-05-25 |
| WO2004095725A1 (en) | 2004-11-04 |
| JP4249180B2 (en) | 2009-04-02 |
| US20070041480A1 (en) | 2007-02-22 |
| CA2522271A1 (en) | 2004-11-04 |
| JPWO2004095725A1 (en) | 2006-07-13 |
Similar Documents
| Publication | Publication Date | Title |
|---|---|---|
| US5659582A (en) | Receiver, automatic gain controller suitable for the receiver, control signal generator suitable for the automatic gain controller, reception power controller using the automatic gain controller and communication method using the receiver | |
| US5376941A (en) | Antenna direction adjusting method and apparatus for satellite broadcasting receiving system | |
| CN103703683A (en) | Reception device, and gain control method | |
| EP1179887B1 (en) | Overload distortion protection for a wideband receiver | |
| US7623601B2 (en) | Controlling gain in a satellite receiver | |
| KR100497265B1 (en) | Digital broadcast receiver and signal level display method | |
| US7551908B2 (en) | High-frequency signal level detection apparatus and high-frequency signal receiver apparatus using the same | |
| US6496017B2 (en) | Measuring antenna signal strength with automatic gain control receiver | |
| US5313651A (en) | Satellite broadcast receiver | |
| US8041322B2 (en) | RF receiver device | |
| US20020089608A1 (en) | Broadcast receiving system and method, and medium storing a broadcast reception control program | |
| EP0505072B1 (en) | Signal strength indicator for receiver | |
| US7274409B2 (en) | Dynamically controlled tuner AGC attack point | |
| US11277162B2 (en) | Adjacent channel suppression based on adjacent channel properties in FM radio broadcast receivers | |
| JP4842506B2 (en) | Signal level measuring device | |
| KR101332051B1 (en) | Signal processing apparatus, system and method for automatic gain control using the same | |
| US10153855B2 (en) | Broadcast receiver and control method thereof | |
| JP2002217763A (en) | Input level display method, input level display device | |
| EP3128676A1 (en) | Receiving device | |
| JP2005069765A (en) | Intermodulation distortion measuring device and its measuring method | |
| US6967693B2 (en) | Television signal transmitter including a bandpass filter without tracking error | |
| KR0162437B1 (en) | Frequency a.f.t device & method of digital satellite broadcasting receiver | |
| JP2005192060A (en) | Automatic gain control apparatus | |
| JP4006275B2 (en) | Signal level measuring device | |
| US8451376B1 (en) | Automatic gain control (AGC) for analog TV signals using feed-forward signal path delay |
Legal Events
| Date | Code | Title | Description |
|---|---|---|---|
| AS | Assignment |
Owner name: MATSUSHITA ELECTRIC INDUSTRIAL CO., LTD., JAPAN Free format text: ASSIGNMENT OF ASSIGNORS INTEREST;ASSIGNORS:AZAKAMI, HIROSHI;TESHIMA, MISAO;SASAKI, SHOUGO;AND OTHERS;REEL/FRAME:017613/0134;SIGNING DATES FROM 20060425 TO 20060427 |
|
| AS | Assignment |
Owner name: PANASONIC CORPORATION, JAPAN Free format text: CHANGE OF NAME;ASSIGNOR:MATSUSHITA ELECTRIC INDUSTRIAL CO., LTD.;REEL/FRAME:021897/0570 Effective date: 20081001 Owner name: PANASONIC CORPORATION,JAPAN Free format text: CHANGE OF NAME;ASSIGNOR:MATSUSHITA ELECTRIC INDUSTRIAL CO., LTD.;REEL/FRAME:021897/0570 Effective date: 20081001 |
|
| FEPP | Fee payment procedure |
Free format text: PAYOR NUMBER ASSIGNED (ORIGINAL EVENT CODE: ASPN); ENTITY STATUS OF PATENT OWNER: LARGE ENTITY |
|
| FPAY | Fee payment |
Year of fee payment: 4 |
|
| REMI | Maintenance fee reminder mailed | ||
| LAPS | Lapse for failure to pay maintenance fees | ||
| STCH | Information on status: patent discontinuation |
Free format text: PATENT EXPIRED DUE TO NONPAYMENT OF MAINTENANCE FEES UNDER 37 CFR 1.362 |
|
| FP | Lapsed due to failure to pay maintenance fee |
Effective date: 20170623 |