US7730434B2 - Contactless technique for evaluating a fabrication of a wafer - Google Patents
Contactless technique for evaluating a fabrication of a wafer Download PDFInfo
- Publication number
- US7730434B2 US7730434B2 US10/927,275 US92727504A US7730434B2 US 7730434 B2 US7730434 B2 US 7730434B2 US 92727504 A US92727504 A US 92727504A US 7730434 B2 US7730434 B2 US 7730434B2
- Authority
- US
- United States
- Prior art keywords
- wafer
- fabrication
- locations
- die
- performance parameter
- Prior art date
- Legal status (The legal status is an assumption and is not a legal conclusion. Google has not performed a legal analysis and makes no representation as to the accuracy of the status listed.)
- Expired - Fee Related, expires
Links
Images


Classifications
-
- H—ELECTRICITY
- H01—ELECTRIC ELEMENTS
- H01L—SEMICONDUCTOR DEVICES NOT COVERED BY CLASS H10
- H01L22/00—Testing or measuring during manufacture or treatment; Reliability measurements, i.e. testing of parts without further processing to modify the parts as such; Structural arrangements therefor
- H01L22/20—Sequence of activities consisting of a plurality of measurements, corrections, marking or sorting steps
-
- G—PHYSICS
- G01—MEASURING; TESTING
- G01R—MEASURING ELECTRIC VARIABLES; MEASURING MAGNETIC VARIABLES
- G01R31/00—Arrangements for testing electric properties; Arrangements for locating electric faults; Arrangements for electrical testing characterised by what is being tested not provided for elsewhere
- G01R31/28—Testing of electronic circuits, e.g. by signal tracer
- G01R31/282—Testing of electronic circuits specially adapted for particular applications not provided for elsewhere
- G01R31/2831—Testing of materials or semi-finished products, e.g. semiconductor wafers or substrates
-
- G—PHYSICS
- G01—MEASURING; TESTING
- G01R—MEASURING ELECTRIC VARIABLES; MEASURING MAGNETIC VARIABLES
- G01R31/00—Arrangements for testing electric properties; Arrangements for locating electric faults; Arrangements for electrical testing characterised by what is being tested not provided for elsewhere
- G01R31/28—Testing of electronic circuits, e.g. by signal tracer
- G01R31/302—Contactless testing
- G01R31/3025—Wireless interface with the DUT
-
- G—PHYSICS
- G01—MEASURING; TESTING
- G01R—MEASURING ELECTRIC VARIABLES; MEASURING MAGNETIC VARIABLES
- G01R31/00—Arrangements for testing electric properties; Arrangements for locating electric faults; Arrangements for electrical testing characterised by what is being tested not provided for elsewhere
- G01R31/28—Testing of electronic circuits, e.g. by signal tracer
- G01R31/317—Testing of digital circuits
- G01R31/31707—Test strategies
-
- G—PHYSICS
- G01—MEASURING; TESTING
- G01R—MEASURING ELECTRIC VARIABLES; MEASURING MAGNETIC VARIABLES
- G01R31/00—Arrangements for testing electric properties; Arrangements for locating electric faults; Arrangements for electrical testing characterised by what is being tested not provided for elsewhere
- G01R31/28—Testing of electronic circuits, e.g. by signal tracer
- G01R31/317—Testing of digital circuits
- G01R31/31718—Logistic aspects, e.g. binning, selection, sorting of devices under test, tester/handler interaction networks, Test management software, e.g. software for test statistics or test evaluation, yield analysis
-
- G—PHYSICS
- G01—MEASURING; TESTING
- G01R—MEASURING ELECTRIC VARIABLES; MEASURING MAGNETIC VARIABLES
- G01R31/00—Arrangements for testing electric properties; Arrangements for locating electric faults; Arrangements for electrical testing characterised by what is being tested not provided for elsewhere
- G01R31/28—Testing of electronic circuits, e.g. by signal tracer
- G01R31/317—Testing of digital circuits
- G01R31/3181—Functional testing
- G01R31/3185—Reconfiguring for testing, e.g. LSSD, partitioning
- G01R31/318505—Test of Modular systems, e.g. Wafers, MCM's
- G01R31/318511—Wafer Test
-
- H—ELECTRICITY
- H01—ELECTRIC ELEMENTS
- H01L—SEMICONDUCTOR DEVICES NOT COVERED BY CLASS H10
- H01L22/00—Testing or measuring during manufacture or treatment; Reliability measurements, i.e. testing of parts without further processing to modify the parts as such; Structural arrangements therefor
- H01L22/30—Structural arrangements specially adapted for testing or measuring during manufacture or treatment, or specially adapted for reliability measurements
- H01L22/34—Circuits for electrically characterising or monitoring manufacturing processes, e. g. whole test die, wafers filled with test structures, on-board-devices incorporated on each die, process control monitors or pad structures thereof, devices in scribe line
-
- H—ELECTRICITY
- H01—ELECTRIC ELEMENTS
- H01L—SEMICONDUCTOR DEVICES NOT COVERED BY CLASS H10
- H01L2924/00—Indexing scheme for arrangements or methods for connecting or disconnecting semiconductor or solid-state bodies as covered by H01L24/00
- H01L2924/0001—Technical content checked by a classifier
- H01L2924/0002—Not covered by any one of groups H01L24/00, H01L24/00 and H01L2224/00
Definitions
- the present invention generally relates to fabrication of semiconductor components, and more specifically to ways in which the fabrication of such devices can be evaluated.
- Semiconductor components such as microprocessors are formed from high-density integrated circuits (ICs). Typically, these components are manufactured by processing a semiconductor wafer (e.g. Silicon, or Gallium Arsenide). The wafer may be fabricated so that transistors, the switch elements, and other elements (e.g. resistors, capacitance, wiring layers etc.) are printed and formed in predetermined patterns, configurations, and locations. Once the wafer has been fully processed and passivated (to protect from the environment), it is diced into separate die, packaged onto carriers and subjected through final test and characterization.
- ICs integrated circuits
- a fabrication process for a wafer comprises performing such steps in a designated order, and in a particular manner, so that a desired pattern, formation, and configuration of transistors, devices, and other integrated circuit elements are formed for individual semiconductor components (e.g. “chips”) that comprise the wafer.
- Each process step requires the use of ultra-sensitive machinery and techniques. Accordingly, it is often desirable to continuously monitor the quality of the fabrication process. If problems, such as defects and/or process excursions are encountered in the fabrication and detected quickly, the fabricator can take remedial action.
- These parameters may be determined by means of optical and electron beam techniques, including, for example, spectroscopic ellipsometry, reflectometry, and critical dimension scanning electron microscopy (CD-SEM).
- measurements are made to verify certain physical parameters such as gate width, gate-oxide thickness, interconnect width, and dielectric height. Under such an approach, the measurements are normally made on test structures in the wafer scribe area, adjacent to the active portion of the chips.
- the techniques may require destruction of the semiconductor component, or have little value in indicating at what point the fabrication process failed or had an unexpected outcome.
- the conventional inspection and review techniques have a high incidence of false counts, resulting from the presence of real defects that leave no electrical signature, and nuisance counts, which are caused by poor signal to noise ratio for very small defects.
- these techniques cannot accurately predict the real-life and final electrical characteristics of the measured device or chip.
- the existing electrical inspection techniques are very time-consuming and, therefore, cost prohibitive and they cannot be used to study large areas of the wafer in a routine manner.
- test structures in the scribe area provides little information on components in the active area chip areas of the wafer.
- the scribe area is known to deviate from the micro-loading issues resulting from pattern density variation in the active area of the wafer, and as such, is not well suited for forecasting in-chip variations resulting from local process variation.
- the scribe area of the wafer is discarded during the chip sawing process and is not suitable, therefore, for measurements post fabrication.
- Examples of parametric measurements include the measurements of transistor threshold voltage and off-current leakage. During these measurements, electrical and process tests constant (DC) voltage or small-signal (AC) voltage is applied to predetermined locations on the wafer to activate the device structures at several discrete locations across the wafer in the scribe area. In one specific technique, the integrity of the process is verified by comparing the values of the measured DC circuit parameters with a set of expected values.
- DC constant
- AC small-signal
- the electrical in-line test methods results are poorly suited for characterizing process parameters. For example, any specific observed deviation in one parameter of an integrated circuit may be caused by deviations in a number of process parameters.
- the conventional DC measurements are poor indicators of at-speed circuit performance. Most importantly, these parametric measurements are confined to the scribe area of the wafer, which as detailed above, is problematic.
- FIG. 1A is a simplified block diagram of a system for obtaining evaluation information on how a wafer is fabricated, under an embodiment of the invention.
- FIG. 1B illustrates locations on a wafer where measurements of performance parameters may be made.
- FIG. 1C illustrates a chip on which performance parameter measurements are made for purpose of evaluating fabrication of a wafer and/or of the chip.
- FIG. 2 illustrates a method for evaluating how process steps in a fabrication of a chip are performed, under an embodiment of the invention.
- FIG. 3 illustrates process steps which may be evaluated based on corresponding fabrication characteristics that are associated with measurements of performance parameters within the chip.
- FIG. 4 is a block diagram of how a process-sensitive test structure may be used to evaluate a fabrication of a wafer, under an embodiment.
- FIG. 5 illustrates a method for using process-sensitive test structures to determine evaluation information about a fabrication of a wafer, under an embodiment.
- FIG. 6 illustrates another method for using process-sensitive test structures to determine evaluation information about a fabrication of a wafer, under an embodiment.
- FIG. 7A is a diagram illustrating aspects of a suitable building block circuit element for CMOS technology, under an embodiment.
- FIG. 7B illustrates a process-sensitive test structure composed of identical building blocks that can be formed on an active portion of a semiconductor component
- FIGS. 7C and 7D illustrate use of a delay sensitive element in a circuit comprising one or more inverters
- FIG. 8 is a representative example of how a method such as described with FIG. 6 may be performed.
- FIGS. 9A-9E illustrate different circuit elements that can be formed on the active portion of a semiconductor component and configured for the purpose of making time-delay or phase shift to exaggerate the performance sensitivity of these circuit elements to process steps.
- the circuit elements include length and width PSTS
- the circuit elements include interconnect resistance PSTS
- the circuit elements include interconnect capacitance PSTS.
- the circuit elements include gate capacitance PSTS, with consideration for width/length rations.
- circuit elements include gate capacitance PSTS, with consideration for use of equivalent capacitances.
- FIG. 10 illustrates a process-sensitive test structure that can be formed on the active portion of a semiconductor component and configured for the purpose of making time-delay or phase shift measurements to exaggerate and correlate the offset between CD SEM measurements and electrical CD measurements.
- FIG. 11 is a representative block diagram illustrating a scheme to populate a partially fabricated chip with test structures that can then be used to measure performance parameters correlated with fabrication steps.
- FIG. 12 illustrates a method for using a test structure when the test signal and power for that test structure are generated from within a chip on a wafer.
- FIG. 13A illustrates a circuit for regulating an input voltage created by an external power source.
- FIG. 13B illustrates a circuit for regulating an input voltage created by an external power source while enabling feedback to the laser source.
- FIG. 13C illustrates a circuit for regulating an input voltage created by an external power source while enabling feedback to the laser source that can be co-located in the die active area with other components.
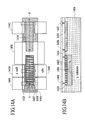
- FIGS. 14A and 14B illustrate an embodiment in which a thermoelectric mechanism is coupled with a laser or other energy source in order to cause in-chip generation of a power or test signal.
- FIG. 15 illustrates a system for detecting and measuring electrical activity from designated locations on a wafer, according to an embodiment.
- FIG. 16 provides additional details for an apparatus that induces and measures electrical activity from within designated locations of a chip, according to one embodiment of the invention.
- FIG. 17 illustrates a chip configured according to an embodiment of the invention.
- FIG. 18 describes a method for operating an apparatus such as described in FIGS. 15-16 , according to one embodiment of the invention.
- Embodiments described herein provide systems, methods, structures and other techniques for analyzing the fabrication of a wafer.
- embodiments described herein provide for obtaining information about how the wafer's fabrication is performed from numerous locations on the wafer with co-located power, test and detection structures, including from within the active regions of individual die that comprise the wafer.
- the information is obtained in a non-contact, non-invasive manner that does not affect the usability of the wafer and/or suitability of the wafer for subsequent wafer processing.
- the results and attributes of fabrication steps or sequences, including process variations that occur inside the active regions of the die or elsewhere in the wafer may be detected, evaluated and/or analyzed.
- Embodiments of the invention provide for making in-chip measurements of certain performance-related parameters (“performance parameters”) for purpose of evaluating the fabrication of a chip or wafer.
- the chip may correspond to the product that results when individual die of a wafer or diced and separated in a post-fabrication phase. Numerous chips may result from a diced wafer.
- the die corresponds to an area between scribe lines of a wafer.
- An active portion of the die is where active, discrete and integrated circuit elements that will be part of the chips' functionality may reside.
- a specific performance parameter is interpreted from, or otherwise based on an observed electrical activity occurring at predetermined locations within the chip or die of the wafer.
- a specific electrical activity may be induced or inherent to these designated locations and the performance parameter that is interpreted or based on the activity relates to a characteristic of the chip, die or wafer.
- Measurement variance of a plurality of these measurements is referred to as “variance”.
- a determination of performance parameters at designated locations is indicative of a characteristic of the die.
- Measurement variance of a plurality of these measurements in which the location of where the measurement was collected from is referred to as “spatial variance”, and is often useful to identify, or fingerprint, a specific process step.
- the performance parameters are indicative of a characteristic of the device, die, scribe or wafer that is attributable to one or more of the processes in the fabrication of the wafer.
- the measurements of the performance parameters provide information that is effective for evaluating the fabrication of the chip.
- the measurements of the performance parameters may correlate to a portion of the die having a specific unwanted or unexpected result from the performance of a fabrication step or sequence. This result may be sufficiently isolated from other properties of the chip, such that the specific fabrication step or sequence that contributed to the value of the performance parameter may be identified. Furthermore, it may be possible to determine information about how the identified step or sequence performed from the value of one or more performance parameters in the chip.
- electrical activity is induced from designated locations on the wafer.
- the electrical activity may be induced such that the interpreted performance parameter has a value that is exaggerated in the presence or absence of properties that result from one or more specific fabrication steps.
- one manner for inducing electrical activity is to use specialized, process-sensitive test structures to process test signals. Numerous types of electrical activity can be induced and/or measured to evaluate fabrication, including for example, optical, optoelectronic, and radio frequency signals.
- the use of such test structures may yield performance parameter values that are dependent almost exclusively on one or more fabrication steps, or at least on a distinct set of fabrication steps.
- Other embodiments may use non-test structures (such as product devices) known to produce, emit or exhibit specific properties as a result of certain physical attributes being present on the active portion of the chip.
- electrical activity may be inherent at designated locations on the wafer, and performance parameters may be determined from the inherent activity which have correlation to the fabrication of the wafer.
- a sensitive measurement apparatus may be used to measure performance parameters from circuit elements that would be used in the normal operation of the chip, where the measured performance parameters spatial variation can be correlated to a specific step or sequence.
- the specific fabrication step or sequence that is correlated or otherwise identifiable from the measurement may be known to be the result of, caused by, or otherwise affected by specific process steps in the fabrication, or by a manner in which the fabrication was implemented.
- FIG. 1A is a block diagram depicting an embodiment of the invention.
- a probe apparatus 102 applies a stimulus 101 over designated locations of a wafer 110 , and in response to the stimulus 101 , detects and measures electrical activity 105 from the designated locations.
- the wafer 110 may be either partially or completely fabricated.
- the electrical activity may be detected with any one or more of the following: optoelectronic photonic effects and signals (e.g. hot electron photon emissions, charge-induced electro-absorption or electro-rectification), voltage contrast phenomena, electromagnetic signals (such as radio frequency or inductive signals), and/or other signals or affects that are detectable through a contact-less medium.
- the electrical activity 105 may correspond to one or more chip-specific performance parameters 106 .
- the detected and measured performance parameters 106 may be reviewed, analyzed or otherwise evaluated in order to determine a result, variation, or characteristic indicative of the quality of the chip, die and/or wafer, or one or more specific processes, steps, or process step sequences in the fabrication of the wafer 110 .
- the detected and measured performance parameters 106 may also detect variation on different locations of the die or wafer that are induced by design density variations.
- the performance parameters yield information about some, but not all fabrication processes performed prior to the electrical activity being detected. Thus, such an embodiment enables specific fabrication processes that cause process variations to be identified and evaluated.
- probe apparatus 102 causes the electrical activity 105 to occur by directing a signal or an energy beam at the designated locations of the wafer 110 .
- Designated elements on the wafer 110 may generate or exhibit the electrical activity 105 in response to this applied stimulus 101 .
- the resulting electrical activity 105 is interpreted by probe apparatus 102 as one or more performance parameters 106 .
- performance parameters that can be interpreted from electrical activity 105 include measurements of gate switching speed, propagation delays, phase shifts and/or slew rates, measured at the designated locations of the wafer 110 .
- An analysis may be performed to relate the performance parameters 106 to specific processes, process steps, and process step sequences, including tools or modules used to perform the processes and steps. This may involve analyzing location variations, or spatial variation, of attributes or results of specific fabrication steps or sequences on wafer regions, including on active regions of individual die.
- the performance parameters may be used to obtain evaluation information 107 for evaluating a result, implementation, effectiveness, or performance of a fabrication step, sequence or process including how closely the results of the fabrication step or process were predicted.
- the evaluation information 107 may be based on comparing performance parameters values at different locations of the wafer 110 , determining spatial or other kinds of variations in the performance parameter values over regions of the wafer 110 , and other variances.
- the evaluation information 107 and other analysis of the performance parameter values may involve comparing performance parameter values at different locations within the same chip, on internal locations of different chips, between scribe regions and one or more intra-chip locations, as well as other comparative points on the wafer 110 .
- a tool 109 such as a computer system, module, or software/systems program/module, may be used to perform the analysis that determines the evaluation information 107 from the performance parameters 106 .
- the tool 109 may be part of a data acquisition system.
- the analysis may correlate the performance parameters 106 to characteristics of one or more fabrication steps 108 or processes.
- tool 109 may correlate the performance parameters 106 to fabrication steps that result in and from the presence of resistivity and capacitance variations in metals, or to the presence of variations in gate lengths and trench shapes.
- the identification of fabrication steps 108 may implicate a module or tool used in performing that fabrications step.
- the evaluation information 107 may include any data that, either by itself or in combination with other data or information, is informative as to how one or more fabrication steps were performed.
- the evaluation information 107 may be statistical in nature, so that multiple wafers are fabricated before a statistical distribution derived from the evaluation information is indicative of a process variation or other aspect of how certain fabrication steps or processes were performed.
- the evaluation information 107 from one region of one wafer may be determinative of how a particular fabrication step or sequence was performed.
- the evaluation information 107 may also include calibration data, which can be used to gain perspective of other evaluation information.
- evaluation information 107 may be derived from any location on wafer 110 (including as described in FIG. 1B , within the active region of a die), an embodiment provides that process variations and faults that affect in-chip devices may be more readily identified. However, the evaluation information 107 may also be used to identify fabrication steps that were performed adequately, in order to isolate other fabrication steps that are problematic through elimination.
- FIG. 1B illustrates how fabrication may be analyzed on different regions of the wafer 110 , according to an embodiment.
- wafer 110 is assumed to be in a partially fabricated state.
- the wafer 110 includes a plurality of scribe regions 121 that define a plurality of die 127 .
- a dicing channel 125 may also be formed in the scribe regions 121 in between rows and columns of die 127 .
- Each die 127 may include an active area 128 (e.g. chip) and an inactive area 129 .
- the scribe lines 123 serve as boundaries between adjacent die 127 .
- electrical activity may be observed on designated locations of the wafer 110 .
- These designated locations include scribe line locations 134 , die channel locations 135 , active die locations 136 , and inactive die locations 138 .
- the scribe line locations 134 may be sufficiently proximate to the active area 128 of the corresponding die that those scribe line locations 134 fall within the residual die material of the chip, after the wafer 110 is diced.
- the designated locations may also include active die locations 148 of perimeter die elements 146 .
- the perimeter die elements 146 often are “throw-away” elements, as their presence on the edge of the wafer prohibit full functional operation of that die as a chip.
- embodiments described herein use the perimeter die elements 146 to measure performance parameters, and to evaluate fabrication, particularly on locations of the wafer 110 that approach the wafer's perimeter.
- electrical activity 105 is detected and interpreted as a particular kind of performance parameter at locations that include scribe line locations 134 , die channel locations 135 , active die locations 136 , inactive die locations 138 , and/or active die locations 148 of perimeter die 146 .
- Comparisons of the different performance parameter values may be made in order to determine evaluation information. For example, comparisons of performance parameter values may be made amongst active die locations 136 of the same die 127 in order to determine process variations on that region of the wafer 110 .
- the comparisons of performance parameter values may also be made amongst active die locations 136 of different die, amongst or between inactive die locations 138 and active die locations 136 of the same or different die, and amongst scribe line locations 134 .
- scribe line locations 134 and adjacent active die locations 136 may show how specific fabrication steps were performed on the periphery of the wafer 110 . On occasion, process variations could be more severe on the wafer perimeter.
- electrical activity 105 is induced to occur, at least to the levels detected and measured, in a manner that enables performance parameters derived from the electrical activity to be exaggerated (e.g. amplified or filtered), depending primarily on one or more steps in the fabrication of the wafer 110 at the particular location where the performance parameter is measured.
- the performance parameters determined from the electrical activity 105 represent an underlying fabrication characteristic of the individual die 150 and/or wafer 110 . There may be hundred, thousands, or even more such measurements made on any particular wafer 110 . Furthermore, such measurements may be made repeatedly, after completion of one or more fabrication processes. It is also possible to use the same exact locations to repeatedly measure for performance parameters.
- performance parameters are determined from measurements of electrical activity at active die locations 138 of wafer 110 , as opposed to physical measurements and/or electrical-tests conducted in the non-active areas of the chip or off-chip/die in the scribe.
- the present technique allows direct measurement of performance parameters in the active area of individual die, in contrast to physical measurements in the active area which at best infer indirect correlation to the final performance of the device and chip, and thereby the process robustness.
- Embodiments then relate performance parameters and their variations to isolated process step(s) and/or sequence(s).
- Different values of performance parameters may be evaluated or analyzed in order to obtain information, an indication, or even an identification, of specific processes in the fabrication of the wafer 110 . These processes may result in, for example, a particular physical or electrical property, and the presence of this property at a particular location may be reflected in the value of the performance parameter.
- the value of each determined performance parameter is primarily dependent on the performance of a fabrication step or process.
- a correlation may be made between a performance parameter and a fabrication characteristic that is known to be related to a particular fabrication step, process or technique.
- the values of the performance parameter at different locations on the wafer may be analyzed to determine an understanding of how the fabrication characteristic exists on a particular chip. This understanding may then be used to evaluate the related fabrication process, including determining how that process was performed, what results it yielded, and whether the results matched what was intended.
- FIG. 1C illustrates how performance parameter values may be used within the confines of a die in order to evaluate fabrication of the die and/or its wafer.
- die 150 includes an active region 152 and an inactive region 154 .
- Different classes of performance parameters may be identified and measured on the die 150 , and in particular, in the active region 152 . This is in contrast to some conventional approaches, which take measurements of performance parameters only in the scribe.
- each class of performance parameter corresponds to one or more fabrication steps, processes or characteristics. Different classes of performance parameters may be measured from the wafer die 150 by inducing electrical activity of a specific type from designated locations of the die.
- Performance parameters may be analyzed by determining a variance amongst multiple performance parameters measured from the die 150 at different locations.
- a spatial variance is determined for a particular class of performance parameters disposed within the active region 152 .
- the analysis involves comparing performance parameters of different classes, such as in the case of electrical activity resulting from structures disposed on die 150 and having different designs and/or configurations. For example, a spatial variance of the values of a class of performance parameters is used to determine information about the fabrication processes used to form the die 150 .
- different classes of performance parameter measurements may be used to formulate a performance map of the die 150 .
- the map may provide an indication of a value or presence of different fabrication characteristics on the die 150 .
- the map may provide information for evaluating numerous processes in the fabrication of die 150 or its wafer, both before and after their respective fabrication completions.
- the locations of the die 150 , or its wafer 110 , in which performance parameter values are measured may be provided mechanisms, structures, and/or integrated circuit elements that exaggerate performance parameter measurements based on the presence or absence of one or more characteristics of fabrication steps or processes.
- the value of one performance parameter may be primarily attributable to one fabrication step, or a particular subset of the fabrication steps.
- designated locations of the die 150 are selected for purpose of making measurements of performance-related parameters.
- the designated locations are labeled in sets (A 1 -A n , B 1 -B N . . . D 1 -D n etc.).
- a 1 -A n a particular performance parameter is measured, where each performance parameter in the set is based on a particular kind of electrical activity.
- Each set of performance parameters may correspond to a class, in that the measurements are made from structures having a common design or feature, and/or yielding the same fabrication step dependence.
- each class of performance parameters may be measured from electrical activity that is induced or designed to accentuate one fabrication step or sequence over other fabrication steps/sequences.
- this electrical activity can be induced or designed to be independent of other fabrication steps, so that the performance parameter interpreted from that electrical activity is dependent almost exclusively on one (or possibly more) fabrication step(s) or sequence(s).
- a common test structure may be disposed in the active region 152 of the die 150 and activated by a stimulus and/or other signal. A resulting electrical activity may be detected and measured as one of the performance parameters in the set A 1 -A n . In one example, if the fabrication of the wafer is uniform, there is no discernible difference in value amongst the performance parameters in the set.
- Performance parameter values from the inactive portion 154 of the die 150 may also be used, particularly for other purposes like providing a baseline or calibrative set of values for the performance parameter values in the active region 152 .
- the value of each performance parameter may be interpreted from electrical activity that results from inducing and/or simulating a specialized test structure.
- the structures may be designed to exhibit performance parameters in direct relation to one or more fabrication step or sequence on the die 150 .
- the design of the specialized structures may be such that there is no dependence in the value of the exhibited performance parameters on other fabrication steps or sequences in the set.
- one class of structures that generate a particular signal on activation may be used to determine a particular performance parameter value that is known to amplify or otherwise be out of a range in values in the presence of a specific fabrication characteristic (e.g. capacitance or gate length variations that exceed a certain amount).
- a specific fabrication characteristic e.g. capacitance or gate length variations that exceed a certain amount.
- the design of the structure may minimize or filter out the effects of characteristics of other fabrication steps or sequences in that such characteristics may have a relatively small or insignificant effect on the value of the performance parameter.
- the performance parameters may correspond to electrical activity measured from a device that yields a high-value for that measurement when extra metal, or capacitance caused by too much metal, is present on the chip.
- the relationship between the performance parameters and the identified fabrication steps or sequence may be based on a variance of the measured performance parameters.
- the variance may be based on space, speed, or other variables affecting the performance of the particular die 150 .
- FIGS. 1A-1C Various advantages may be provided by an embodiment such as described with FIGS. 1A-1C .
- determining performance parameters that are closely related to fabrication steps enables engineers, designers, and yield managers to identify certain fabrication steps (including tools or modules used in the steps) that are problematic before the fabrication is completed.
- This allows the processes and techniques used in the fabrication to be studied and improved upon in a more effective manner. For example, flaws in one process of the fabrication may be detected and improved upon in between fabrication of individual wafers. Each subsequent wafer may then turn out a better yield.
- design flaws often resulted in some chips on the wafer being marketed as a lower performance product, rather than being marketed at the performance level that was intended. This reduces the value of individual chips considerably.
- embodiments of the invention enable “on-the-fly” detection of fabrication problems, and an opportunity to correct specific fabrication processes before fabrication of another wafer occurs. While statistical analysis may still be used, embodiments of the invention enable the statistics to isolate specific fabrication processes at a much quicker rate than previous approaches. Furthermore, the data is determined from within the die of the wafer, so that the problems in the fabrication processes are better detected and understood. Also, the monitoring, detection, isolation and analysis are done in-line and during the process where corrective and measures and appropriate adjustments could be made.
- FIG. 2 illustrates a method for evaluating a fabrication of a wafer, die or chip, under an embodiment of the invention.
- a method described with FIG. 2 may be performed in conjunction with the use of measured performance parameters, such as described with FIGS. 1A-1C .
- reference to numerals in FIGS. 1A-1C are intended to illustrate a suitable context for performing such a method.
- step 200 a wafer has completed one or more fabrication steps or processes.
- step 210 provides that performance parameters are measured at various locations of a wafer 110 , including within the active regions 152 of the die 150 .
- probe apparatus 102 may be used to make in-chip measurements of electrical activity at various locations.
- Mechanisms, such as test structures, that are designed or otherwise known to exhibit electrical activity from which performance parameters may be determined are positioned selectively within the die 150 .
- the performance parameters may be measured by activating such mechanisms with energy, stimulus and/or test signals, and furthermore, by detecting (measure) the electrical activity by non-contact electrical, optoelectronic and/or electromagnetic means from predetermined locations within each element and/or output signal pads.
- Step 220 provides that the variance of performance parameter values measured in step 210 is determined.
- the variance is spatial, and may be apply across the wafer 110 and die 150 , including the die's active region 152 .
- a spatial variance of such values indicates how the value of the common performance parameter (e.g. an output from a common test structure, or a detected emission from a specific on-chip component) changes from one location to another, whether the designated location is in-die or distributed amongst numerous die and scribe regions 121 .
- the variance may be based on some other parameter, such as switching speed or slew rate.
- the spatial variance of a measured performance parameter provides an analysis tool for isolating specific fabrication-related properties that adversely and/or unpredictably impact chip performance.
- the performance of each die may be characterized as a function of numerous independent factors, where each factor is based on a physical attribute of that die.
- the performance of a fabrication process or step, which yields a spatially variant physical property across the die 150 or its wafer 110 is an example of a process variation.
- step 230 provides that spatial variances of specific physical properties on the wafer 110 and/or die 150 caused by process variations are used to evaluate how the wafer 110 is fabricated.
- the performance parameters may be measured from electrical activity that is induced or designed to exaggerate the affects of specific process variations.
- L and W are device gate length and width, respectively, T ox is the gate oxide thickness, and I SDE is the source-drain extension implant dose.
- P is also dependent on other parameters such as interconnect parameters, which are omitted here for conciseness.
- a fabrication process variation which corresponds to a variance of a physical property produced by that process or step, induces a measurable variance in P that can be approximated to first order by: ⁇ P
- a variance of a performance of devices on the die or chip may be expressed as a function of the variance of certain attributes or results from steps of processes in the fabrication of the wafer where the variance is evaluated after a process step or location or both.
- the features on the wafer 110 or die 150 that cause the electrical activity from which performance parameter are measured may each be selected and structured so that only one of the parameters is sensitive to a specific process variance at a time. This means that the variance of the common performance parameter will be proportional, or at least have some direct relationship to, to the corresponding process variance.
- a process variation may be location based, in that a process is not uniformly performed over a region or entirety of a wafer. There may also be a variation in how a step is performed in the fabrication of one or more wafers.
- step 230 includes associating a property or characteristic of a fabrication step with the spatial variance of the performance parameter. This step may be done before or after the measurements are made.
- the corrective action may be in the form of repeating process steps of step 200 . Alternatively, the corrective action may correspond to stopping the fabrication, or modifying the performance of one or more fabrication steps for subsequent wafers. Alternatively, the corrective action may allow the fabrication to continue, but under a monitored state where data for correcting the fabrication is collected and analyzed. It may also be the case where a fabrication characteristic goes undetected until the end of the line. Rather than repeating the excursion for the next line, the operator can assess fabrication steps or processes that require minor modification, so that the excursion would be eliminated or reduced going forward.
- embodiments of the invention may detect an unacceptable result or attribute of a fabrication step that is uniformly distributed through the entire wafer or die.
- FIG. 3 is a block diagram that illustrates how performance parameters, measured from within the chip or die in the wafer, may be used to evaluate the implementation of some basic steps or processes that are used in the fabrication of a semiconductor wafer. While there are several other kinds of processes that are normally performed in fabrication, FIG. 3 illustrates a lithography process 310 , an etch process 320 , a deposition process 330 , a polishing process 340 (such as chemical-mechanical polishing), and an interconnect process 350 . These processes form some of the overall process used in the manufacturing of a semiconductor wafer. The processes shown in FIG. 3 may be performed in various different orders and repeated, as required by a particular fabrication protocol or recipe.
- one or more of the fabrication processes or steps may be associated with a set of one or more characteristics 314 - 318 .
- the fabrication characteristics 314 - 318 including results and/or attributes from the performance of one or more fabrication steps, associated with two or more processes may overlap.
- the fabrication characteristics 314 - 318 when considered individually or in combination with other fabrication characteristics, may correspond to a feature or aspect on the wafer or die that identify how the processes or steps associated with those fabrication characteristics are performed, particularly in view of the other fabrication processes.
- the fabrication characteristics 314 - 318 are determined from performance parameter measurements. It follows that each of the processes illustrated in FIG. 3 may be evaluated by measuring performance parameters from electrical activity observed at designated locations of a wafer 110 (including in the die or scribe regions). Values of these performance parameters may be evaluated or analyzed to relate to particular fabrication characteristics. The fabrication characteristics may then be related to processes such as illustrated in FIG. 3 , or sub-processes thereof.
- the measurements may be made either during the fabrication, or after completion of the fabrication.
- the performance parameters can be measured after the first metal layer has been deposited on the wafer 110 .
- measurements of performance parameters are made repeatedly after completion of certain processes, beginning with completion of the first metal layer.
- the iterative process could allow the operator to observe and monitor variations of performance parameters at the same location(s) through and at each step of the process, and take remedial actions to adjust according to expected results for better yields and performance.
- a function of the set A of performance parameters within an individual die of the wafer may be used to evaluate the lithography process 310 and etch process 320 in the fabrication.
- the function of the set A may yield a variance, value or other indication of a fabrication characteristic that is known to be the result of the lithography process 310 and etch process 320 .
- a function of the set B of performance parameters may be used to evaluate the deposition process 330
- a function of the set C of performance parameters may be used to evaluate the polishing process 340
- a function of the step D of performance parameters may be used to evaluate the interconnect process 350 .
- various functions may be implemented on a set of performance parameters.
- a mathematical function such as Equation 2 is used on measured values of a particular performance parameter at different locations in the die of the wafer in order to isolate one type physical property (or other fabrication characteristic) from another type. The fabrication characteristic is isolated to correspond to one of the processes shown in FIG. 3 .
- Other types of functions are possible. For example, one function may require that measured performance parameters on individual die to be compared to one another and to the highest performance parameter value on the wafer. Another function may require that one or more of a set of measured performance parameters (e.g. A 1 in the set of A) be compared to a known, expected or desired constant. If the comparison is unfavorable (e.g. beyond the expected and/or acceptable range), evaluation information about a corresponding step may be determined.
- lithography process 310 may be evaluated by the parameters of set A, using and algorithm to determine the composite of A within the die.
- each performance parameter value is compared to a designated constant for favorable comparison.
- each of the two functions provides evaluation information on how a particular fabrication process is performed.
- a variance of each performance parameter in a class may be compared to a variance of a baseline class.
- the baseline class may be based on performance parameters that have do not show variance to any particular fabrication step or location.
- the functions performed by the different performance parameters may be applied to die or wafer-level analysis of the fabrication.
- the performance parameter value may be measured from different die on the wafer 110 .
- a performance parameter may correspond to a measurement of resistivity.
- Chip performance may be adversely affected, for example, when the polishing process 340 is performed on the wafer 110 resulting in extra, or non-uniform, polishing—or thinning—in high-density regions of the die within the wafer increasing the effective resistivity of the interconnects in those regions.
- circuit elements that are sensitive to interconnect resistivity fluctuations may be planted or located on the die to determine whether the chip or wafer has unwanted resistivity variation. The output from these circuit elements may be viewed to determine how resistivity causes delays in the output.
- these elements may be planted or located in areas where high-density or low-density of circuit elements exist, and where deviations in resistivity are thus more likely.
- By measuring output from a circuit element that accentuates resistivity it is possible to isolate on that element the chips's and wafer's resistivity property, at least at or near the location of that circuit element.
- one or more functions may be formulated that incorporate a spatial variance of the resistivity and/or a comparison of measured values of resistivity to known or desired values. Common structures that accentuate the presence of unwanted resistance, but otherwise should have nearly identical switching speeds when disposed on the die, may be used to evaluate how much unacceptable variance in resistance is on the active area. In this way, parameters that indicate resistivity of a particular region on the die may provide evaluation information about, for example, the polishing process 340 .
- a performance parameter a measurement of timing delays and/or switching speeds to a circuit element that has extreme capacitance values.
- the presence of unwanted capacitance may have an exaggerated effect on such circuit elements.
- a composition of values or formula may be developed for purpose of evaluating one of the process steps. For example, metal deposition in process 330 may be evaluated based on switching speeds of circuit elements that are used to detect capacitance.
- PSTS Process-sensitive test structures
- a PSTS has exaggerated sensitivity to the performance or results of one set of fabrication steps, and much less sensitivity to results or performance of any other fabrication step.
- the sensitivity of a PSTS may extend to electrical affects resulting from the performance of one or more fabrication steps, including but not limited to a resistance or capacitance on a region of the wafer or die.
- the sensitivity of the PSTS may also extend to the physical attributes, such as gate width or length, impacted or resulted from a fabrication step.
- a PSTS may be structured so that the presence of a particular attribute in the die or wafer that stems from a fabrication step causes the PSTS to output or exhibit electrical activity that is associated with that step or attribute.
- the electrical activity can be measured as a performance parameter that can be analyzed to yield information about a fabrication step, sequence or process.
- Prior art techniques provide for test structures that are placed in the scribe areas of wafers, are measured with testers that make mechanical contact, to produce process related parameters that correlate to variations in the scribe areas. Since the scribe areas are known to be a poor correlate to local variation inside the active die areas of the wafer—outside of the scribe areas, process variation measured in the scribe is a poor correlate to process variation in the active die areas of the wafer. There have been previous attempts to use test structures inside the die of a wafer. However, these approaches rely on measuring the test structures only after manufacturing of the wafer is completed. As such, the test structures can only measure process variations from a completely fabricated wafer.
- test structures that can be placed inside the active and critical part of the die during the fabrication process.
- the test structures may be stimulated in a non-contact manner to exhibit or produce electrical properties that can then be measured.
- the measurements of the electrical activity from the test structures may then be used to evaluate fabrication of the wafer while the fabrication is ongoing.
- the structures provide a mechanism for using direct measurements to determine information about the effects of process variations inside the die.
- Embodiments described herein provide for process variations to be measured for partially processed wafers. This greatly accelerates the availability of specific process variation information, so that the information is available during the fabrication process, when corrective action can be taken.
- At least some of the PSTS that are placed on the wafer are sensitive to a specific fabrication step or sequence.
- the same PSTS may also be insensitive to other fabrication steps in the fabrication process. This negative association serves to isolate what fabrication steps the electrical activity of the PSTS is dependent on, so that the electrical activity of the PSTS provides a clear marker on one fabrication step or sequence.
- FIG. 4 is a basic block diagram illustrating a PSTS 410 , according to an embodiment.
- the PSTS 410 may be configured so that a particular sensitivity to a desired fabrication step or sequence is made inherent in the structure.
- a power 412 and a test signal 414 are inputs to PSTS 410 .
- the power signal 412 stimulates the PSTS 410
- the test signal 414 triggers the PSTS.
- PSTS 410 is activated to yield an output 422 .
- an incidental signal or series of node-to-node signals 424 is detected when the PSTS 410 is activated.
- the signal 424 may correspond to photons produced from transistors of the PSTS 410 as elements of the PSTS switch on or off, while signal 422 may correspond to an electrical signal aggregated from many nodes that reflects how the test signal 414 was modified by the PSTS.
- One or both the output 422 and the node-to-node signal 424 are used to determine one or more performance parameters. Examples of performance parameters include transistor switching speed, circuit timing, and slew rates of transistors and switches within the PSTS.
- a circuit element may be used to determine how much incidental resistance (e.g. from contamination of a metal deposition) is formed on the wafer in high-density areas. Therefore, the circuit element's output is adversely affected by small amounts of unwanted resistance.
- the output 422 and incidental signals 424 of PSTS 410 are used to obtain or formulate evaluation information 432 for evaluating the fabrication of the die or wafer. For example, if the output 422 is dependent on a physical property that is the result of a particular fabrication process, a correlation may be drawn between various values of the output within the chip and a specific process step. The correlation may require determining a variance of the output, or a comparison of discrete values of the output to desired or known values. The variance of the output may be used to determine a process variations and excursions.
- a class of a particular PSTS structure may correspond to PSTS structures that have a common design. Other variables may be used to designate a class of PSTS structures.
- a class of PSTS structures may correspond to all structures that are tied or otherwise indicative of a particular fabrication step, process or result. Numerous classes of PSTS structures may be distributed on a wafer, and inside the die of the wafer, particularly in the active regions of the die. Several PSTS structures of a particular class may be provided within the active regions of the die.
- FIG. 5 illustrates a method for using test structures to obtain information about the fabrication of a chip or wafer. The information may be used to determine whether a particular fabrication step or sequence is being performed and providing results as expected.
- Step 510 provides that locations for test structures are identified. These locations may correspond to locations on a wafer, on a die, and in discrete locations within the active regions of the die and could also be placed in the scribe for comparison the e-test structures typically placed there for in-line electrical contact testing. Depending on the test structure and the need, multiple test structures may, for example, be distributed on a single die.
- Step 520 provides that the fabrication of the wafer is initiated. This may include the performance of processes, such as lithography or etching. Subsequent to deposition of the first layer of metal (often metal-one) electrical conductivity is established to allow for test structures to be stimulated and tested.
- metal often metal-one
- test structures may be activated at a particular fabrication.
- the test structures can be used to analyze certain processes prior to completion of fabrication, and prior to repetition of certain steps, sequences or processes.
- some test structures may be activated in order to determine that a problem exists with the first metal layer, but not the second.
- the electrical activity of the activated test structures are detected and interpreted.
- the electrical activity corresponds to performance parameters such as switching characteristics of individual gates or structure as a whole (e.g. timing delays, slew rate, or circuit timing). Particular transistors and gates may be observed, or an output of the structure as a whole may be detected or measured.
- Step 550 provides that information for evaluating one or more steps or processes in the fabrication of the wafer is obtained from the electrical activity of the test structures.
- the evaluation information may be in various forms. For example, the information may be statistical, and formulated over a duration that includes the fabrication of several wafers. Alternatively, the information may be for immediate use. For example, in the event output from a particular test structure is outside the acceptable range, the fabrication can be stopped, or adjusted for subsequent wafers. In any case, the evaluation information may be used at some point to make adjustments and modifications to a particular fabrication process, step or sequence.
- test structures are formed from electrically active switching structures and other devices.
- the test structures may exhibit electrical activity under certain conditions, and measurements of the electrical activity may be correlated to information about the chip, die or wafer.
- the electrical activity may be measured and used based on a principal that a variance of the measurement of the aforementioned electrically active switching structures is related to the variance of discrete process components through the design of the switching elements.
- Electrical activity may be measured as an output 422 to the aggregate PSTS, or may be measured node-to-node for each element of the PSTS.
- test structures may be developed that exaggerate the effects of gate length, but minimize the effects of other fabrication steps.
- equation (2) simplifies to, ⁇ P ⁇ F/ ⁇ L ⁇ L (3) and the variance that is measured from this switching circuit ⁇ P will be proportional to the process variance associated with gate length, ⁇ L.
- FIG. 6 illustrates a more detailed method for how PSTS can be developed and used, under an embodiment of the invention.
- step 610 provides that a simple building block circuit element is selected and/or designed.
- FIG. 7A is a diagram illustrating aspects of a suitable building block circuit element for CMOS technology indicating channel width (W) and length (L).
- W channel width
- L length
- a simple element can also be defined for other fabrication processes as will be known to those skilled in the art.
- the aspects may include: (i) one or more gates 702 (made from n-type and p-type transistors for CMOS, that can be manipulated in dimension (e.g.
- FIG. 7B illustrates use of CMOS inverters in a basic building block circuit.
- FIG. 7B illustrates a PSTS composed of identical building blocks that can be formed on an active portion of a die with their associated power/stimuli and output pads and configured for purpose of making time-delay measurements that are sensitive to attributes and results of fabrication steps.
- the PSTS may include a circuit element 710 having a series of two or more serially connected inverters 712 which in an implementation shown by FIG. 7B , are CMOS switching elements.
- each of the inverters 712 includes a pair of complimentary CMOS transistors.
- each inverter 712 includes a p-channel type transistor (PMOS) 722 and an n-channel type transistor (NMOS) 724 .
- PMOS p-channel type transistor
- NMOS n-channel type transistor
- the NMOS transistor 724 and PMOS transistor 722 have their respective gates connected together as input, and drains connected together as output.
- the source of the PMOS transistors 722 is connected to a positive supply voltage and the source of the NMOS 724 to the negative supply voltage.
- the substrate of the PMOS transistor 722 is biased positively (typically at the positive supply voltage), while substrate contact of the NMOS transistor 724 is negatively biased (typically at the negative supply voltage).
- a circuit element as shown in FIG. 7B is an example of a structure that can be manipulated to exhibit electrical activity that relates to an attribute of a fabrication step or sequence of the wafer on which it was formed.
- a serial inverter can be configured or incorporated into a larger structure to create process-sensitive structures.
- Such structures can provide an output that is indicative of a performance parameter.
- the performance parameter may be a time delay between the input and the output of the structure, or some other indicating of a switching speed of transistors in that structure.
- the structure can be placed at different locations and/or in different switching environments so that a difference in the time delay of two such structures is indicative of a process variation in the fabrication of the wafer.
- the PSTS may include three basic stages: an input buffer 711 , a test stage 713 and an output buffer 715
- the test stage 713 includes the circuit element that can be manipulated.
- the input buffer 711 and output buffer 715 controls the power input so as to control the rate at which the transistors of the test stage 713 turn on. Once power is delivered to the test structure, the transistors of the test stage 713 exhibit by design baseline and exaggerated characteristics related to a result of the fabrication step or sequence that they are measuring.
- both the input and output buffers 711 , 715 are common to all the test structures described below.
- an attribute of a fabrication step or sequence is selected.
- the attribute may be correlated to a particular performance parameter, where the performance parameter is measurable form electrical activity of the test structure.
- Step 620 provides that a class of one or more test circuit blocks are formed, where test circuit blocks in at least some of the classes are designed to provide a performance parameter value that is exaggerated as to how it relates to the presence of the selected fabrication step or sequence.
- a variance in the measurements of the performance parameters of each test circuit blocks in a particular class is indicative of a variation in the corresponding fabrication-related attribute.
- the variance in the measurements of the performance parameters of each test circuit block in the class is compared to a similar variance in the same measurements from a class of baseline structures (see step 635 ). Choosing the physical design of the individual blocks so that the maximum sensitivity of the switching circuit corresponds to the specific process parameter may be performed at this step. A device-circuit analysis program like the different versions of Spice or Spectre or even numerical simulation methods may be employed to accomplish this.
- Step 625 provides that switching elements in the different classes of test blocks are placed within a measurement topography to make the switching elements amenable to test during wafer processing.
- Examples of how the measurement topography may be employed include delay-based measurements for both frequency and phase shift.
- one or more delay-sensitive elements 731 is placed between or embedded in a series of inverters 734 , and subject to control 730 , or triggering, then interconnected back onto itself via a feedback 740 to create a Ring Oscillator (RO).
- FIG. 7D the addition of a reference output 750 to indicate phase shift results in a phase based inverter circuit.
- the delay-sensitive element 731 may correspond to a structure that can be manipulated, as described with FIG. 7A .
- a completed test structure may comprise a test block placed in measurement topography.
- the types of fabrication-related attribute that can be evaluated through measurements of the respective performance parameters include L eff , interconnect resistance and capacitance, gate capacitance, leakage and other performance parameters.
- separate PSTS' designed for different exaggerated sensitivities at the same location or the same PSTS with one specific sensitivity, or combinations of the two aforementioned scenarios could be dispersed through out the die or wafer and designed with distinct output “signatures” (e.g. frequency, or phase shift) per their location or sensitivity type or both, and thereby be detected concurrently and simultaneously but separately.
- a probe card including detectors and stimuli matched to the predetermined locations on the wafer could be utilized to probe die on the wafer simultaneously and concurrently and increase throughput.
- a class of test structures for both individual fabrication attributes and a baseline may be constructed. The process of establishing a PSTS or groups of PSTS's for each process step or steps is repeated until all desired process steps are covered.
- a baseline class of structures is formed.
- the baseline class is constructed from the same blocks as one or more of the classes of test structures. These baseline structures are designed to either be insensitive to the exaggerated process step sensitivity of the PSTS's, or are designed such that when co-located with the PSTS's with exaggerated sensitivity the difference of the two structures' result has an exaggerated sensitivity to the process step. While the baseline class of structures is not necessary, the use of such test structures may have benefit.
- Step 640 provides that each class of PSTS, including the baseline PSTS, are distributed inside a die.
- measurement of electrical activity is taken from each test structure.
- examples of electrical activity include device performance measurements (e.g. frequency and phase delays) that indicate the response of process sensitive structure.
- the electrical activity may include how each PSTS handles and outputs a test signal, as well as how individual elements of the PSTS perform (e.g. timing and slew-rates and shape of individual gates switches).
- Types of electrical activity may, as mentioned elsewhere in this application, include electrical activity output signals and photonic signals. Optoelectronic signals can be detected and resolved from photonic signals generated by the test structures.
- structures can be designed such the electrical activity produces electromagnetic and or optoelectronic signals to a detection pad 1130 . Additionally, structures can be designed that allow for electron-beam and ion-beam techniques to detect electrical activity present at the detection pad 1130 .
- step 650 variations in measurements taken in step 645 are analyzed.
- the analysis may be among a PSTS in a particular class, or between classes (individually or in group) of PSTS, or as compared to one another, or “simple” speed measurements of non-PSTS devices, or non-sensitive structures.
- each class of PSTS may be compared to the baseline class of PSTS in order to determine whether variations in that particular class or beyond a designated variation in relation to a baseline variation measurement.
- FIG. 8 is a representative example of how a method such as described with FIG. 6 may be performed.
- FIG. 8 illustrates a collection of PSTS distributed at various locations 812 of a die active area 810 (surrounded by scribe), including the nominal or baseline PSTS (an output of which is represented by numeral 802 ), which are physically co-located with and in the immediate vicinity of one another and the power, signal and detection circuitry and pads.
- the baseline PSTS includes switching elements that are similar to the switching elements of the design building blocks for one or more of the class of PSTS.
- the collection of PSTS may include different classes of PSTS, where each PSTS class is sensitive to one or a group of process parameters.
- the total set of structures will experience identical process variation due to the proximity of their placement at each location that will be dominated by local pattern density variations and/or other local processing conditions.
- measurement of the control structure will establish the impact of local process variation on that structure, and can be used as a normalized and calibrated data-point against which the other process and/or location sensitive measurements and their respective measured variances will be compared to and calculated as an indicator of.
- the variation will manifest itself in the corresponding PSTS adjacent with the control structure.
- Local process variation results in changes to the physical dimensions of switching circuit devices, or to the devices doping, or both. In turn, these variations impact the measured performance-related parameter (e.g. frequency or phase response) of the PSTS.
- electrical measurement comparison of the baseline structure to the other structures will contribute to isolation of one fabrication characteristic that is most related to the process variation, since only the switching circuit sensitive to the process variation will show significant variation in its performance parameter.
- This can allow a set of measurements to distinguish, say, between the gate-module issues (L eff ) and interconnect dishing resulting in variations from the baseline “norm” in interconnect resistance.
- Previous techniques sought to place different test structures in physical proximity to portions of chip designs to simulate local process loading. In contrast here, test structures, adjoining structures for power generation and conditioning, and signal detection are placed adjacent to one another and are co-located inside the chip active area and in the vicinity of areas of pattern density fluctuation.
- FIG. 9A illustrates a test stage circuit element 920 that can be formed on the active portion of a die with their associated buffers, power/stimuli and output pads and circuitry, and configured for the purpose of producing time-delay or phase shift measurements with respect to the baseline circuit or with respect to each other to exaggerate the influence of p-doped or n-doped gate length (L p , L n respectively) 910 , 912 on the overall response of the circuit 920 .
- This can be accomplished by modifying the switching element, series resistance (R), and series capacitance (C) according to the principles illustrated by FIG.
- L p and L n at the minimum allowable, near-minimum or sub-minimum gate length while keeping the p-doped and n-doped gate Widths (W p , W n respectively) at larger values.
- the measured variance in the frequency or phase of these devices will be highly sensitive to gate length.
- Identical interconnected elements 920 are nested within either electrically active or passive elements 924 to replicate (mimic) local circuit design pattern density.
- individual n-device or p-device sensitivity to channel length can be achieved by either an L p or L n that is designed to exaggerate the influence of L eff on circuit speed performance.
- FIG. 9B illustrates a test stage circuit element 930 that can be formed on the active portion of a die with their associated buffers, power/stimuli and output pads and circuitry, and configured for the purpose of making time-delay or phase shift measurements to exaggerate the influence of interconnect resistance on the overall response of the circuit.
- This can be accomplished by purposely modifying a length of interconnect 934 such that dimensional variance arising from local pattern density induced variations or thickness variations will impact the measured variance in the frequency or phase of these devices.
- the interconnect is modified such that it's width is kept at minimum dimensions and its length is chosen to create a series resistance large enough to distinguish time delay of the aggregate structure 930 from those of adjacent inverters in FIG.
- the comb tine features 936 adjacent to, but not electrically connected with interconnect 934 will ensure that the PSTS does not change and impact the pattern density in its vicinity.
- the aforementioned device can be placed at one or multiple interconnect levels to isolate the impact to interconnect resistance from different interconnect levels.
- FIG. 9C illustrates a circuit element 940 that can be formed with its associated buffers, power and detection elements and circuitry, on the active portion of a die and configured for the purpose of making time-delay or phase shift to exaggerate the influence of interconnect capacitance on the overall performance response of the circuit. This can be accomplished by purposely modifying a length of interconnect 944 such that the RC contribution to the delay of the aggregate circuit element 940 is distinguishable from adjacent elements in FIG. 9C , and such that line to line dimensional variance arising from local pattern density induced variations or film thickness variations will have greater impact to the measured variance in the frequency or phase output of element 940 than other elements in FIG. 9C .
- Additional features 946 adjacent to, but not electrically connected with interconnect 946 will ensure that the PSTS does not change the pattern density in its vicinity.
- the aforementioned device can be placed at one or multiple interconnect levels to isolate the impact of separate levels of interconnect capacitance from different interconnect levels.
- FIGS. 9A , 9 B, and 9 C The complement of measurements from the devices illustrated in FIGS. 9A , 9 B, and 9 C will describe the overall and individual physical variance signatures providing vital information for the control of interconnect processing for the adjacent devices critical for the timing distribution within a chip, for clock skew, and any additional performance impact of the interconnect structures.
- FIG. 9D illustrates circuit elements 950 , 960 and 970 that can be formed on the active portion of a die with their associated buffers, power/stimuli and output pads and circuitry, and configured for the purpose of inducing time-delay or phase shift measurements to exaggerate the influence of gate capacitance on the overall timing response of the circuit.
- This can be accomplished by purposely modifying the areas (L ⁇ W) 952 , 954 and 956 of the gates of groups of devices in known area increments. Each increment will impact the measured variance in the frequency or phase of these devices with different area to perimeter values owing to either gate film stack variance (area) vs. gate perimeter area (source-drain implant and photo/etch).
- circuit element 920 that are adjacent to, but not electrically connected with the device in FIG. 9D , as taught in FIGS. 9A , 9 B, and 9 C, will ensure that the PSTS pattern density is similar to the device density for active devices in its vicinity.
- FIG. 9E illustrates a circuit element 980 and 990 that can be formed on the active portion of a die with their associated buffers, power/stimuli and output pads and circuitry, and configured for the purpose of making time-delay or phase shift measurements to exaggerate the influence of gate capacitance on the overall response of the circuit, also.
- the number of devices in 982 and 984 are chosen such that the devices have equivalent performance to circuit elements 960 and 970 , respectively. Comparison of the frequency or phase delay results between the devices in FIGS. 9D and 9E will separate the perimeter effect of etch ( FIG. 9E ) vs. source-drain extension ( FIG. 9D ) capacitance. Additional devices similar to circuit element 920 and adjacent to, but not electrically connected with the device in FIG.
- FIGS. 9A , 9 B, and 9 C will ensure that the PSTS pattern density is similar to the device density for active devices in its vicinity.
- Sources of variance for these devices may also include the presence of impurities in the gate dielectric material, gate electrode doping segregation, etc.
- FIG. 10 illustrates a PSTS that can be formed on the active portion of a die with their associated buffers, power/stimuli and output pads and circuitry, and configured for the purpose of making time-delay or phase shift measurements to exaggerate and correlate the offset between critical dimension scanning electron microscope (CD-SEM measurements) and electrical critical dimension (CD) measurements.
- CD-SEM measurements are typically correlated to electrically active devices in the scribe line in order to ensure that a “good” process window for CD's—that is CD's meeting the electrical process specification—is determined during process development. Since CD-SEMs are not sensitive to the electrical impact of source drain extension implants, or to channel doping properties, such a correlation is performed routinely to make certain that the electrical CD equivalent of the measured physical CD is within specification.
- a structure such as shown may measure signal delay between switching circuit elements, and a CD SEM can measure CD variations for the isolated and dense structures in the vicinity of the timing structures. Data from both are used to determine lithography and etch process windows.
- FIG. 10 an isolated area 1010 and a densely packed area 1050 of devices are created.
- a repeating circuit element 1030 is designed such that the gate length 1042 of the element 1040 is identical in geometry to an isolated line 1020 .
- dense line 1060 and the gate length 1082 of devices 1080 in a densely packed area are identically designed.
- an inverter chain (see e.g., FIG. 7B ) is provided as part of a test structure in order to measure the speed with which the n-channel and p-channel devices switch, and the total delay associated of the entire chain when the chain is powered and stimulated at clock speeds of the native design of the product process.
- Placement and measurement of these structures and their associated power/stimuli and data collection circuits and pads within the active area chip area would therefore allow the assessment of in-chip variation from these structures.
- the placement of these structures in the active areas of the chip may also provide for a simple yield screen at the first level of metallization to segregate the wafers which fall outside of the desired performance specification (e.g. slower) than desired wafers from continuing the manufacturing process.
- the simple inverter chain (similar to FIG. 7B ) of the test structure can be designed such that several elements in the chain have a designed-in flaw that is sensitive to process fluctuation.
- an additional serif can be added to the gate strap area such that it is more likely to “scum”, impairing proper etching of the feature and resulting in a hairline short between the gate strap and an adjacent metal strap.
- the simple inverter chain of the test structure is structured so that the circuit speed can be segregated between device process missteps versus interconnect processing.
- These circuits would be designed to add a fixed amount of interconnect capacitance representative of typical distribution lengths.
- Measurement at metal-one deposition can provide in-chip variation measurements of circuit speed. Since the inventive techniques disclosed here are non-contact, noninvasive and require only line-of-sight to actualize the measurement, subsequent measurements of the same structure at metal-two or metal-three depositions, or at any metal level up to and including metal-final, will allow the segregation of in-chip variations caused by interconnect RC delay arising after metal one, from any of a number of process and/or design issues at Metal 2, Metal 2, etc. . . . . Among other advantages, such a design focuses yield engineering resources on the metal interconnect sequence that is not within expected measurement tolerances. Once the metal interconnect process is rectified, similar measurements can validate the efficacy of the process “fix”.
- circuit subsets from advanced customer designs can be added to an existing mature chip. Placement and measurement of these structures within the active area of the chip area would therefore allow the assessment of in-chip variation of these new circuits in the presence of local pattern variation. Placement of such structures may also provide for a quick yield screen at the first level of metallization to segregate slower and faster than desired circuits, resulting in quick feedback for the designers to further optimize their circuits prior to committing the design to large manufacturing volume.
- Embodiments of the invention contemplate various other circuit designs for use as test structures.
- embodiments described herein can readily accommodate known n-channel and p-channel devices made today, as well as more complex devices being considered in future manufacturing processes.
- the aforesaid specialized test structures may be designed using various computer-based circuit and physical design and analysis tools well known to persons of skill in the art.
- One example of such a design tool is “PROPHET” developed by Center for Integrated Systems, Stanford University, California. Because PROPHET and similar design tools are capable of predicting circuit characteristics for different values of process parameters, the design of the structure may be optimized to provide sensitivity to only select process parameters and not the others.
- test structures and their associated power/stimuli and detection circuitry and pads on a wafer or chip according to FIG. 8 may be one of a design choice. According to one embodiment, such structures are placed along principle diagonal inside the product chip. Alternatively, the structures may be placed along a domino pattern, including, for example, top left, top right, center, bottom left and bottom right areas of the chip. Alternatively, for example in microprocessors (MPU), central processors (CPU) units and ASIC devices, the structures may be placed near the perimeter and internal to core logic, or SRAM blocks, etc. It should be noted that the exact location of the test structures on the chip is not essential to the present invention. Other suitable location choices are possible, including unused portions of the wafer, dedicated test chips, scribe, and on test wafers.
- test structures for purpose of evaluating fabrication.
- the test structures may need to be activated prior to the integrated circuits on the remainder of the chip being fully formed.
- Embodiments described herein provide test structures within on a wafer.
- the test structures are provided power and test signals from co-located structures in the die active area or the scribe in order to evaluate fabrication of the wafer.
- in-die stimulation of signals to the test structures the required power and test/trigger signals are provided to the chip in a non-destructive, non-contact and non-invasive manner.
- the test structures can be activated at any point after the deposition of conductive material (e.g. after local interconnect or metal-one) on the wafer.
- test structures are scattered throughout numerous (if not all) chips that are on the wafer (including scribe and unused areas of the wafer or test chips) and that the test structures can be triggered, stimulated or otherwise activated at the different stages of the fabrication (in-line).
- Each test structure may be used repeatedly, without affecting subsequent usability of the chip, and without disrupting the process flow of the fabrication.
- Valuable information regarding how the fabrication can be controlled and/or improved may be determined from using and testing the test structures in this manner, especially in the active area of the chip/die. This information may be region specific on the wafer (e.g.
- test structures may be specialized to provide information about a process variation and/or one or more fabrication steps of the wafer.
- FIG. 11 is a representative block diagram illustrating a scheme to populate regions of a partially fabricated wafer die, including intra-die regions, with test structures that can then be used to measure performance parameters correlated with process steps or process step sequences of the fabrication, or for performance related (e.g. speed) monitoring of the same area within the die(s) or the wafer (s).
- the test structures may be used within one or more fabrication steps to evaluate the fabrication of the wafer.
- test structures 1120 , power receiver 1112 , test/trigger receiver 1110 and detection pads 1130 can be co-located in a chip 1102 , and may be tested repeatedly and non-destructively. Furthermore, the chip 1102 may be tested in either a completely or partially completed fabrication state.
- test structures may be activated and tested early on in the fabrication of the wafer in order to evaluate one or more initial fabrication processes, then activated later on in fabrication to evaluate subsequent fabrication processes.
- the test structures may also be stimulated/activated and tested to evaluate an overall fabrication and/or performance of the chip once fabrication has been completed.
- chip 1102 is provided a test/trigger receiver 1110 , a power receiver 1112 , one or more test structures 1120 (possibly of different classes or designs) and corresponding detection pads 1130 . All of these components may be formed on the active area of the die in more than one location for intra-die measurements.
- the power receiver 1112 may be stimulated or energized to generate a power signal for the test structures 1120 .
- the power receiver can be made of one or more photodiodes.
- the combination of the power signal and the test/trigger signal activates the individual test structure.
- the test/trigger receiver 1110 may be stimulated or energized to generate a trigger signal for the test structures 1120 .
- the test/trigger receiver can be made of one or more photodiodes with fast, transient response. Both the test/trigger receiver 1110 and the power receiver 1112 may be stimulated or energized by an outside energy source. In particular, the test/trigger signal and power signal may activate the test structure 1120 into exhibiting a detectable electrical activity.
- the electrical activity may include, but not limited to, the emission of hot-electron induced photons (which could be detected for timed-resolved photon emissions which are time-correlated to switching events in active junctions), output of one or more electrical signals, time-correlated change in one or more types of electro-optical properties (e.g. charge-induced electro-rectification and/or electro-absorption), and/or other electrical activity at the junction of the interconnect.
- an embodiment provides that the active area co-located test/trigger receiver 1110 and the power receiver 1112 are energized through a contact-less and non-invasive energy medium.
- Other embodiments may provide test structures intra-die that are activated by only a power signal. In either case, the activation of the test structures is accomplished by co-locating (in the same active area on the same die) intra-chip energy sources (power/test) with the test structures.
- separate energy and trigger/test sources e.g.
- first energy source 1108 may direct a constant energy beam onto power receiver 1112 , so that the resulting power signal for the test structure 1120 is constant.
- a second energy source 1106 may direct a time- (and/or amplitude) modulated beam onto test/trigger receiver 1110 .
- the modulated beam results in a modulated test signal to be inputted for the test structure 1120 .
- This subsequent electrical activity of the test structure 1120 may be based on the modulated input from the test/trigger source 1106 .
- the test/trigger receiver 1110 may be energized simultaneously or concurrently with the power receiver 1112 .
- first energy source 1106 is a laser beam produces a constant source of energy for power
- second energy source is a laser that produced a pulsating (e.g. time-gated) modulating beam.
- the same energy source 1108 may be split with one portion going to the power receiver 1112 and the other portion can be modulated and sent to test/trigger receiver 1110 .
- the electrical activity that results from the test structure 1120 being triggered may be measured as a performance parameter, such as switching speed, phase or signal delay, or slew rate.
- switching speed may be measured node-to-node (individual gate-level), such as for an individual transistor, as well as end-to-end on the test structure 1120 .
- the test structure 1120 may be specialized so that the performance parameters can correlate into information about specific fabrication step(s) or sequence(s), and more specifically, process variations across the chip or die, wafer, or from one wafer to another wafer.
- the evaluation information may include direct performance measurement of device speeds useful to forecast final fabrication quality, and/or information that isolates process variations caused by certain fabrication steps, including information about the results of specific processes and how those processes were performed.
- some of the electrical activity of the triggered test structure 1120 may be a nodal signal output in the form of an optoelectronic effect.
- hot electron emission intrinsic to the device switching is a probe-less measurement technique that can be deployed through the use of well-designed photon detector 1142 .
- other optoelectronic effects such as charge induced electro-absorption and electro-rectification may require the use of a probe/detector 1142 .
- an electron beam probe/detector 1142 can be configured to detect node-to-node switching events.
- the test/trigger signal may also be used to provide a repetitive “timing edge” for the purposes of time-based measurements which can yield node-to-node information, and also as a test vector that could be used to measure response of the test structure node by node.
- the signal output at each node (and ultimately at the output node/detection pad) may be analyzed to ascertain how the test structure 1120 's internal gates, transistors, or other nodes affected the test signal.
- the node-to-node output signals may reflect information from when an individual transistor switches and changes its state, and also the impact of the active circuit on how the test signal changes and evolves in time and shape from node to node.
- the nodal signal output from transistors and other components of the test structure provide information on how the test signal is processed at a particular transistor, gate or other node in the test structure. Since electrical activity from individual transistors is observed, the information on how the test signal is processed is said to be “node-to-node”.
- the test signal could also be used to supply the timing “edge” required for time-based measurements.
- the test vector could be used for complex diagnostic/design purposes and analysis on the wafer or die in the fabrication process. This is task that is usually performed on packaged (post passivated and fully processed die).
- an embodiment using a test/trigger vector on the test structures can detect electrical activity from a test structure in aggregate, meaning the electrical activity reflects how the power or test signal evolved between input and output ends of the test structure (and not at individual gates and nodes of the test structure).
- This electrical activity may be an aggregate signal output.
- detector pad 1130 may be used. The detector pad 1130 may convert an electrical output signal from test structure 1120 into some other electrical activity that can be detected by contact-less means and medium. As mentioned, the electrical output signal reflects how the test signal was processed between input and output stages of the test structure.
- the aggregate time-delay of the test structure/circuit can be manifest in frequency and detector pad 1130 is electromagnetically (e.g. capacitively or inductively) coupled to a signal based on the electrical signal of the test structure 1120 .
- a receiver 1140 may be positioned over the detector pad 1130 to detect and measure the signal from the pad.
- an appropriate probe/detector 1142 combination may be used to probe/detect the signal from individual gates of the test structure.
- a laser probe and optical detector for electro-rectification or electro-absorption effects; or electron-beam probe with appropriate time-gated detector; or a time-resolved detector for probe-less measurements of hot-electron induced photons.
- the information that can be identified from the output signals provides a certain type and/or range for a performance parameter value.
- the test structure 1120 may be designed so that its activity, whether in the time-based node-to-node form, or aggregate (input/output) delay signal, is sensitive to a particular fabrication step in the fabrication of the wafer.
- the performance parameter values may be analyzed in various ways to evaluate fabrication of the wafer. For example, a variance of the performance parameter values may be determined using a common test structure that is disposed at multiple locations of one die, or across many die and other locations of the wafer. Because the performance parameter values may depend on test structure design, one embodiment provides that the performance parameter values identify information about specific fabrication steps or sequences, including process variations.
- An embodiment such as described in FIG. 11 may eliminate the use of trace lines and other mechanical probe devices that reside in the scribe to the chip 1102 for purpose of providing the test and/or power signals and stimuli.
- the elimination of such mechanical contacts enables the key and necessary requirement that individual chips formed from the wafer to be hermetically sealed when fabrication is completed.
- the seal is required for the chip to be insensitive to moisture and other contaminations from the environment, a requirement for most (if not all) semiconductor components. Consequently, a scheme such as shown in FIG. 11 may identify or determine performance values of various types and at numerous locations on the chip 1102 or its wafer, without affecting the usability of the chip 1102 .
- the scheme allows for the test structure 1120 to be activated and triggered at every chosen step of the fabrication process. Numerous test structures of multiple classes may be used. As such, tests may be performed repeatedly on the chip 1102 at different stages of the fabrication process.
- FIG. 12 illustrates a method for using a test structure when the power and test/trigger signal for that test structure are generated intra-die, according to an embodiment. Reference is made to elements of FIG. 11 in order to illustrate suitable components or context for implementing a method as described.
- a power signal is induced within the die active area and applied to the test structures 1120 a particular juncture during fabrication, or after its completion.
- a test/trigger signal is generated within the chip (in the active area) and applied to one or more test structures 1120 .
- the test/trigger signal may be generated by an external, non-contact energy source (e.g. first energy source 1106 ) that energizes a designated region on the chip, and causes that region to generate a test/trigger signal (or equivalent thereof).
- the application of the power and the test/trigger signal to the one or more test structures is what activates the test structures into exhibiting electrical activity.
- Step 1210 may be performed concurrently or simultaneously with step 1210 .
- the application of the power and the test/trigger signal may be simultaneous or concurrent.
- the power signal may be generated in the same manner as the test/trigger signal-in that an external, non-contact energy source may energize a designated region on the chip.
- the designated region of chip that is energized corresponds to power receiver 1112 .
- a single region on the chip 1102 may be used one or more times to distribute power to multiple test structures on that chip, during one or more testing phases.
- step 1230 electrical activity resulting from individual test structures 1120 being activated is detected.
- the electrical activity of the test structures (which may themselves be sensitive to fabrication steps) may be in the form of node-to-node output, aggregate signals, and combinations thereof. Detection of either type of electrical activity may require use of specifically designed probes (if needed) and associated detectors, as described elsewhere in this application.
- the addition of detection pad 1130 transmits a signal corresponding to the aggregate output signal of one or more test structures (including the individual nodes of the test structures).
- the aggregate output signal may be provided a signature to identify the test structures that contribute to the aggregate signals.
- Step 1240 provides that the detected electrical activity are interpreted as a performance parameter variance relating to a quality metric related to yield, or relating a process step or steps in the process sequence.
- performance parameters may correspond to any one of the following: (i) a switching speed of the test structure as a whole, or within individual gates; (ii) a frequency or phase delay as to how the output signal differs from the input signal to the test structure 1120 ; and (iii) a measurement of a slew rate and shape (in time) for one or more transistors, or the aggregate signal for the test structure as a whole.
- step 1250 provides that the variance of the performance parameters, or the variance to a baseline, are analyzed in order to correlate them to one or more specific steps, sequence of steps, or processes in the fabrication of the wafer.
- a variance of the performance parameter values is determined to identify process variations.
- Other examples of analysis functions include performing comparisons between performance parameters as measured by separate test structures at different locations of the die, or having different designs. The analysis may also include correlating the values of the performance parameters (or variances thereof) to particular fabrication characteristics that are associated with specific processes performed in the fabrication prior to the test structures being activated.
- a method such as described may be performed without affecting or damaging the chip. Both the application of the power and test/trigger signal, as well as the detection of the signals from the test structure, may be done without affecting the need to seal (or passivate) the die/wafer and it enables reuse all of its components when fabrication of the wafer is complete.
- a test structure such as described with FIG. 11 may have sensitivity to variations of the input signal.
- any fluctuation in the input power provided to a test structure may amplify or skew an output of the test structure so as to obscure output variations that are attributable to process variations or fabrication characteristics.
- the energy source used to generate the power signal at the receiver collocated with the test structure is external to and off-chip, the conversion of energy into a power signal may carry inherent instabilities and fluctuations. The result is that an in-chip power signal generated from an off-chip power source may require appropriate buffering, regulation (e.g. rectification) and/or stabilization.
- FIG. 13A illustrates a circuit for regulating an input voltage created by an external power source that can be co-located in the die active area with power receivers, test/trigger receivers, test structures and detection pads.
- a circuit 1305 includes a photodiode 1304 , a regulator 1310 , an on-chip reference voltage mechanism 1316 for providing a reference voltage, and a PSTS 1318 (such as described with FIG. 4 ).
- the external power source is a continuous wave (CW) laser 1302 which directs light onto the photodiode 1304 and the reference voltage circuitry 1316 , such as a band-gap voltage reference.
- CW continuous wave
- the photodiode 1304 operates in a mode to regulate and fix the voltage to the PSTS 1318 in a narrow range.
- the photodiode 1304 creates a voltage that is regulated and stabilized by regulator 1310 .
- regulator 1310 regulates the voltage for a PSTS 1318 to be within a narrow band or range.
- regulator 1310 may also rectify the input voltage.
- the regulator 1310 may include a comparator 1312 that compares a voltage level of the input to the PSTS 1318 to a reference voltage provided by band-gap voltage reference 1316 .
- An output of comparator 1316 may feed regulator 1310 to make adjustments to the voltage of the input to the PSTS 1318 .
- the regulator 1310 includes a voltage multiplier circuitry, such as a switched capacitor voltage doubler, for regulation including a voltage multiplier for test structures requiring more voltage than created by the power receivers.
- the sensitivity of the PSTS 1318 may require the input voltage to be stable, or in a narrow band of variation.
- regulator 1310 may reduce the voltage on the input line to the PSTS 1318 .
- the regulator 1310 may switch off or work in diminished capacity. It may also be possible to boost the input voltage to the PSTS 1318 .
- a feedback mechanism may signal laser 1302 to increase the amount of light delivered to photodiode 1304 . Examples of how circuit 1305 may be modified to allow for complete feedback (including too little power supply) are provided below.
- FIG. 13B illustrates a circuit 1325 for regulating an input voltage created by an external power source while enabling feedback to laser source 1302 that can be co-located in the die active area with power receivers, test/trigger receivers, test structures and detection pads.
- the circuit 1325 may include the photodiode 1304 , a reference ring oscillator 1308 , PSTS 1318 and a feedback mechanism 1326 .
- laser 1302 directs light onto photodiode 1304 .
- a bank of photodiodes may be used.
- the ring oscillators 1326 provide a frequency output directly related and varied by the voltage from the photodiode 1304 .
- ring oscillator 1308 acts as a voltage controlled oscillator (VCO), the frequency of which is received by the feedback mechanism 1326 .
- VCO voltage controlled oscillator
- a single or a pair of capacitive pads 1328 , 1329 combine to convert the oscillating voltage into a feedback signal to modulate the laser 1302 output.
- the ring oscillator output frequency is high and out of the desired range, and the feedback signal to laser 1302 reduces the output of the laser.
- the ring oscillator output frequency is too low, and the feedback signal causes laser 1302 to increase its power.
- the combination of the VCO 1308 and feedback mechanism 1326 can be used to monitor and control laser 1302 to regulate and increase and decrease power as necessary.
- Laser control unit 1332 monitors and controls the laser's timing and power output.
- Modulator 1331 such as an acousto-optic and/or electro-optic modulator, is used to modulate the timing and amplitude output of the laser, and may be used for noise suppression also.
- FIG. 13C illustrates a circuit 1345 for regulating an input voltage created by an external power source while enabling feedback to laser source 1302 that can be co-located in the die active area with power receivers, test/trigger receivers, test structures and detection pads.
- the circuit 1345 may require fairly (relative to the power requirements for the test structure and the output buffer circuitry and drive for the pads) low levels of power.
- Circuit 1345 includes photodiode 1304 , a voltage multiplier 1342 , feedback mechanism 1326 , PSTS 1318 , and a regulator 1350 .
- the voltage multiplier is made using switched capacitor charge pumps.
- the regulator 1350 may include band-gap voltage reference 1352 , comparator 1354 , pulse-width modulator 1356 , and a shunt regulator 1358 , such as voltage buck circuits.
- the output of the laser 1302 in FIGS. 13B , and 13 C can be driven by a laser power controller to modulate its amplitude and/or gating (pulsed-mode) function.
- Application of light from laser 1302 may initiate a fairly small voltage level from photodiode 1304 .
- the voltage multiplier 1342 may multiply the voltage of photodiode 1304 so that the input voltage is more in the range of the upper and lower voltage limits for the PSTS 1318 to work properly.
- the comparator 1354 may compare the voltage on the line with the reference voltage of the band-gap voltage reference 1352 . If the reference voltage is exceeded, voltage buck circuits 1358 are triggered to drain current. This may correspond to threshold levels of each circuit's transistor being exceeded, thereby causing the respective transistor to switch at different (unaccepted) levels and times. Each voltage buck circuit 1358 may drain only a fraction of the total voltage drained. When the voltage buck circuits 1358 are switched, voltage is supplied to the pulse-width modulator 1358 . The pulse-width modulator 1356 modulates the excess voltage. The modulated excess voltage is provided to feedback mechanism 1326 . As described in FIG.
- this modulated voltage signal is used to increase or decrease laser 1302 .
- the modulated voltage causes the laser 1302 to decrease power.
- the pulsed-width modulator 1356 becomes quiet. The act of becoming quiet is an input to the laser 1302 to increase its power.
- the pulsed-width modulator 1356 may start up again.
- Laser control unit 1332 monitors and controls the laser's timing and power output.
- Modulator 1331 such as an acousto-optic and/or electro-optic modulator, is used to modulate the timing and amplitude output of the laser, and may be used for noise suppression also.
- An embodiment such as shown in FIG. 13C has several benefits. Among them, a relatively low amount of power is consumed in buffering the input voltage for the PSTS 1318 . Furthermore, the feedback to the laser 1302 directs the laser to either increase or decrease power as needed for stability and repeatability across one or more test structures distributed on one or more die, scribe regions or other locations of the wafer.
- on-chip power generation is accomplished through use of a laser beam that provides a laser source to stimulate or energize an energy receiving pad 1304 .
- a CW power signal may result.
- Some or all of the test structures on the chip may use the power signal.
- application of the power signal is concurrent or simultaneous with application of another energy beam for the test/trigger signal.
- the power signal for some or all test structures on a chip may be generated through the energized power pad.
- one source of off-chip power for causing the in-chip generation of the power signal is a laser that directs an energy beam onto a photodiode or other receiving element.
- alternative power generation mechanisms may also be used.
- FIGS. 14A and 14B illustrate an embodiment in which a thermoelectric (or reverse thermo-electric a.k.a. Seebeck effect) mechanism is coupled with a laser or other energy source in order to cause in-chip generation of a power or test signal that can be co-located in the die active area with test/trigger receivers, test structures and detection pads.
- FIG. 14A is a top view of a p-n (doped) structure that is modified to separate its “p” region 1402 from the “n” region 1410 .
- FIG. 14B is the corresponding cross-sectional view along lines A-A.
- an n-well 1404 that is electrically addressable through contact pad 1430 is added to isolate the p-well 1402 from the substrate 1406 .
- a resulting gap 1414 ( FIG. 14B ) is created.
- a conductive plate 1450 such as may be formed by metal interconnects the “p” region 1402 with the “n” region 1404 , and is placed over the “p” region 1402 , “n” region 1404 , and gap 1405 to save space.
- a laser or other energy applying source may be used to heat the pad 1450 .
- the heat excited carries in the respective “p” and “n” regions 1402 , 1410 .
- the result is that heat migrates away from or to the “p” and “n” regions 1402 , 1410 respectively, that in turn, generates a movement of charge in the opposite direction to contacts 1440 and 1442 respectively. Since the majority carriers are of opposite sign for the “p” and “n” regions, the charges add constructively to form an aggregate voltage across pads 1440 and 1442 .
- a feedback or modulating circuit can be used to regulate the power for stability and repeatability purposes.
- an inductive power generation mechanism positions in an inductive element in the die. Another inductive component is moved over the inductive element in order to generate a current in the die from the inductive element.
- a feedback or modulating circuit can be used to regulate the power for stability and repeatability purposes.
- RF signals may be used to generate a current or voltage.
- an RF signal may be applied to a resistive element to cause a voltage differential.
- a capacitive coupling may be used to generate sufficient energy to create one or both of the power and test signal.
- a feedback or modulating circuit can be used to regulate the power for stability and repeatability purposes.
- a first energy source 1108 may direct a modulated energy beam onto power receiver and modulator 1112 , so that the resulting power signal for the test structure 1120 is modulated, albeit with a very slow period when compared with test structure speed, and has actively controlled stability and constancy of power delivered and received through the use of appropriately designed receiver 1112 and its associated circuitry for feedback and modulation of the energy source.
- FIG. 15 illustrates an electromechanically non-contact and non-invasive system 1500 for stimulating, detecting and measuring electrical activity from designated locations on a wafer.
- the designated locations may correspond to locations of specialized test structures or other elements that are capable of exhibiting electrical activity that can forecast chip fabrication quality and yield, and/or be correlated to how fabrication steps, sequences or processes were performed.
- the system 1500 may be used to interpret electrical activity detected from specialized test structures placed throughout the wafer (including intra-die) co-located with power and detection circuitry, of parameters and their variations that directly relate to and impact circuit performance and can thereby forecast final and performance yield or be correlated to the impact of fabrication steps or sequences during the fabrication of the devices and integrated circuits and elements on the wafer.
- system 1500 detects and measures electrical activities of the specialized test structures, co-located power and detection circuitry, distributed throughout the wafer, including inside the active regions of die and in the scribe regions (as illustrated in FIG. 1B ).
- the test structures may exhibit electrical activity that exaggerates the presence (or absence) of attributes and results of fabrication steps or sequences. Examples of how such test structures may be implemented are described with FIGS. 4-10 .
- An embodiment described with FIG. 15 may be configured to (i) activate the test structures, and (ii) detect electrical activity from the activated test structures, in a manner consistent with embodiment of FIGS.
- first energy source 1510 generates an energy beam 1516 for receiver 1512 .
- the first energy beam 1516 may comprise optical radiation having a wavelength ⁇ 1 .
- the first receiver 1512 may correspond to a photoreceiver (e.g. a photodiode) disposed on a surface of the die 1550 .
- the first receiver 1512 is a photodiode or similar device.
- the first energy source 1510 may be a device such as a continuous wave CW power laser (e.g. a laser diode or gas or solid-state laser) or other similar device with appropriate wavelength to ensure high efficiency coupling and absorption and containment within the photodiode structure.
- the wavelength spectrum of the electromagnetic radiation emitted by the first energy source 1510 may overlap within the sensitivity region of the first receiver 1512 . This energizes first receiver 1512 to produce and convert the electromagnetic energy to electrical power 1518 .
- receiver 1512 may correspond to an electromagnetic power receiver similar to the structure of a transformer.
- a second receiver 1522 is arranged inside the die 1550 so as to be appropriately coupled with the second energy source 1520 .
- the second receiver 1522 may also be a photodiode or a similar electro-optical device, or a metal line or dielectric for e-beam or ion-beam energy sources and beams, respectively.
- the second energy source 1520 may be a modulated power source, providing a modulated beam 1526 .
- the second energy source 1520 may be a time and/or amplitude modulated pulsed laser.
- the modulated beam 1526 may have a wavelength ⁇ 2 , which may be different from the wavelength ⁇ 1 of the energy beam 1516 .
- the second receiver 1522 is energized by the modulated beam 1526 to generate an alternating or modulating test/trigger signal 1528 .
- the power signal 1518 may be conditioned by a power conditioner 1519 prior to the signal being received by test structure 1530 .
- a signal conditioner 1529 may also condition the test/trigger signal 1528 before being received by the test structure 1530 .
- These conditioning, control and buffer circuits, similar to their associated receivers, are co-located in the active intra-die area with the test structures.
- pre- and post-control and conditioning of the energy and timing sources before the silicon/device can be achieved to further regulate the stability of the signals at the test structures.
- the detector pad 1540 may include a signal receiver mechanism for receiving the output 1538 .
- detector pad 1540 transmits the output as an electromagnetic RF signal 1555 , which could then be detected by an appropriate coupling non-contact electromagnetic RF detector 1574 .
- the signal receiver mechanism of the detector pad to electromagnetically tag the output 1538 with an unique identifier before converting that signal into an RF transmission that can be detected by an RF detector 1574 .
- the RF signal 1555 may have an electromagnetic signature associated with it that is particular and unique to each test structure 1530 .
- the signatures uniquely enable the identification of each test structures electrical activity distributed on the wafer for identification, to pinpoint and distinguish by its associated signature. This can enable concurrent and simultaneous stimulation and detection of test structures on one or more one die and/or throughout the wafer.
- a probe and detector configuration can be used to detect changes in the electrical potential at detector pad 1540 in a multi-beam configuration.
- the third beam 1557 which may be in the form of an electron beam, can be incident and contained within detector pad 1540 , such as a metal pad, to detect a voltage potential.
- the detected secondary electron emission collected at detector 1573 from pad 1540 will change as the surface potential of the pad is modulated by the electrical activity of test structure 1530 .
- the modulated surface potential will modulate the secondary electron emission flux giving rise to voltage contrast changes of the collected third beam 1557 , and will be detected by the detector 1573 .
- the second beam 1516 used to create a test/trigger signal 1518 can also be used to improve the signal to noise of the third beam 1557 (which may be a secondary electron-beam).
- the third beam 1557 can be an ion beam that is shone on detector pad 1540 made of dielectric on Silicon to establish a known charge or voltage potential. A capacitive coupling of this charge on pad 1540 to a probe detector 1573 will modulate coincident with the electrical activity of test structure 1530 .
- the second ion-beam 1516 used to create a test/trigger signal 1518 can be used to improve the signal to noise of the capacitive coupling.
- a single or set of node-to-node detectors may be used to detect and measure various forms of electrical activity from individual nodes of the test structure 1530 when individual nodes respond to the power signal 1518 and/or the test signal 1528 , or for the aggregate nodes of the test structure by comparing the first and last detected node.
- a detector 1572 detects electrical activity at the first node of a chain of structures 1530 .
- the detector 1572 detects electrical activity from second, and subsequent node of a chain of structures.
- the signal propagation evolution e.g.
- the node-to-node detectors are appropriate photoreceivers (e.g. photodiodes), which detect optoelectronic effects from the light/photons induced by switching activities in the individual transistors' gates and junctions in the test structures 1530 (e.g. hot-electron induced photon emission detected by probe-less time-resolves photon-counting, charge-induced electro-rectification and electro-absorption probed and detected by gated laser, etc.).
- photoreceivers e.g. photodiodes
- the node-to-node detectors are appropriate photoreceivers (e.g. photodiodes), which detect optoelectronic effects from the light/photons induced by switching activities in the individual transistors' gates and junctions in the test structures 1530 (e.g. hot-electron induced photon emission detected by probe-less time-resolves photon-counting, charge-induced electro-rectification and electro-absorption probe
- each may detect and register optoelectronic signals from various elements of the test structure 1530 .
- Each detector 1572 may be coupled by an appropriate optical train with objective lens (and/or lenses) to the appropriate junction or junction in the test structures.
- the sensitivity of the individual photo-receivers with wavelength ⁇ 1 (energy source) and ⁇ 2 (test/trigger energy source), which are characteristic of the beams from first and second energy sources 1510 , 1520 may be reduced or shielded entirely to avoid interference.
- one or more of the detectors 1572 may correspond to a time-resolved radiation detector, capable of providing high-resolution timing information on the registered hot-electron induced photon emissions.
- photo-receivers may be structured from an avalanche photodiode and the associated circuitry that have been designed to operate in time-resolved for single photon counting mode.
- a multi-channel plate photomultiplier coupled with a suitable detector, may be used as the photon counter.
- detectors can be used for detecting different types of electrical activity from individual nodes.
- Additional embodiments may employ test structures that can be activated and used with alternate intra die power sources.
- an appropriately conditioned and controlled continuous wave CW laser source may be used in conjunction with a thermo-electric Seebeck power-generating device 1522 as shown in FIG. 14 .
- an electron-beam source may be used to create the power signal 1518 .
- an electron-beam can be used as the second beam 1526 and it is directed onto second receiver 1522 , which may include, for example, of a metal line connected to a device that converts the charge (or voltage) deposited or induced by the electron-beam into a current.
- an ion-beam may be used as the second beam 1526 , and it can be directed onto the second receiver 1522 that consists, for example, of a dielectric over a semiconductor material connected to a device that converts the charge (or voltage) deposited by the ion-beam into a current.
- Additional embodiments may employ test structures that can be activated by an alternate source of test/trigger signal.
- an electron-beam may act as the first energy beam 1516 that is directed onto the first receiver 1512 that consists, for example, of a metal line connected to a device that converts charge, or voltage, into a current pulse.
- first energy beam 1516 may correspond to an ion beam can be directed onto the first receiver 1512 that consists, for example, of a dielectric over a semiconductor connected to a device that converts a voltage into a current pulse.
- a laser beam source may be used to detect electrical activity in test structure 1530 .
- the third beam 1557 can be a laser beam directed onto a detector pad 1540 that consists, for example, of a photoreceiver that changes reflectivity or voltage in response to electrical activity in test structure 1530 . Reflectivity modulation and/or voltage modulation from pad 1540 can be detected by detector 1573 and will be sensitive to electrical activity in test structure 1530 .
- the third beam 1557 can be directed onto detector pad 1540 and the modulation in a capacitively coupled signal to electrical activity in test structure 1530 can be measured with detector 1573 .
- a fourth beam 1556 such as a time-gated/modulated laser beam (e.g. mode-locked and/or gated), can be used to detect a charge(current)-induced refractive or absorptive effect/signal at a specific node's diffusion/junction. This signal will modulate during the electrical switching induced by the test/trigger signal, and can be detected by a probe and appropriately coupled photoreceiver 1572 .
- a time-gated/modulated laser beam e.g. mode-locked and/or gated
- FIG. 16 provides additional details for an apparatus that induces and measures electrical activity from within designated locations of active regions in the die that include co-located power, test/trigger, process sensitive test structures and their associated buffering, regulation and shaping circuits.
- a stimulus and probe device 1640 may be operated in conjunction with the wafer handling elements to direct stimulus and position detectors and the associated electro-optic coupling mechanism between the apparatus and the wafers devices under test (DUT).
- a wafer 1615 Prior to taking of the measurements on a specific test structure, a wafer 1615 is placed on a movable stage 1612 , which is controlled by the wafer handling and alignment unit 1611 .
- Test structures such as described in previous embodiments, may be imaged and found on the wafer 1615 through illumination (e.g.
- test structures may be placed within the active area of one or more die in wafer 1615 , and are co-located with power and test/trigger circuitry in the active area.
- the stage 1612 is moveable to achieve a predetermined alignment between the test structures disposed on the wafer 1615 and the energy sources 1604 , 1606 and/or the probe 1642 beam's and detectors 1602 and 1613 .
- Microscope unit 1609 e.g.
- Probe and detector 1642 may require the use of imaging optics (e.g. electron, ion or optical, or combinations thereof) to place and receive the probe beam and detected signal, respectively.
- imaging optics e.g. electron, ion or optical, or combinations thereof
- the process sensitive test structures may be measured after completion of a designated process step in the fabrication. Different classes of test structures may be used just after completion of a particular process step(s) or sequences(s) in the fabrication. In general, the test structures are usable to evaluate a process in the fabrication just after the first level of connectivity (e.g. first-metal layer) is completed.
- first level of connectivity e.g. first-metal layer
- the power and test signal may be applied to the test structures by a properly shaped (power modulated and noise suppressed) laser 1604 and modulating (in amplitude and/or time-gated) laser 1606 , respectively.
- the power laser 1604 may provide a constant (DC) energy beam.
- the modulating beam 1606 may cause a modulated test/trigger signal to be generated on the wafer.
- Conductive elements may be disposed within the chip/die active area to carry the power and modulated test signal to the different test structures on the chip. In this way, no mechanical contact or interconnected regions outside of the active area are required to deliver stimuli to the test structures.
- Optoelectronic signals generated at or near the test structures may be detected and measured by detector 1602 from the test structures on the wafer 1615 .
- the detector 1602 detects and measures the signals and in a time-resolved manner.
- the test signal may also result in an output signal from each test structure.
- the output signal may be carried to a RF pad or antenna at which point the signals may be detected by the radio-frequency detector 1613 .
- the detector 1602 and the radio-frequency detector 1613 may communicate with a data processing unit 1622 , which converts the respective inputs/data into formats to be used and analyzed.
- a computerized control system 1605 or other data processing unit, is used comprising a graphical user interface (GUI) 1601 , system control 1603 , wafer and test structure circuit layout/design and location database map 1630 (such as those CAD-navigation products provided by Knights Technology), stimulus control 1632 , and a data acquisition and analysis component 1622 .
- GUI graphical user interface
- Elements of the control system 1605 may be implemented as instructions carried on any computer-readable medium.
- Machines shown in FIG. 16 provide examples of processing resources and computer-readable mediums on which instructions for implementing embodiments of the invention can be carried and/or executed.
- the numerous machines shown with embodiments of the invention include processor(s) and various forms of memory for holing and manipulating data and instructions.
- the system control 1603 may implement an automatic or programmatic control of mechanical aspects of the overall apparatus shown in FIG. 16 .
- the programmatic control may be implemented through use of software or other computer-executable instructions.
- the GUI 1601 or other interface mechanism may be employed.
- the GUI 1601 enables an operator to select a fabrication and/or evaluation recipe for a DUT (Device Under Test).
- the GUI 1601 may also pass user-specified parameters and instructions to the system control 1603 .
- the system control 1603 ensures seamless operability of the system. This includes arbitrating amongst the different modules in the system, and timing the various processes performed by the different modules so that the system operates asynchronously in an efficient manner. Thus, system control 1603 ensures that when one module in the system finishes its task before another module, it will wait for the other module.
- the control system 1605 may use the wafer and test structure location database 1630 , as well as stimulus control 1632 in operation to locate and stimulate individual test structures of the DUT.
- Evaluation information which may include parameter values obtained from stimulating test structures, may be stored by the data acquisition and analysis component 1622 .
- One or more algorithms or other processes may be performed by or through the data acquisition and analysis module 1622 to convert data of the performance parameter values into other forms of evaluation information, including statistical or quantitative analysis of the DUT.
- FIG. 17 illustrates a die that is configured for use with RF output signals, according to an embodiment of the invention.
- a die 1700 may be configured to co-locate a power receiver 1720 , and a plurality of test structure classes 1732 , 1734 , 1736 and 1738 in the active area.
- the power receiver 1720 produces the intra-die power signal, which in one embodiment, is constant.
- the die 1700 may also include a co-located test/trigger receiver 1710 in the active area for receiving and using test signals on distributed test structures.
- the test structures may be activated, through stimulus in the application of a power signal, and possibly a trigger in the application of a test/trigger signal. When activated, each test structure (e.g.
- a 1 -A 4 ) in a particular class 1732 - 1738 may exhibit electrical activity, such as in the form of optical, optoelectronic, and/or radio frequency signals.
- a probe head may be brought into non-contact coupling to engage with the die 1700 for purpose of energizing the test/trigger receiver 1710 and power receiver 1720 . Delivery of either (i) one energy beam to both the test/trigger receiver 1710 and power receiver 1720 or (ii) separate energy beams to each of the test/trigger receiver 1710 and power receiver 1720 , may be accomplished through use of the probe head device that carries one or two (or more) sources of energy.
- output signals and detection pads 1730 may be co-located in the active area, and used with corresponding test structure.
- One embodiment generates RF signals that correspond to test structure outputs.
- the RF signals may carry output information that includes switching speeds, slew rates, phase delays and other performance parameter values of a corresponding test structure, series of test structures, or set of test structures.
- one or more RF detection pads 1730 are used, so that the output may be in the form of an RF signal.
- the probe head may be equipped to detect the RF signal from each detection pad 1730 provided on the die 1700 .
- each RF signal may incorporate a signature or other identification mechanism to identify that RF signal over all other RF signals emitted from the chip or wafer.
- test structures 1732 - 1738 may feed output signals to the RF pad, and transmissions from RF pad may identify each output signal based on a signature assigned to a specific test structure and/or a class of test structures, thereby achieving simultaneous pickup of multiple device responses.
- each of the test structure 1732 - 1738 may have its own RF pad to transmit its output signal.
- test/trigger and power receptors there may be multiple test/trigger receptors and power receptors, but that one test/trigger and power receptor can service multiple test structures and classes of test structures.
- the use of isolated test/trigger and power receptors that feed into multiple test structures allows for the test/trigger and power receptors to be energized simultaneously.
- multiple test/trigger and power receptors are used in order to use the test structures at different processing steps.
- multiple test/trigger and power receptors are used in order to use the test structures at different locations on the die 1700 .
- RF signals carry an aggregate signal for an overall test structure, or series of test structures.
- Other techniques for measuring such aggregate signals exist such as node-to-node detector systems that measure the first and last node in the aggregate test structure.
- node-to-node (intra-test structure) measurements may be made using, for example, optoelectronic signals.
- FIG. 18 describes a method for operating an apparatus such as described in FIGS. 15-16 , according to one embodiment of the invention.
- Step 1810 provides that a test probe is brought into operational proximity of a wafer that is to be tested. This may include locating designated locations of die were testing is to be performed.
- a test probe may be brought into operational proximity with a wafer. This may include sub-steps of macro-alignment and micro-alignment.
- the macro-alignment may correspond to the probe head reading an optical marker on a surface of the wafer to receive the information for locating where the tests are to be performed.
- a similar micro-alignment may be performed within the boundaries of the chip.
- the probe head is brought into operational proximity to the receptors for the power and test/trigger receivers on the chip.
- the wafer may be in a partially or completely fabricated step.
- Step 1820 provides that the test/trigger and power receivers are energized in a contact-less, non-invasive and non-destructive manner. This may correspond to energizing the receivers with laser beams, such as described with FIGS. 15 and 16 .
- the probe head detects electrical activity from the various locations in the chip where test structures and/or detector pads are located.
- photon detectors 1572 detect photons from nodes within a test structure.
- the RF detector 1574 detects RF transmissions from detector pads 1540 .
- probe and detector 1573 detects electrical activity using, for example, electron-beam voltage contrast.
- the probe head may make the measurements simultaneously, or move over various locations on the chip in order to make the measurements.
- step 1840 the electrical activity that was detected from the test structures is used to evaluate the fabrication of the wafer.
Abstract
Description
P=F(L,W,T ox ,I SDE, . . . ) (1)
where, for example, L and W are device gate length and width, respectively, Tox is the gate oxide thickness, and ISDE is the source-drain extension implant dose. P is also dependent on other parameters such as interconnect parameters, which are omitted here for conciseness. A fabrication process variation, which corresponds to a variance of a physical property produced by that process or step, induces a measurable variance in P that can be approximated to first order by:
ΔP| sl ≈∂F/∂L·ΔL| sl +∂F/∂W·ΔW| sl +∂F/∂T ox ·ΔT ox|sl+ (2)
evaluated after a specific process step s and at a specific location l, and where ∂F/∂X is the response of F to the influence of variable X (L, W, etc. . . . ).
ΔP≈∂F/∂L·ΔL (3)
and the variance that is measured from this switching circuit ΔP will be proportional to the process variance associated with gate length, ΔL.
Claims (57)
Priority Applications (2)
| Application Number | Priority Date | Filing Date | Title |
|---|---|---|---|
| US10/927,275 US7730434B2 (en) | 2003-08-25 | 2004-08-25 | Contactless technique for evaluating a fabrication of a wafer |
| US12/791,665 US8990759B2 (en) | 2003-08-25 | 2010-06-01 | Contactless technique for evaluating a fabrication of a wafer |
Applications Claiming Priority (3)
| Application Number | Priority Date | Filing Date | Title |
|---|---|---|---|
| US49794503P | 2003-08-25 | 2003-08-25 | |
| US56316804P | 2004-04-15 | 2004-04-15 | |
| US10/927,275 US7730434B2 (en) | 2003-08-25 | 2004-08-25 | Contactless technique for evaluating a fabrication of a wafer |
Related Child Applications (1)
| Application Number | Title | Priority Date | Filing Date |
|---|---|---|---|
| US12/791,665 Continuation US8990759B2 (en) | 2003-08-25 | 2010-06-01 | Contactless technique for evaluating a fabrication of a wafer |
Publications (2)
| Publication Number | Publication Date |
|---|---|
| US20050085932A1 US20050085932A1 (en) | 2005-04-21 |
| US7730434B2 true US7730434B2 (en) | 2010-06-01 |
Family
ID=34221544
Family Applications (11)
| Application Number | Title | Priority Date | Filing Date |
|---|---|---|---|
| US10/927,260 Active 2024-09-21 US7220990B2 (en) | 2003-08-25 | 2004-08-25 | Technique for evaluating a fabrication of a die and wafer |
| US10/927,275 Expired - Fee Related US7730434B2 (en) | 2003-08-25 | 2004-08-25 | Contactless technique for evaluating a fabrication of a wafer |
| US10/927,406 Active 2025-01-31 US7339388B2 (en) | 2003-08-25 | 2004-08-25 | Intra-clip power and test signal generation for use with test structures on wafers |
| US10/927,258 Active 2025-06-23 US7256055B2 (en) | 2003-08-25 | 2004-08-25 | System and apparatus for using test structures inside of a chip during the fabrication of the chip |
| US11/469,305 Active 2024-12-05 US8344745B2 (en) | 2003-08-25 | 2006-08-31 | Test structures for evaluating a fabrication of a die or a wafer |
| US11/738,219 Active US7423288B2 (en) | 2003-08-25 | 2007-04-20 | Technique for evaluating a fabrication of a die and wafer |
| US11/762,944 Expired - Fee Related US7736916B2 (en) | 2003-08-25 | 2007-06-14 | System and apparatus for using test structures inside of a chip during the fabrication of the chip |
| US11/763,001 Abandoned US20070236232A1 (en) | 2003-08-25 | 2007-06-14 | System and apparatus for using test structures inside of a chip during the fabrication of the chip |
| US11/935,297 Expired - Fee Related US7605597B2 (en) | 2003-08-25 | 2007-11-05 | Intra-chip power and test signal generation for use with test structures on wafers |
| US12/196,032 Expired - Fee Related US7723724B2 (en) | 2003-08-25 | 2008-08-21 | System for using test structures to evaluate a fabrication of a wafer |
| US12/791,665 Expired - Fee Related US8990759B2 (en) | 2003-08-25 | 2010-06-01 | Contactless technique for evaluating a fabrication of a wafer |
Family Applications Before (1)
| Application Number | Title | Priority Date | Filing Date |
|---|---|---|---|
| US10/927,260 Active 2024-09-21 US7220990B2 (en) | 2003-08-25 | 2004-08-25 | Technique for evaluating a fabrication of a die and wafer |
Family Applications After (9)
| Application Number | Title | Priority Date | Filing Date |
|---|---|---|---|
| US10/927,406 Active 2025-01-31 US7339388B2 (en) | 2003-08-25 | 2004-08-25 | Intra-clip power and test signal generation for use with test structures on wafers |
| US10/927,258 Active 2025-06-23 US7256055B2 (en) | 2003-08-25 | 2004-08-25 | System and apparatus for using test structures inside of a chip during the fabrication of the chip |
| US11/469,305 Active 2024-12-05 US8344745B2 (en) | 2003-08-25 | 2006-08-31 | Test structures for evaluating a fabrication of a die or a wafer |
| US11/738,219 Active US7423288B2 (en) | 2003-08-25 | 2007-04-20 | Technique for evaluating a fabrication of a die and wafer |
| US11/762,944 Expired - Fee Related US7736916B2 (en) | 2003-08-25 | 2007-06-14 | System and apparatus for using test structures inside of a chip during the fabrication of the chip |
| US11/763,001 Abandoned US20070236232A1 (en) | 2003-08-25 | 2007-06-14 | System and apparatus for using test structures inside of a chip during the fabrication of the chip |
| US11/935,297 Expired - Fee Related US7605597B2 (en) | 2003-08-25 | 2007-11-05 | Intra-chip power and test signal generation for use with test structures on wafers |
| US12/196,032 Expired - Fee Related US7723724B2 (en) | 2003-08-25 | 2008-08-21 | System for using test structures to evaluate a fabrication of a wafer |
| US12/791,665 Expired - Fee Related US8990759B2 (en) | 2003-08-25 | 2010-06-01 | Contactless technique for evaluating a fabrication of a wafer |
Country Status (5)
| Country | Link |
|---|---|
| US (11) | US7220990B2 (en) |
| EP (1) | EP1665362A2 (en) |
| JP (4) | JP5340538B2 (en) |
| TW (1) | TWI276147B (en) |
| WO (1) | WO2005020297A2 (en) |
Cited By (13)
| Publication number | Priority date | Publication date | Assignee | Title |
|---|---|---|---|---|
| US20090001369A1 (en) * | 2007-06-28 | 2009-01-01 | Lin Wallace W | Evaluation method for interconnects interacted with integrated-circuit manufacture |
| US20100115475A1 (en) * | 2008-10-30 | 2010-05-06 | Buonpane Michael S | Integrated Circuit Performance Enhancement Using On-Chip Adaptive Voltage Scaling |
| US20100181847A1 (en) * | 2009-01-22 | 2010-07-22 | Shen-Yu Huang | Method for reducing supply voltage drop in digital circuit block and related layout architecture |
| US20100237345A1 (en) * | 2009-03-18 | 2010-09-23 | Tdk Corporation | Wafer and manufacturing method of electronic component |
| US20100304509A1 (en) * | 2003-08-25 | 2010-12-02 | Majid Aghababazadeh | Contactless technique for evaluating a fabrication of a wafer |
| US20110047523A1 (en) * | 2006-11-01 | 2011-02-24 | Garcia Ii John D | Differential voltage defectivity monitoring method |
| US20120023464A1 (en) * | 2010-01-15 | 2012-01-26 | Semiconductor Manufacturing International (Shanghai) Corporation | Automatic identification of systematic repeating defects in semiconductor production |
| US20130174115A1 (en) * | 2010-03-16 | 2013-07-04 | Synopsys, Inc. | Modeling of cell delay change for electronic design automation |
| US8494817B1 (en) * | 2006-11-30 | 2013-07-23 | Pdf Solutions, Inc. | Methods for yield variability benchmarking, assessment, quantification, and localization |
| US20140046466A1 (en) * | 2012-08-09 | 2014-02-13 | International Business Machines Corporation | Integrated circuit product yield optimization using the results of performance path testing |
| US20150213952A1 (en) * | 2014-01-30 | 2015-07-30 | Hamilton Sundstrand Corporation | Multilayer capacitor with integrated busbar |
| US9666411B1 (en) | 2014-11-14 | 2017-05-30 | Kla-Tencor Corporation | Virtual ground for target substrate using floodgun and feedback control |
| US10060973B1 (en) * | 2014-05-29 | 2018-08-28 | National Technology & Engineering Solutions Of Sandia, Llc | Test circuits for integrated circuit counterfeit detection |
Families Citing this family (173)
| Publication number | Priority date | Publication date | Assignee | Title |
|---|---|---|---|---|
| US6642136B1 (en) * | 2001-09-17 | 2003-11-04 | Megic Corporation | Method of making a low fabrication cost, high performance, high reliability chip scale package |
| CA2308820A1 (en) * | 2000-05-15 | 2001-11-15 | The Governors Of The University Of Alberta | Wireless radio frequency technique design and method for testing of integrated circuits and wafers |
| US6850080B2 (en) * | 2001-03-19 | 2005-02-01 | Semiconductor Energy Laboratory Co., Ltd. | Inspection method and inspection apparatus |
| SG117406A1 (en) * | 2001-03-19 | 2005-12-29 | Miconductor Energy Lab Co Ltd | Method of manufacturing a semiconductor device |
| US7099293B2 (en) * | 2002-05-01 | 2006-08-29 | Stmicroelectronics, Inc. | Buffer-less de-skewing for symbol combination in a CDMA demodulator |
| CN1650296A (en) * | 2002-02-28 | 2005-08-03 | Pdf技术公司 | Back end of line clone test vehicle |
| US7020859B2 (en) * | 2003-06-02 | 2006-03-28 | Lsi Logic Corporation | Process skew results for integrated circuits |
| JP2007531983A (en) * | 2003-10-15 | 2007-11-08 | ピー・デイ・エフ ソリユーシヨンズ インコーポレイテツド | Method and arrangement for connecting test structures or line arrays for monitoring integrated circuit manufacturing |
| TWI228226B (en) * | 2003-11-21 | 2005-02-21 | Taiwan Semiconductor Mfg | Dummy pattern layout method for improving film planarization |
| GB0329516D0 (en) * | 2003-12-19 | 2004-01-28 | Univ Kent Canterbury | Integrated circuit with debug support interface |
| US7518391B2 (en) * | 2004-02-17 | 2009-04-14 | Applied Materials, Israel, Ltd. | Probe card and a method for detecting defects using a probe card and an additional inspection |
| CN100413018C (en) * | 2004-06-14 | 2008-08-20 | 中芯国际集成电路制造(上海)有限公司 | Method and system for treating identity of semiconductor device |
| CN100428401C (en) * | 2004-06-14 | 2008-10-22 | 中芯国际集成电路制造(上海)有限公司 | Method and system for treating similarity of semiconductor device finished product ratio |
| US20060060955A1 (en) * | 2004-09-22 | 2006-03-23 | Texas Instruments Incorporated | Stacked die infrared transceiver bus |
| US7346869B2 (en) * | 2004-10-29 | 2008-03-18 | Synopsys, Inc. | Power network analyzer for an integrated circuit design |
| US7353490B2 (en) | 2004-10-29 | 2008-04-01 | Synopsys, Inc. | Power network synthesizer for an integrated circuit design |
| US7536658B2 (en) * | 2004-10-29 | 2009-05-19 | Synopsys, Inc. | Power pad synthesizer for an integrated circuit design |
| US7200824B1 (en) * | 2004-11-16 | 2007-04-03 | Altera Corporation | Performance/power mapping of a die |
| US7200257B2 (en) * | 2005-05-05 | 2007-04-03 | International Business Machines Corporation | Structure and methodology for fabrication and inspection of photomasks |
| US7310585B2 (en) * | 2005-05-12 | 2007-12-18 | International Business Machines Corporation | Method of inspecting integrated circuits during fabrication |
| JP5000104B2 (en) * | 2005-06-22 | 2012-08-15 | 浜松ホトニクス株式会社 | Semiconductor failure analysis apparatus, failure analysis method, failure analysis program, and failure analysis system |
| US20070042510A1 (en) * | 2005-08-19 | 2007-02-22 | Wafermasters, Incorporated | In situ process monitoring and control |
| US7733100B2 (en) | 2005-08-26 | 2010-06-08 | Dcg Systems, Inc. | System and method for modulation mapping |
| WO2007036868A2 (en) * | 2005-09-27 | 2007-04-05 | Nxp B.V. | Wafer with scribe lanes comprising active circuits for die testing of complementary signal processing parts |
| JP2009516908A (en) * | 2005-09-27 | 2009-04-23 | エヌエックスピー ビー ヴィ | Wafer with scribe lane containing active circuitry for external pads and / or die test |
| CN100395878C (en) * | 2005-09-29 | 2008-06-18 | 中芯国际集成电路制造(上海)有限公司 | Method and system for semiconductor device reliability similarity |
| US7474979B1 (en) * | 2005-12-20 | 2009-01-06 | Cypress Semiconductor Corporation | Integrated circuit device test system and method |
| US8000826B2 (en) * | 2006-01-24 | 2011-08-16 | Synopsys, Inc. | Predicting IC manufacturing yield by considering both systematic and random intra-die process variations |
| US8060324B2 (en) * | 2006-02-01 | 2011-11-15 | Freescale Semiconductor, Inc. | Device and a method for estimating transistor parameter variations |
| US7393703B2 (en) * | 2006-05-10 | 2008-07-01 | International Business Machines Corporation | Method for reducing within chip device parameter variations |
| US20070263472A1 (en) * | 2006-05-11 | 2007-11-15 | Anderson Brent A | Process environment variation evaluation |
| JP4791267B2 (en) * | 2006-06-23 | 2011-10-12 | 株式会社日立ハイテクノロジーズ | Defect inspection system |
| US7648847B2 (en) * | 2006-06-26 | 2010-01-19 | Hamilton Sundstrand Corporation | In-situ monitoring and method to determine accumulated printed wiring board thermal and/or vibration stress fatigue using a mirrored monitor chip and continuity circuit |
| US7532024B2 (en) * | 2006-07-05 | 2009-05-12 | Optimaltest Ltd. | Methods and systems for semiconductor testing using reference dice |
| US7416986B2 (en) * | 2006-09-05 | 2008-08-26 | International Business Machines Corporation | Test structure and method for detecting via contact shorting in shallow trench isolation regions |
| US7619229B2 (en) * | 2006-10-16 | 2009-11-17 | Varian Semiconductor Equipment Associates, Inc. | Technique for matching performance of ion implantation devices using an in-situ mask |
| US7853851B1 (en) * | 2006-11-06 | 2010-12-14 | Oracle America, Inc. | Method and apparatus for detecting degradation in an integrated circuit chip |
| US8275596B2 (en) * | 2006-12-08 | 2012-09-25 | Globalfoundries Inc. | Method for robust statistical semiconductor device modeling |
| US7616021B2 (en) * | 2007-01-18 | 2009-11-10 | Advanced Micro Devices, Inc. | Method and device for determining an operational lifetime of an integrated circuit device |
| US7571021B2 (en) * | 2007-02-13 | 2009-08-04 | Taiwan Semiconductor Manufacturing Company | Method and system for improving critical dimension uniformity |
| US7932103B2 (en) * | 2007-02-28 | 2011-04-26 | Globalfoundries Inc. | Integrated circuit system with MOS device |
| US7656182B2 (en) * | 2007-03-21 | 2010-02-02 | International Business Machines Corporation | Testing method using a scalable parametric measurement macro |
| US8190391B2 (en) * | 2007-03-29 | 2012-05-29 | Globalfoundries Inc. | Determining die performance by incorporating neighboring die performance metrics |
| US20080262769A1 (en) * | 2007-04-23 | 2008-10-23 | Daniel Kadosh | Using multivariate health metrics to determine market segment and testing requirements |
| US8041518B2 (en) * | 2007-05-08 | 2011-10-18 | Globalfoundries Inc. | Determining die test protocols based on process health |
| US20090006014A1 (en) * | 2007-06-27 | 2009-01-01 | International Business Machines Corporation | Non-Destructive Electrical Characterization Macro and Methodology for In-Line Interconnect Spacing Monitoring |
| US7560946B2 (en) * | 2007-08-10 | 2009-07-14 | International Business Machines Corporation | Method of acceptance for semiconductor devices |
| US7939348B2 (en) * | 2007-08-28 | 2011-05-10 | Chartered Semiconductor Manufacturing, Ltd. | E-beam inspection structure for leakage analysis |
| US20090070722A1 (en) * | 2007-09-06 | 2009-03-12 | Jeanne Bickford | Method for generating device model overrides through the use of on-chip parametric measurement macros |
| US7774670B2 (en) * | 2007-09-11 | 2010-08-10 | Globalfoundries Inc. | Method and apparatus for dynamically determining tester recipes |
| US20090119357A1 (en) * | 2007-11-05 | 2009-05-07 | International Business Machines Corporation | Advanced correlation and process window evaluation application |
| WO2009065040A1 (en) * | 2007-11-14 | 2009-05-22 | The Trustees Of Columbia University In The City Of New York | Systems and methods for providing power to a device under test |
| US20090147255A1 (en) * | 2007-12-07 | 2009-06-11 | Erington Kent B | Method for testing a semiconductor device and a semiconductor device testing system |
| US7734972B2 (en) * | 2008-01-23 | 2010-06-08 | Intel Corporation | Common test logic for multiple operation modes |
| US9117045B2 (en) * | 2008-02-14 | 2015-08-25 | International Business Machines Coporation | System and method to predict chip IDDQ and control leakage components |
| US7868606B2 (en) * | 2008-02-15 | 2011-01-11 | International Business Machines Corporation | Process variation on-chip sensor |
| CA2623257A1 (en) * | 2008-02-29 | 2009-08-29 | Scanimetrics Inc. | Method and apparatus for interrogating an electronic component |
| US8580344B2 (en) * | 2008-03-17 | 2013-11-12 | Intermolecular, Inc. | Stamp usage to enhance surface layer functionalization and selectivity |
| FR2929013B1 (en) * | 2008-03-21 | 2010-05-21 | Commissariat Energie Atomique | STRUCTURE FOR TESTING MOS CAPACITY AND METHOD OF MEASURING A CAPACITY CURVE ACCORDING TO THE VOLTAGE ASSOCIATED WITH |
| US8097474B2 (en) | 2008-03-24 | 2012-01-17 | International Business Machines Corporation | Integrated circuit chip design flow methodology including insertion of on-chip or scribe line wireless process monitoring and feedback circuitry |
| US8239811B2 (en) * | 2008-03-24 | 2012-08-07 | International Business Machines Corporation | System and method for wireless and dynamic intra-process measurement of integrated circuit parameters |
| US7719299B2 (en) * | 2008-04-02 | 2010-05-18 | Texas Instruments Incorporated | Process and temperature insensitive flicker noise monitor circuit |
| US7723588B2 (en) * | 2008-05-13 | 2010-05-25 | Monsanto Technology Llc | Plants and seeds of hybrid corn variety CH464638 |
| JP5306343B2 (en) * | 2008-05-29 | 2013-10-02 | 株式会社アドバンテスト | Test substrate manufacturing apparatus, test substrate manufacturing method, and program |
| US7908109B2 (en) * | 2008-07-08 | 2011-03-15 | Advanced Micro Devices, Inc. | Identifying manufacturing disturbances using preliminary electrical test data |
| US8643539B2 (en) * | 2008-11-19 | 2014-02-04 | Nokomis, Inc. | Advance manufacturing monitoring and diagnostic tool |
| US8363922B2 (en) * | 2009-02-12 | 2013-01-29 | International Business Machines Corporation | IC layout pattern matching and classification system and method |
| US8229588B2 (en) * | 2009-03-03 | 2012-07-24 | Taiwan Semiconductor Manufacturing Company, Ltd. | Method and system for tuning advanced process control parameters |
| TWI388953B (en) * | 2009-03-11 | 2013-03-11 | Inotera Memories Inc | Method for monitoring fabrication parameters |
| TWI391684B (en) * | 2009-03-20 | 2013-04-01 | King Yuan Electronics Co Ltd | Method and apparatus for improving yield ratio of testing |
| DE102009002432A1 (en) * | 2009-04-16 | 2010-10-28 | Airbus Deutschland Gmbh | Method for the feedback-based optimization of a measurement data life cycle in joining processes in production |
| SG10201401887YA (en) | 2009-05-01 | 2014-06-27 | Dcg Systems Inc | Systems and method for laser voltage imaging state mapping |
| US8305106B2 (en) * | 2009-08-24 | 2012-11-06 | California Institute Of Technology | Electronic self-healing methods for radio-frequency receivers |
| JP5436146B2 (en) * | 2009-10-23 | 2014-03-05 | パナソニック株式会社 | Wafer inspection equipment |
| WO2011064624A1 (en) | 2009-11-30 | 2011-06-03 | Freescale Semiconductor, Inc. | Bypass capacitor circuit and method of providing a bypass capacitance for an integrated circuit die |
| TWI499876B (en) * | 2009-12-09 | 2015-09-11 | Pc Fan Technology Inc | Method for monitoring semiconductor device |
| GB2477358A (en) * | 2010-02-02 | 2011-08-03 | Thales Holdings Uk Plc | RF testing an integrated circuit assembly during manufacture using a interposed adaptor layer which is removed after test to attach the IC to a BGA |
| JP5314634B2 (en) * | 2010-05-17 | 2013-10-16 | 株式会社アドバンテスト | Test apparatus, test method, and device interface |
| DE102010046214A1 (en) * | 2010-09-21 | 2012-03-22 | Infineon Technologies Ag | Wafer test structure has interface that is connected to integrated test circuit, for receiving and outputting test data |
| TWI475187B (en) * | 2010-10-27 | 2015-03-01 | Hitachi High Tech Corp | Image processing devices and computer programs |
| JP2012155081A (en) * | 2011-01-25 | 2012-08-16 | Toshiba Corp | Pattern arrangement method of exposure mask |
| US8443309B2 (en) | 2011-03-04 | 2013-05-14 | International Business Machines Corporation | Multifeature test pattern for optical proximity correction model verification |
| FR2973564A1 (en) * | 2011-04-01 | 2012-10-05 | St Microelectronics Rousset | SECURING A PLATE OF ELECTRONIC CIRCUITS |
| FR2973935A1 (en) * | 2011-04-11 | 2012-10-12 | St Microelectronics Rousset | METHOD FOR EVALUATING A SEMICONDUCTOR WAFER CUTTING PROCESS |
| US9086453B2 (en) * | 2011-05-17 | 2015-07-21 | Marvell Inernational Ltd. | Method and apparatus for testing integrated circuits |
| US8744370B2 (en) * | 2011-05-18 | 2014-06-03 | Agilent Technologies, Inc. | System for characterizing mixer or converter response |
| US8742782B2 (en) * | 2011-07-27 | 2014-06-03 | International Business Machines Corporation | Noncontact electrical testing with optical techniques |
| TWI506288B (en) * | 2011-09-26 | 2015-11-01 | United Microelectronics Corp | Transistor array for testing |
| CN102435936B (en) * | 2011-11-23 | 2013-09-04 | 华南师范大学 | Single photon detection method and system for faults of integrated circuit |
| US8901916B2 (en) * | 2011-12-22 | 2014-12-02 | Lenovo Enterprise Solutions (Singapore) Pte. Ltd. | Detecting malicious hardware by measuring radio frequency emissions |
| US8754412B2 (en) | 2012-01-03 | 2014-06-17 | International Business Machines Corporation | Intra die variation monitor using through-silicon via |
| US8947118B2 (en) * | 2012-02-13 | 2015-02-03 | Texas Instruments Incorporated | Defect detection in integrated circuit devices |
| US8679863B2 (en) * | 2012-03-15 | 2014-03-25 | International Business Machines Corporation | Fine tuning highly resistive substrate resistivity and structures thereof |
| KR20130119280A (en) * | 2012-04-23 | 2013-10-31 | 한국전자통신연구원 | System and method for auto-calibration of integrated circuit chips at wafer level |
| US8627251B2 (en) * | 2012-04-25 | 2014-01-07 | Taiwan Semiconductor Manufacturing Co., Ltd. | Systems and methods of automatically detecting failure patterns for semiconductor wafer fabrication processes |
| US8759163B2 (en) * | 2012-04-30 | 2014-06-24 | Taiwan Semiconductor Manufacturing Co., Ltd. | Layout of a MOS array edge with density gradient smoothing |
| US9291665B2 (en) | 2012-05-14 | 2016-03-22 | Globalfoundries Inc. | Evaluating transistors with e-beam inspection |
| US8969104B2 (en) | 2012-06-05 | 2015-03-03 | International Business Machines Corporation | Circuit technique to electrically characterize block mask shifts |
| US9425112B2 (en) | 2012-06-07 | 2016-08-23 | Taiwan Semiconductor Manufacturing Company, Ltd. | Calibration kits for RF passive devices |
| US9069014B2 (en) * | 2012-06-30 | 2015-06-30 | Intel Corporation | Wire probe assembly and forming process for die testing |
| TW201411161A (en) * | 2012-09-11 | 2014-03-16 | Etron Technology Inc | Chip capable of improving test coverage of pads and related method thereof |
| US8765536B2 (en) * | 2012-09-28 | 2014-07-01 | International Business Machines Corporation | Stress engineered multi-layers for integration of CMOS and Si nanophotonics |
| US8916955B2 (en) | 2012-10-17 | 2014-12-23 | Taiwan Semiconductor Manufacturing Co., Ltd. | Nearly buffer zone free layout methodology |
| TWI506283B (en) * | 2012-11-12 | 2015-11-01 | Mpi Corp | Low power loss probe card structure |
| US8966431B2 (en) * | 2012-11-21 | 2015-02-24 | International Business Machines Corporation | Semiconductor timing improvement |
| US8717084B1 (en) * | 2012-12-06 | 2014-05-06 | Arm Limited | Post fabrication tuning of an integrated circuit |
| US8978000B2 (en) | 2012-12-27 | 2015-03-10 | Taiwan Semiconductor Manufacturing Co. Ltd. | Performance-driven and gradient-aware dummy insertion for gradient-sensitive array |
| US20140184242A1 (en) * | 2013-01-02 | 2014-07-03 | International Business Machines Corporation | In-Line Transistor Bandwidth Measurement |
| US9536796B2 (en) | 2013-01-02 | 2017-01-03 | Globalfoundries Inc. | Multiple manufacturing line qualification |
| US9514999B2 (en) | 2013-01-02 | 2016-12-06 | Globalfoundries Inc. | Systems and methods for semiconductor line scribe line centering |
| US8904329B2 (en) | 2013-01-07 | 2014-12-02 | International Business Machines Corporation | Systems and methods for single cell product path delay analysis |
| US9129082B2 (en) * | 2013-02-28 | 2015-09-08 | Taiwan Semiconductor Manufacturing Company Limited | Variation factor assignment |
| US9048141B2 (en) * | 2013-02-28 | 2015-06-02 | Robert Bosch Gmbh | Method for aligning a biochip |
| DE102013102322B4 (en) | 2013-03-08 | 2018-05-30 | Osram Opto Semiconductors Gmbh | Method and device for measuring and optimizing an optoelectronic component |
| US10429319B2 (en) | 2013-03-20 | 2019-10-01 | Kla-Tencor Corporation | Inspection system including parallel imaging paths with multiple and selectable spectral bands |
| US9160949B2 (en) | 2013-04-01 | 2015-10-13 | Omnivision Technologies, Inc. | Enhanced photon detection device with biased deep trench isolation |
| US9136187B2 (en) * | 2013-07-12 | 2015-09-15 | Samsung Electronics Co., Ltd. | Method of adjusting a threshold voltage of a transistor in the forming of a semiconductor device including the transistor |
| CN105659251B (en) * | 2013-11-04 | 2019-03-12 | 马维尔国际贸易有限公司 | Method and apparatus for verifying semiconductor bare chip |
| US9870896B2 (en) * | 2013-12-06 | 2018-01-16 | Taiwan Semiconductor Manufacturing Co., Ltd. | System and method for controlling ion implanter |
| US9318399B2 (en) * | 2013-12-19 | 2016-04-19 | Globalfoundries Singapore Pte. Ltd. | Semiconductor wafers employing a fixed-coordinate metrology scheme and methods for fabricating integrated circuits using the same |
| US10114040B1 (en) | 2013-12-20 | 2018-10-30 | The United States Of America As Represented By The Administrator Of National Aeronautics And Space Administration | High/low temperature contactless radio frequency probes |
| CN103794597B (en) * | 2014-01-26 | 2017-01-04 | 杭州广立微电子有限公司 | The optional method of testing connected or disconnect objective chip to be measured |
| US9171765B2 (en) * | 2014-02-21 | 2015-10-27 | Globalfoundries Inc. | Inline residual layer detection and characterization post via post etch using CD-SEM |
| CN103855050B (en) * | 2014-03-27 | 2016-08-17 | 上海华力微电子有限公司 | wafer yield monitoring method |
| WO2015192069A1 (en) * | 2014-06-12 | 2015-12-17 | Pdf Solutions, Inc. | Opportunistic placement of ic test structures and/or e-beam target pads in areas otherwise used for filler cells, tap cells, decap cells, scribe lines, and/or dummy fill, as well as product ic chips containing same |
| US9535119B2 (en) * | 2014-06-30 | 2017-01-03 | Intel Corporation | Duty cycle based timing margining for I/O AC timing |
| US20160071048A1 (en) * | 2014-09-08 | 2016-03-10 | Xerox Corporation | Methods and systems for crowdsourcing of tasks |
| DE102014222203B3 (en) * | 2014-10-30 | 2016-03-10 | Infineon Technologies Ag | Check for marginal damage |
| US10199283B1 (en) | 2015-02-03 | 2019-02-05 | Pdf Solutions, Inc. | Method for processing a semiconductor wager using non-contact electrical measurements indicative of a resistance through a stitch, where such measurements are obtained by scanning a pad comprised of at least three parallel conductive stripes using a moving stage with beam deflection to account for motion of the stage |
| US9805994B1 (en) | 2015-02-03 | 2017-10-31 | Pdf Solutions, Inc. | Mesh-style NCEM pads, and process for making semiconductor dies, chips, and wafers using in-line measurements from such pads |
| US9799575B2 (en) | 2015-12-16 | 2017-10-24 | Pdf Solutions, Inc. | Integrated circuit containing DOEs of NCEM-enabled fill cells |
| CN104678974B (en) * | 2015-03-03 | 2018-06-15 | 深圳市华星光电技术有限公司 | To product processing procedure into the method controlled in real time on line |
| US9875536B2 (en) * | 2015-03-31 | 2018-01-23 | Kla-Tencor Corp. | Sub-pixel and sub-resolution localization of defects on patterned wafers |
| US9554506B2 (en) * | 2015-04-27 | 2017-01-31 | Cnh Industrial America Llc | Fluid flow monitoring and control system for an agricultural sprayer |
| CN106291106B (en) * | 2015-05-20 | 2017-10-27 | 北京理工大学 | Multichannel width phase test system |
| US9704748B2 (en) | 2015-06-25 | 2017-07-11 | Infineon Technologies Ag | Method of dicing a wafer |
| US9891276B2 (en) | 2015-07-28 | 2018-02-13 | International Business Machines Corporation | Performance-screen ring oscillator (PSRO) using an integrated circuit test signal distribution network |
| US10978438B1 (en) | 2015-12-16 | 2021-04-13 | Pdf Solutions, Inc. | IC with test structures and E-beam pads embedded within a contiguous standard cell area |
| US10593604B1 (en) | 2015-12-16 | 2020-03-17 | Pdf Solutions, Inc. | Process for making semiconductor dies, chips, and wafers using in-line measurements obtained from DOEs of NCEM-enabled fill cells |
| US20170245361A1 (en) * | 2016-01-06 | 2017-08-24 | Nokomis, Inc. | Electronic device and methods to customize electronic device electromagnetic emissions |
| US10139358B2 (en) | 2016-01-11 | 2018-11-27 | International Business Machines Corporation | Method for characterization of a layered structure |
| US9627370B1 (en) | 2016-04-04 | 2017-04-18 | Pdf Solutions, Inc. | Integrated circuit containing standard logic cells and library-compatible, NCEM-enabled fill cells, including at least via-open-configured, GATE-short-configured, GATECNT-short-configured, and TS-short-configured, NCEM-enabled fill cells |
| US9929063B1 (en) | 2016-04-04 | 2018-03-27 | Pdf Solutions, Inc. | Process for making an integrated circuit that includes NCEM-Enabled, tip-to-side gap-configured fill cells, with NCEM pads formed from at least three conductive stripes positioned between adjacent gates |
| US9905553B1 (en) | 2016-04-04 | 2018-02-27 | Pdf Solutions, Inc. | Integrated circuit containing standard logic cells and library-compatible, NCEM-enabled fill cells, including at least via-open-configured, AACNT-short-configured, GATECNT-short-configured, and metal-short-configured, NCEM-enabled fill cells |
| SG10201702885PA (en) * | 2016-04-20 | 2017-11-29 | Lam Res Corp | Apparatus for measuring condition of electroplating cell components and associated methods |
| US10521897B2 (en) | 2016-07-22 | 2019-12-31 | International Business Machines Corporation | Using photonic emission to develop electromagnetic emission models |
| US10429438B1 (en) * | 2016-07-28 | 2019-10-01 | National Technology & Engineering Solutions Of Sandia, Llc | Integrated circuit authentication from a die material measurement |
| JP6727651B2 (en) * | 2016-09-30 | 2020-07-22 | 株式会社ヒューモラボラトリー | Continuous inspection method for electrical characteristics of chip electronic components |
| CN108267682B (en) * | 2016-12-30 | 2020-07-28 | 杭州广立微电子有限公司 | High-density test chip, test system and test method thereof |
| US9767889B1 (en) * | 2017-02-15 | 2017-09-19 | Qualcomm Incorporated | Programmable pad capacitance for supporting bidirectional signaling from unterminated endpoints |
| US10448864B1 (en) | 2017-02-24 | 2019-10-22 | Nokomis, Inc. | Apparatus and method to identify and measure gas concentrations |
| US9748153B1 (en) | 2017-03-29 | 2017-08-29 | Pdf Solutions, Inc. | Process for making and using a semiconductor wafer containing first and second does of standard cell compatible, NCEM-enabled fill cells, with the first DOE including side-to-side short configured fill cells, and the second DOE including tip-to-side short configure |
| US10649026B2 (en) * | 2017-03-30 | 2020-05-12 | Globalfoundries Inc. | Apparatus for and method of net trace prior level subtraction |
| US9773774B1 (en) | 2017-03-30 | 2017-09-26 | Pdf Solutions, Inc. | Process for making and using a semiconductor wafer containing first and second DOEs of standard cell compatible, NCEM-enabled fill cells, with the first DOE including chamfer short configured fill cells, and the second DOE including corner short configured fill cells |
| US9768083B1 (en) | 2017-06-27 | 2017-09-19 | Pdf Solutions, Inc. | Process for making and using a semiconductor wafer containing first and second DOEs of standard cell compatible, NCEM-enabled fill cells, with the first DOE including merged-via open configured fill cells, and the second DOE including snake open configured fill cells |
| US9786649B1 (en) | 2017-06-27 | 2017-10-10 | Pdf Solutions, Inc. | Process for making and using a semiconductor wafer containing first and second DOEs of standard cell compatible, NCEM-enabled fill cells, with the first DOE including via open configured fill cells, and the second DOE including stitch open configured fill cells |
| US10096530B1 (en) | 2017-06-28 | 2018-10-09 | Pdf Solutions, Inc. | Process for making and using a semiconductor wafer containing first and second DOEs of standard cell compatible, NCEM-enabled fill cells, with the first DOE including merged-via open configured fill cells, and the second DOE including stitch open configured fill cells |
| US9865583B1 (en) | 2017-06-28 | 2018-01-09 | Pdf Solutions, Inc. | Process for making and using a semiconductor wafer containing first and second DOEs of standard cell compatible, NCEM-enabled fill cells, with the first DOE including snake open configured fill cells, and the second DOE including stitch open configured fill cells |
| US11181829B2 (en) * | 2017-09-06 | 2021-11-23 | Asml Netherlands B.V. | Method for determining a control parameter for an apparatus utilized in a semiconductor manufacturing process |
| US10262950B1 (en) | 2017-10-17 | 2019-04-16 | Qualcomm Incorporated | Visible alignment markers/landmarks for CAD-to-silicon backside image alignment |
| US11489847B1 (en) | 2018-02-14 | 2022-11-01 | Nokomis, Inc. | System and method for physically detecting, identifying, and diagnosing medical electronic devices connectable to a network |
| DE102018124044B3 (en) | 2018-09-28 | 2020-02-06 | Carl Zeiss Microscopy Gmbh | Method for operating a multi-beam particle beam microscope and multi-beam particle beam system |
| JP7181753B2 (en) * | 2018-10-12 | 2022-12-01 | 株式会社アドバンテスト | Analysis device, analysis method and analysis program |
| JP7219046B2 (en) * | 2018-10-12 | 2023-02-07 | 株式会社アドバンテスト | Analysis device, analysis method and analysis program |
| US10825796B2 (en) | 2018-10-22 | 2020-11-03 | Nanya Technology Corporation | Semiconductor package and method for manufacturing the same |
| US11079432B2 (en) | 2019-02-19 | 2021-08-03 | Nxp B.V. | Integrated laser voltage probe pad for measuring DC or low frequency AC electrical parameters with laser based optical probing techniques |
| US11182532B2 (en) | 2019-07-15 | 2021-11-23 | Taiwan Semiconductor Manufacturing Co., Ltd. | Hierarchical density uniformization for semiconductor feature surface planarization |
| US20220293477A1 (en) * | 2021-03-11 | 2022-09-15 | Taiwan Semiconductor Manufacturing Company Ltd. | Test structure and testing method thereof |
| US11824133B2 (en) * | 2021-07-22 | 2023-11-21 | Taiwan Semiconductor Manufacturing Company, Ltd. | Detection using semiconductor detector |
| TW202316120A (en) * | 2021-10-01 | 2023-04-16 | 致茂電子股份有限公司 | Wafer inspection method and inspection equipment |
| KR102585790B1 (en) * | 2021-10-13 | 2023-10-06 | 테크위드유 주식회사 | Test method and switch ic using logical identification |
| US20230160960A1 (en) * | 2021-11-22 | 2023-05-25 | Onto Innovation | Semiconductor substrate yield prediction based on spectra data from multiple substrate dies |
| US11892821B2 (en) * | 2022-03-15 | 2024-02-06 | Applied Materials, Inc. | Communication node to interface between evaluation systems and a manufacturing system |
Citations (95)
| Publication number | Priority date | Publication date | Assignee | Title |
|---|---|---|---|---|
| US1342885A (en) | 1919-02-08 | 1920-06-08 | Edwin H Armstrong | Method of receiving high-frequency oscillations |
| US3970875A (en) | 1974-11-21 | 1976-07-20 | International Business Machines Corporation | LSI chip compensator for process parameter variations |
| US4122396A (en) | 1974-08-01 | 1978-10-24 | Grazier James A | Stable solar power source for portable electrical devices |
| US4184894A (en) | 1978-05-19 | 1980-01-22 | Solarex Corporation | Integrated photovoltaic generator |
| US4342879A (en) | 1980-10-24 | 1982-08-03 | The University Of Delaware | Thin film photovoltaic device |
| US4443653A (en) | 1980-10-24 | 1984-04-17 | The University Of Delaware | Thin film photovoltaic device with multilayer substrate |
| US4680635A (en) | 1986-04-01 | 1987-07-14 | Intel Corporation | Emission microscope |
| US4681449A (en) | 1984-09-07 | 1987-07-21 | Stanford University | High speed testing of electronic circuits by electro-optic sampling |
| US4755874A (en) | 1987-08-31 | 1988-07-05 | Kla Instruments Corporation | Emission microscopy system |
| US4758092A (en) | 1986-03-04 | 1988-07-19 | Stanford University | Method and means for optical detection of charge density modulation in a semiconductor |
| US4820916A (en) | 1987-05-05 | 1989-04-11 | Simmonds Precision Products | Optically powered sensor system |
| US4829238A (en) | 1986-03-27 | 1989-05-09 | Goulette Richard R | Method and apparatus for monitoring electromagnetic emission levels |
| US4959603A (en) | 1987-10-27 | 1990-09-25 | Osaka Titanium Co., Ltd. | Solar battery equipment |
| US4963729A (en) | 1989-03-03 | 1990-10-16 | Simmonds Precision Products, Inc. | Optically powered sensor system with improved signal conditioning |
| USD315561S (en) | 1988-10-06 | 1991-03-19 | Moses Miller | Solar powered radio |
| US5028866A (en) | 1990-05-30 | 1991-07-02 | General Motors Corporation | Method and apparatus for mapping printed circuit fields |
| US5030908A (en) * | 1987-09-26 | 1991-07-09 | Kabushiki Kaisha Toshiba | Method of testing semiconductor elements and apparatus for testing the same |
| US5068547A (en) | 1990-09-05 | 1991-11-26 | Lsi Logic Corporation | Process monitor circuit |
| US5095267A (en) | 1990-03-19 | 1992-03-10 | National Semiconductor Corporation | Method of screening A.C. performance characteristics during D.C. parametric test operation |
| US5218294A (en) | 1991-01-22 | 1993-06-08 | Advanced Test Technologies Inc. | Contactless test method for testing printed circuit boards |
| US5270655A (en) | 1989-12-22 | 1993-12-14 | Matsushita Electric Industrial Co., Ltd. | Semiconductor integrated circuit having light emitting devices |
| US5286656A (en) | 1992-11-02 | 1994-02-15 | National Semiconductor Corporation | Individualized prepackage AC performance testing of IC dies on a wafer using DC parametric test patterns |
| EP0652444A1 (en) | 1993-11-08 | 1995-05-10 | Advantest Corporation | Method and apparatus for forming a potential distribution image of a semiconductor integrated circuit |
| US5459402A (en) | 1992-10-02 | 1995-10-17 | Kabushiki Kaisha Toshiba | Delay time measuring circuit |
| US5486786A (en) | 1994-08-09 | 1996-01-23 | Lsi Logic Corporation | Process monitor for CMOS integrated circuits |
| US5508610A (en) | 1992-12-03 | 1996-04-16 | Georgia Tech Research Corporation | Electrical conductivity tester and methods thereof for accurately measuring time-varying and steady state conductivity using phase shift detection |
| US5520968A (en) | 1995-05-05 | 1996-05-28 | The United States Of America As Represented By The Secretary Of The Navy | Multilayer second-order nonlinear optical films of head-to-head, mainchain chromophoric polymers |
| US5551065A (en) | 1994-12-19 | 1996-08-27 | Honore; David | Wireless solar entertainment system |
| US5570035A (en) | 1995-01-31 | 1996-10-29 | The United States Of America As Represented By The Secretary Of The Army | Built-in self test indicator for an integrated circuit package |
| US5581094A (en) | 1993-11-18 | 1996-12-03 | Mitsubishi Denki Kabushiki Kaisha | Photodetector, a photodector array comprising photodetectors, an object detector comprising the photodetecter array and an object detecting procedure |
| US5631571A (en) | 1996-04-03 | 1997-05-20 | The United States Of America As Represented By The Secretary Of The Air Force | Infrared receiver wafer level probe testing |
| US5631572A (en) | 1993-09-17 | 1997-05-20 | Teradyne, Inc. | Printed circuit board tester using magnetic induction |
| US5640539A (en) | 1993-09-21 | 1997-06-17 | Advantest Corporation | IC analysis system having charged particle beam apparatus for improved contrast image |
| US5663967A (en) | 1995-10-19 | 1997-09-02 | Lsi Logic Corporation | Defect isolation using scan-path testing and electron beam probing in multi-level high density asics |
| US5721688A (en) | 1996-09-06 | 1998-02-24 | Madill Technologies, Inc. | Apparatus and method for electrical system measurements including battery condition, resistance of wires and connections, total electrical system quality and current flow |
| US5764655A (en) | 1997-07-02 | 1998-06-09 | International Business Machines Corporation | Built in self test with memory |
| EP0892275A2 (en) | 1997-07-15 | 1999-01-20 | Schlumberger Technologies, Inc. | Method and apparatus for testing semiconductor and integrated circuit structures |
| US5872360A (en) | 1996-12-12 | 1999-02-16 | Intel Corporation | Method and apparatus using an infrared laser based optical probe for measuring electric fields directly from active regions in an integrated circuit |
| US5898186A (en) | 1996-09-13 | 1999-04-27 | Micron Technology, Inc. | Reduced terminal testing system |
| US5903012A (en) | 1997-07-28 | 1999-05-11 | International Business Machines Corporation | Process variation monitor for integrated circuits |
| US5905577A (en) | 1997-03-15 | 1999-05-18 | Schlumberger Technologies, Inc. | Dual-laser voltage probing of IC's |
| US5940545A (en) | 1996-07-18 | 1999-08-17 | International Business Machines Corporation | Noninvasive optical method for measuring internal switching and other dynamic parameters of CMOS circuits |
| US5949900A (en) | 1996-03-11 | 1999-09-07 | Nec Corporation | Fine pattern inspection device capable of carrying out inspection without pattern recognition |
| US6028435A (en) | 1996-03-22 | 2000-02-22 | Nec Corporation | Semiconductor device evaluation system using optical fiber |
| US6040592A (en) | 1997-06-12 | 2000-03-21 | Intel Corporation | Well to substrate photodiode for use in a CMOS sensor on a salicide process |
| US6058497A (en) | 1992-11-20 | 2000-05-02 | Micron Technology, Inc. | Testing and burn-in of IC chips using radio frequency transmission |
| US6066956A (en) | 1995-11-21 | 2000-05-23 | Nec Corporation | Inspection method and wiring current observation method for semiconductor device |
| US6107107A (en) | 1998-03-31 | 2000-08-22 | Advanced Micro Devices, Inc. | Analyzing an electronic circuit formed upon a frontside surface of a semiconductor substrate by detecting radiation exiting a backside surface coated with an antireflective material |
| US6119255A (en) | 1998-01-21 | 2000-09-12 | Micron Technology, Inc. | Testing system for evaluating integrated circuits, a burn-in testing system, and a method for testing an integrated circuit |
| US6124143A (en) | 1998-01-26 | 2000-09-26 | Lsi Logic Corporation | Process monitor circuitry for integrated circuits |
| US6184696B1 (en) | 1998-03-23 | 2001-02-06 | Conexant Systems, Inc. | Use of converging beams for transmitting electromagnetic energy to power devices for die testing |
| US20010001391A1 (en) * | 1998-01-07 | 2001-05-24 | Emil Kamieniecki | Apparatus and method for rapid photo-thermal surface treatment |
| US6239603B1 (en) | 1998-06-24 | 2001-05-29 | Kabushiki Kaisha Toshiba | Monitor TEG test circuit |
| US20010005145A1 (en) | 1998-03-23 | 2001-06-28 | White Stanley A. | Methods for wireless testing of integrated circuits |
| US6281696B1 (en) | 1998-08-24 | 2001-08-28 | Xilinx, Inc. | Method and test circuit for developing integrated circuit fabrication processes |
| US6300785B1 (en) | 1998-10-20 | 2001-10-09 | International Business Machines Corporation | Contact-less probe of semiconductor wafers |
| US6368884B1 (en) | 2000-04-13 | 2002-04-09 | Advanced Micro Devices, Inc. | Die-based in-fab process monitoring and analysis system for semiconductor processing |
| US6385361B1 (en) | 1998-08-26 | 2002-05-07 | Lsi Logic Corporation | Optical/electrical inputs for an integrated circuit |
| US6448802B1 (en) | 1998-12-21 | 2002-09-10 | Intel Corporation | Photosensors for testing an integrated circuit |
| US6449749B1 (en) | 1999-11-18 | 2002-09-10 | Pdf Solutions, Inc. | System and method for product yield prediction |
| US6463570B1 (en) | 2000-07-26 | 2002-10-08 | Advanced Micro Devices | Apparatus and method for verifying process integrity |
| US6475871B1 (en) | 1999-11-18 | 2002-11-05 | Pdf Solutions, Inc. | Passive multiplexor test structure for integrated circuit manufacturing |
| US20020171468A1 (en) | 2001-04-26 | 2002-11-21 | International Business Machines Corporation | Apparatus for biasing ultra-low voltage logic circuits |
| US6507942B1 (en) | 2000-07-11 | 2003-01-14 | Xilinx , Inc. | Methods and circuits for testing a circuit fabrication process for device uniformity |
| US6509197B1 (en) | 1999-12-14 | 2003-01-21 | Kla-Tencor Corporation | Inspectable buried test structures and methods for inspecting the same |
| US6545333B1 (en) | 2001-04-25 | 2003-04-08 | International Business Machines Corporation | Light controlled silicon on insulator device |
| US6549022B1 (en) | 2000-06-02 | 2003-04-15 | Sandia Corporation | Apparatus and method for analyzing functional failures in integrated circuits |
| US6553545B1 (en) | 2000-06-29 | 2003-04-22 | Intel Corporation | Process parameter extraction |
| US6562639B1 (en) * | 2000-11-06 | 2003-05-13 | Advanced Micro Devices, Inc. | Utilizing electrical performance data to predict CD variations across stepper field |
| US20030146771A1 (en) | 2000-05-15 | 2003-08-07 | Brian Moore | Wireless radio frequency technique design and method for testing of integrated circuits and wafers |
| US6621275B2 (en) | 2001-11-28 | 2003-09-16 | Optonics Inc. | Time resolved non-invasive diagnostics system |
| US6657446B1 (en) | 1999-09-30 | 2003-12-02 | Advanced Micro Devices, Inc. | Picosecond imaging circuit analysis probe and system |
| US20030237029A1 (en) | 2002-06-24 | 2003-12-25 | International Business | Method and apparatus for characterizing a circuit with multiple inputs |
| US6711721B2 (en) | 2001-09-17 | 2004-03-23 | International Business Machines Corporation | Method for adding redundant vias on VLSI chips |
| US6731122B2 (en) | 2001-08-14 | 2004-05-04 | International Business Machines Corporation | Wafer test apparatus including optical elements and method of using the test apparatus |
| US6798261B1 (en) | 2003-05-22 | 2004-09-28 | International Business Machines Corporation | Method and apparatus for characterizing switching history impact |
| US6825682B2 (en) | 2000-04-05 | 2004-11-30 | Infineon Technologies Ag | Test configuration for the functional testing of a semiconductor chip |
| US20050012556A1 (en) | 2003-07-18 | 2005-01-20 | International Business Machines Corporation | Method and apparatus for determining characteristics of MOS devices |
| US6850081B1 (en) | 2001-07-26 | 2005-02-01 | Advanced Micro Devices, Inc. | Semiconductor die analysis via fiber optic communication |
| US6859031B2 (en) | 2002-02-01 | 2005-02-22 | Credence Systems Corporation | Apparatus and method for dynamic diagnostic testing of integrated circuits |
| US6859587B2 (en) | 2001-12-28 | 2005-02-22 | Intel Corporation | Method and apparatus for wafer level testing of integrated optical waveguide circuits |
| US6865503B2 (en) | 2002-12-24 | 2005-03-08 | Conexant Systems, Inc. | Method and apparatus for telemetered probing of integrated circuit operation |
| US20050085032A1 (en) | 2003-08-25 | 2005-04-21 | Majid Aghababazadeh | Technique for evaluating a fabrication of a die and wafer |
| US6893883B2 (en) | 2003-08-18 | 2005-05-17 | Agere Systems Inc. | Method and apparatus using an on-chip ring oscillator for chip identification |
| US6939727B1 (en) * | 2003-11-03 | 2005-09-06 | Lsi Logic Corporation | Method for performing statistical post processing in semiconductor manufacturing using ID cells |
| US6958659B2 (en) | 2002-08-29 | 2005-10-25 | Nec Electronics Corporation | Test method and apparatus for verifying fabrication of transistors in an integrated circuit |
| US6976234B2 (en) | 2003-01-13 | 2005-12-13 | Credence Systems Corporation | Apparatus and method for measuring characteristics of dynamic electrical signals in integrated circuits |
| US6985219B2 (en) | 2000-12-21 | 2006-01-10 | Credence Systems Corporation | Optical coupling for testing integrated circuits |
| US7005876B2 (en) | 2003-04-14 | 2006-02-28 | Magfusion, Inc. | Wafer-level tester with magnet to test latching micro-magnetic switches |
| US20060044004A1 (en) | 2004-08-31 | 2006-03-02 | Manjul Bhushan | Method and apparatus for measuring transfer characteristics of a semiconductor device |
| US7012537B2 (en) | 2004-02-10 | 2006-03-14 | Credence Systems Corporation | Apparatus and method for determining voltage using optical observation |
| US7020859B2 (en) * | 2003-06-02 | 2006-03-28 | Lsi Logic Corporation | Process skew results for integrated circuits |
| US7024066B1 (en) | 2003-04-07 | 2006-04-04 | Luxtera, Inc. | Littrow gratings as alignment structures for the wafer level testing of optical and optoelectronic chips |
| US20060100811A1 (en) | 2004-10-20 | 2006-05-11 | Manjul Bhushan | Method and apparatus for rapid inline measurement of parameter spreads and defects in integrated circuit chips |
| US7155360B2 (en) | 2004-07-27 | 2006-12-26 | Fujitsu Limited | Process variation detector and process variation detecting method |
Family Cites Families (29)
| Publication number | Priority date | Publication date | Assignee | Title |
|---|---|---|---|---|
| US469305A (en) * | 1892-02-23 | Lard-cooling tank | ||
| US763001A (en) * | 1902-10-25 | 1904-06-21 | Seward Heidelbach | Sewing-machine for felling. |
| US738219A (en) * | 1903-05-09 | 1903-09-08 | Joseph W Madison | Machine for capping bottles. |
| US762944A (en) * | 1904-01-22 | 1904-06-21 | Charles Dunbar | Rail-tie and fastener. |
| US927406A (en) * | 1906-07-26 | 1909-07-06 | Walter R Gwin | Multiple die-plate. |
| US927260A (en) * | 1907-02-04 | 1909-07-06 | Bethlehem Steel Corp | Training and firing mechanism for guns. |
| US927258A (en) * | 1909-03-22 | 1909-07-06 | William Mann | Calf-weaner. |
| GB8628339D0 (en) * | 1986-11-27 | 1986-12-31 | Bp Chemicals Additives | Chemical process |
| US5270222A (en) * | 1990-12-31 | 1993-12-14 | Texas Instruments Incorporated | Method and apparatus for semiconductor device fabrication diagnosis and prognosis |
| US5293216A (en) * | 1990-12-31 | 1994-03-08 | Texas Instruments Incorporated | Sensor for semiconductor device manufacturing process control |
| JPH08146095A (en) * | 1994-11-21 | 1996-06-07 | Hitachi Ltd | Semiconductor device |
| JP3315373B2 (en) * | 1997-10-08 | 2002-08-19 | 松下電器産業株式会社 | Production line management method |
| WO1999032893A1 (en) | 1997-12-22 | 1999-07-01 | Conexant Systems, Inc. | Wireless test apparatus for integrated circuit die |
| JP2000091178A (en) * | 1998-09-11 | 2000-03-31 | Sony Corp | Production control method |
| JP2000150606A (en) * | 1998-11-09 | 2000-05-30 | Mitsubishi Electric Corp | Plasma damage detecting device and plasma damage evaluating method |
| JP3228246B2 (en) * | 1998-11-17 | 2001-11-12 | 日本電気株式会社 | Method for manufacturing semiconductor device |
| ATE246363T1 (en) * | 1999-05-21 | 2003-08-15 | Conexant Systems Inc | SYSTEM FOR CONTACTLESS TESTING OF INTEGRATED CIRCUITS |
| US6871112B1 (en) | 2000-01-07 | 2005-03-22 | Advanced Micro Devices, Inc. | Method for requesting trace data reports from FDC semiconductor fabrication processes |
| US6622059B1 (en) | 2000-04-13 | 2003-09-16 | Advanced Micro Devices, Inc. | Automated process monitoring and analysis system for semiconductor processing |
| WO2002063675A1 (en) * | 2001-02-02 | 2002-08-15 | Hitachi, Ltd. | Integrated circuit, method of testing integrated circuit and method of manufacturing integrated circuit |
| JP2002261139A (en) * | 2001-03-01 | 2002-09-13 | Hitachi Ltd | Method for manufacturing semiconductor and its system |
| JP2002340989A (en) * | 2001-05-15 | 2002-11-27 | Semiconductor Energy Lab Co Ltd | Measuring method, inspection method and inspection apparatus |
| JP3726711B2 (en) * | 2001-05-31 | 2005-12-14 | セイコーエプソン株式会社 | Semiconductor device |
| JP3859480B2 (en) * | 2001-10-17 | 2006-12-20 | 株式会社ルネサステクノロジ | Inspection method |
| DE10154392A1 (en) * | 2001-11-06 | 2003-05-15 | Philips Corp Intellectual Pty | Charge detector semiconductor component, system comprising a charge detector semiconductor component and a reference semiconductor component, wafers, use of a wafer and method for the qualitative and quantitative measurement of a charge on a wafer |
| JP2003234288A (en) * | 2002-02-07 | 2003-08-22 | Sony Corp | Polycrystal semiconductor film and manufacturing method, and manufacturing device for semiconductor element |
| KR100490655B1 (en) * | 2002-10-30 | 2005-05-24 | 주식회사 하이닉스반도체 | Duty cycle correction circuit and delay locked loop having the same |
| US7239163B1 (en) * | 2004-06-23 | 2007-07-03 | Ridgetop Group, Inc. | Die-level process monitor and method |
| US7550986B2 (en) * | 2006-04-27 | 2009-06-23 | Infineon Technologies Ag | Semiconductor wafer having a dielectric reliability test structure, integrated circuit product and test method |
-
2004
- 2004-08-25 EP EP04786586A patent/EP1665362A2/en not_active Ceased
- 2004-08-25 US US10/927,260 patent/US7220990B2/en active Active
- 2004-08-25 US US10/927,275 patent/US7730434B2/en not_active Expired - Fee Related
- 2004-08-25 JP JP2006524855A patent/JP5340538B2/en not_active Expired - Fee Related
- 2004-08-25 WO PCT/US2004/027770 patent/WO2005020297A2/en active Search and Examination
- 2004-08-25 US US10/927,406 patent/US7339388B2/en active Active
- 2004-08-25 US US10/927,258 patent/US7256055B2/en active Active
- 2004-08-26 TW TW093125971A patent/TWI276147B/en not_active IP Right Cessation
-
2006
- 2006-08-31 US US11/469,305 patent/US8344745B2/en active Active
-
2007
- 2007-04-20 US US11/738,219 patent/US7423288B2/en active Active
- 2007-06-14 US US11/762,944 patent/US7736916B2/en not_active Expired - Fee Related
- 2007-06-14 US US11/763,001 patent/US20070236232A1/en not_active Abandoned
- 2007-11-05 US US11/935,297 patent/US7605597B2/en not_active Expired - Fee Related
-
2008
- 2008-08-21 US US12/196,032 patent/US7723724B2/en not_active Expired - Fee Related
-
2010
- 2010-06-01 US US12/791,665 patent/US8990759B2/en not_active Expired - Fee Related
-
2011
- 2011-01-20 JP JP2011009583A patent/JP2011097099A/en active Pending
- 2011-01-20 JP JP2011009582A patent/JP2011097098A/en active Pending
- 2011-12-02 JP JP2011264468A patent/JP5543953B2/en not_active Expired - Fee Related
Patent Citations (119)
| Publication number | Priority date | Publication date | Assignee | Title |
|---|---|---|---|---|
| US1342885A (en) | 1919-02-08 | 1920-06-08 | Edwin H Armstrong | Method of receiving high-frequency oscillations |
| US4122396A (en) | 1974-08-01 | 1978-10-24 | Grazier James A | Stable solar power source for portable electrical devices |
| US3970875A (en) | 1974-11-21 | 1976-07-20 | International Business Machines Corporation | LSI chip compensator for process parameter variations |
| US4184894A (en) | 1978-05-19 | 1980-01-22 | Solarex Corporation | Integrated photovoltaic generator |
| US4342879A (en) | 1980-10-24 | 1982-08-03 | The University Of Delaware | Thin film photovoltaic device |
| US4443653A (en) | 1980-10-24 | 1984-04-17 | The University Of Delaware | Thin film photovoltaic device with multilayer substrate |
| US4681449A (en) | 1984-09-07 | 1987-07-21 | Stanford University | High speed testing of electronic circuits by electro-optic sampling |
| US4758092A (en) | 1986-03-04 | 1988-07-19 | Stanford University | Method and means for optical detection of charge density modulation in a semiconductor |
| US5006788A (en) | 1986-03-27 | 1991-04-09 | Northern Telecom Limited | Method and apparatus for monitoring electromagnetic emission levels |
| US4829238A (en) | 1986-03-27 | 1989-05-09 | Goulette Richard R | Method and apparatus for monitoring electromagnetic emission levels |
| US4680635A (en) | 1986-04-01 | 1987-07-14 | Intel Corporation | Emission microscope |
| US4820916A (en) | 1987-05-05 | 1989-04-11 | Simmonds Precision Products | Optically powered sensor system |
| US4755874A (en) | 1987-08-31 | 1988-07-05 | Kla Instruments Corporation | Emission microscopy system |
| US5030908A (en) * | 1987-09-26 | 1991-07-09 | Kabushiki Kaisha Toshiba | Method of testing semiconductor elements and apparatus for testing the same |
| US4959603A (en) | 1987-10-27 | 1990-09-25 | Osaka Titanium Co., Ltd. | Solar battery equipment |
| USD315561S (en) | 1988-10-06 | 1991-03-19 | Moses Miller | Solar powered radio |
| US4963729A (en) | 1989-03-03 | 1990-10-16 | Simmonds Precision Products, Inc. | Optically powered sensor system with improved signal conditioning |
| US5270655A (en) | 1989-12-22 | 1993-12-14 | Matsushita Electric Industrial Co., Ltd. | Semiconductor integrated circuit having light emitting devices |
| US5095267A (en) | 1990-03-19 | 1992-03-10 | National Semiconductor Corporation | Method of screening A.C. performance characteristics during D.C. parametric test operation |
| US5028866A (en) | 1990-05-30 | 1991-07-02 | General Motors Corporation | Method and apparatus for mapping printed circuit fields |
| US5068547A (en) | 1990-09-05 | 1991-11-26 | Lsi Logic Corporation | Process monitor circuit |
| US5218294A (en) | 1991-01-22 | 1993-06-08 | Advanced Test Technologies Inc. | Contactless test method for testing printed circuit boards |
| US5459402A (en) | 1992-10-02 | 1995-10-17 | Kabushiki Kaisha Toshiba | Delay time measuring circuit |
| US5286656A (en) | 1992-11-02 | 1994-02-15 | National Semiconductor Corporation | Individualized prepackage AC performance testing of IC dies on a wafer using DC parametric test patterns |
| US6058497A (en) | 1992-11-20 | 2000-05-02 | Micron Technology, Inc. | Testing and burn-in of IC chips using radio frequency transmission |
| US6161205A (en) | 1992-11-20 | 2000-12-12 | Micron Technology, Inc. | Testing and burn-in of IC chips using radio frequency transmission |
| US5508610A (en) | 1992-12-03 | 1996-04-16 | Georgia Tech Research Corporation | Electrical conductivity tester and methods thereof for accurately measuring time-varying and steady state conductivity using phase shift detection |
| US5631572A (en) | 1993-09-17 | 1997-05-20 | Teradyne, Inc. | Printed circuit board tester using magnetic induction |
| US5640539A (en) | 1993-09-21 | 1997-06-17 | Advantest Corporation | IC analysis system having charged particle beam apparatus for improved contrast image |
| EP0652444A1 (en) | 1993-11-08 | 1995-05-10 | Advantest Corporation | Method and apparatus for forming a potential distribution image of a semiconductor integrated circuit |
| US5581094A (en) | 1993-11-18 | 1996-12-03 | Mitsubishi Denki Kabushiki Kaisha | Photodetector, a photodector array comprising photodetectors, an object detector comprising the photodetecter array and an object detecting procedure |
| US5486786A (en) | 1994-08-09 | 1996-01-23 | Lsi Logic Corporation | Process monitor for CMOS integrated circuits |
| US5551065A (en) | 1994-12-19 | 1996-08-27 | Honore; David | Wireless solar entertainment system |
| US5570035A (en) | 1995-01-31 | 1996-10-29 | The United States Of America As Represented By The Secretary Of The Army | Built-in self test indicator for an integrated circuit package |
| US5520968A (en) | 1995-05-05 | 1996-05-28 | The United States Of America As Represented By The Secretary Of The Navy | Multilayer second-order nonlinear optical films of head-to-head, mainchain chromophoric polymers |
| US5663967A (en) | 1995-10-19 | 1997-09-02 | Lsi Logic Corporation | Defect isolation using scan-path testing and electron beam probing in multi-level high density asics |
| US6066956A (en) | 1995-11-21 | 2000-05-23 | Nec Corporation | Inspection method and wiring current observation method for semiconductor device |
| US5949900A (en) | 1996-03-11 | 1999-09-07 | Nec Corporation | Fine pattern inspection device capable of carrying out inspection without pattern recognition |
| US6028435A (en) | 1996-03-22 | 2000-02-22 | Nec Corporation | Semiconductor device evaluation system using optical fiber |
| US5631571A (en) | 1996-04-03 | 1997-05-20 | The United States Of America As Represented By The Secretary Of The Air Force | Infrared receiver wafer level probe testing |
| US5940545A (en) | 1996-07-18 | 1999-08-17 | International Business Machines Corporation | Noninvasive optical method for measuring internal switching and other dynamic parameters of CMOS circuits |
| US5721688A (en) | 1996-09-06 | 1998-02-24 | Madill Technologies, Inc. | Apparatus and method for electrical system measurements including battery condition, resistance of wires and connections, total electrical system quality and current flow |
| US5898186A (en) | 1996-09-13 | 1999-04-27 | Micron Technology, Inc. | Reduced terminal testing system |
| US5872360A (en) | 1996-12-12 | 1999-02-16 | Intel Corporation | Method and apparatus using an infrared laser based optical probe for measuring electric fields directly from active regions in an integrated circuit |
| US5905577A (en) | 1997-03-15 | 1999-05-18 | Schlumberger Technologies, Inc. | Dual-laser voltage probing of IC's |
| US6040592A (en) | 1997-06-12 | 2000-03-21 | Intel Corporation | Well to substrate photodiode for use in a CMOS sensor on a salicide process |
| US5764655A (en) | 1997-07-02 | 1998-06-09 | International Business Machines Corporation | Built in self test with memory |
| EP0892275A2 (en) | 1997-07-15 | 1999-01-20 | Schlumberger Technologies, Inc. | Method and apparatus for testing semiconductor and integrated circuit structures |
| US6504393B1 (en) * | 1997-07-15 | 2003-01-07 | Applied Materials, Inc. | Methods and apparatus for testing semiconductor and integrated circuit structures |
| US5903012A (en) | 1997-07-28 | 1999-05-11 | International Business Machines Corporation | Process variation monitor for integrated circuits |
| US20010001391A1 (en) * | 1998-01-07 | 2001-05-24 | Emil Kamieniecki | Apparatus and method for rapid photo-thermal surface treatment |
| US6119255A (en) | 1998-01-21 | 2000-09-12 | Micron Technology, Inc. | Testing system for evaluating integrated circuits, a burn-in testing system, and a method for testing an integrated circuit |
| US6189120B1 (en) | 1998-01-21 | 2001-02-13 | Micron Technology, Inc. | Testing system for evaluating integrated circuits, a burn-in testing system, and a method for testing an integrated circuit |
| US6124143A (en) | 1998-01-26 | 2000-09-26 | Lsi Logic Corporation | Process monitor circuitry for integrated circuits |
| US6184696B1 (en) | 1998-03-23 | 2001-02-06 | Conexant Systems, Inc. | Use of converging beams for transmitting electromagnetic energy to power devices for die testing |
| US20010005145A1 (en) | 1998-03-23 | 2001-06-28 | White Stanley A. | Methods for wireless testing of integrated circuits |
| US6686755B2 (en) | 1998-03-23 | 2004-02-03 | Skyworks Solutions, Inc. | Methods for wireless testing of integrated circuits |
| US6331782B1 (en) | 1998-03-23 | 2001-12-18 | Conexant Systems, Inc. | Method and apparatus for wireless testing of integrated circuits |
| US6107107A (en) | 1998-03-31 | 2000-08-22 | Advanced Micro Devices, Inc. | Analyzing an electronic circuit formed upon a frontside surface of a semiconductor substrate by detecting radiation exiting a backside surface coated with an antireflective material |
| US6239603B1 (en) | 1998-06-24 | 2001-05-29 | Kabushiki Kaisha Toshiba | Monitor TEG test circuit |
| US6281696B1 (en) | 1998-08-24 | 2001-08-28 | Xilinx, Inc. | Method and test circuit for developing integrated circuit fabrication processes |
| US6385361B1 (en) | 1998-08-26 | 2002-05-07 | Lsi Logic Corporation | Optical/electrical inputs for an integrated circuit |
| US6455766B1 (en) | 1998-10-20 | 2002-09-24 | International Business Machines Corporation | Contact-less probe of semiconductor wafers |
| US6300785B1 (en) | 1998-10-20 | 2001-10-09 | International Business Machines Corporation | Contact-less probe of semiconductor wafers |
| US6448802B1 (en) | 1998-12-21 | 2002-09-10 | Intel Corporation | Photosensors for testing an integrated circuit |
| US6657446B1 (en) | 1999-09-30 | 2003-12-02 | Advanced Micro Devices, Inc. | Picosecond imaging circuit analysis probe and system |
| US6449749B1 (en) | 1999-11-18 | 2002-09-10 | Pdf Solutions, Inc. | System and method for product yield prediction |
| US6475871B1 (en) | 1999-11-18 | 2002-11-05 | Pdf Solutions, Inc. | Passive multiplexor test structure for integrated circuit manufacturing |
| US6509197B1 (en) | 1999-12-14 | 2003-01-21 | Kla-Tencor Corporation | Inspectable buried test structures and methods for inspecting the same |
| US6825682B2 (en) | 2000-04-05 | 2004-11-30 | Infineon Technologies Ag | Test configuration for the functional testing of a semiconductor chip |
| US6368884B1 (en) | 2000-04-13 | 2002-04-09 | Advanced Micro Devices, Inc. | Die-based in-fab process monitoring and analysis system for semiconductor processing |
| US20030146771A1 (en) | 2000-05-15 | 2003-08-07 | Brian Moore | Wireless radio frequency technique design and method for testing of integrated circuits and wafers |
| US6759863B2 (en) * | 2000-05-15 | 2004-07-06 | The Governors Of The University Of Alberta | Wireless radio frequency technique design and method for testing of integrated circuits and wafers |
| US6549022B1 (en) | 2000-06-02 | 2003-04-15 | Sandia Corporation | Apparatus and method for analyzing functional failures in integrated circuits |
| US6553545B1 (en) | 2000-06-29 | 2003-04-22 | Intel Corporation | Process parameter extraction |
| US6507942B1 (en) | 2000-07-11 | 2003-01-14 | Xilinx , Inc. | Methods and circuits for testing a circuit fabrication process for device uniformity |
| US6463570B1 (en) | 2000-07-26 | 2002-10-08 | Advanced Micro Devices | Apparatus and method for verifying process integrity |
| US6562639B1 (en) * | 2000-11-06 | 2003-05-13 | Advanced Micro Devices, Inc. | Utilizing electrical performance data to predict CD variations across stepper field |
| US6985219B2 (en) | 2000-12-21 | 2006-01-10 | Credence Systems Corporation | Optical coupling for testing integrated circuits |
| US7042563B2 (en) | 2000-12-21 | 2006-05-09 | Credence Systems Corporation | Optical coupling for testing integrated circuits |
| US6545333B1 (en) | 2001-04-25 | 2003-04-08 | International Business Machines Corporation | Light controlled silicon on insulator device |
| US6605981B2 (en) | 2001-04-26 | 2003-08-12 | International Business Machines Corporation | Apparatus for biasing ultra-low voltage logic circuits |
| US20020171468A1 (en) | 2001-04-26 | 2002-11-21 | International Business Machines Corporation | Apparatus for biasing ultra-low voltage logic circuits |
| US6850081B1 (en) | 2001-07-26 | 2005-02-01 | Advanced Micro Devices, Inc. | Semiconductor die analysis via fiber optic communication |
| US6731122B2 (en) | 2001-08-14 | 2004-05-04 | International Business Machines Corporation | Wafer test apparatus including optical elements and method of using the test apparatus |
| US7012440B2 (en) | 2001-08-14 | 2006-03-14 | International Business Machines Corporation | Wafer test apparatus including optical elements and method of using the test apparatus |
| US6711721B2 (en) | 2001-09-17 | 2004-03-23 | International Business Machines Corporation | Method for adding redundant vias on VLSI chips |
| US6621275B2 (en) | 2001-11-28 | 2003-09-16 | Optonics Inc. | Time resolved non-invasive diagnostics system |
| US6859587B2 (en) | 2001-12-28 | 2005-02-22 | Intel Corporation | Method and apparatus for wafer level testing of integrated optical waveguide circuits |
| US6859031B2 (en) | 2002-02-01 | 2005-02-22 | Credence Systems Corporation | Apparatus and method for dynamic diagnostic testing of integrated circuits |
| US20030237029A1 (en) | 2002-06-24 | 2003-12-25 | International Business | Method and apparatus for characterizing a circuit with multiple inputs |
| US6960926B2 (en) | 2002-06-24 | 2005-11-01 | International Business Machines Corporation | Method and apparatus for characterizing a circuit with multiple inputs |
| US6958659B2 (en) | 2002-08-29 | 2005-10-25 | Nec Electronics Corporation | Test method and apparatus for verifying fabrication of transistors in an integrated circuit |
| US6865503B2 (en) | 2002-12-24 | 2005-03-08 | Conexant Systems, Inc. | Method and apparatus for telemetered probing of integrated circuit operation |
| US6976234B2 (en) | 2003-01-13 | 2005-12-13 | Credence Systems Corporation | Apparatus and method for measuring characteristics of dynamic electrical signals in integrated circuits |
| US7024066B1 (en) | 2003-04-07 | 2006-04-04 | Luxtera, Inc. | Littrow gratings as alignment structures for the wafer level testing of optical and optoelectronic chips |
| US7005876B2 (en) | 2003-04-14 | 2006-02-28 | Magfusion, Inc. | Wafer-level tester with magnet to test latching micro-magnetic switches |
| US6798261B1 (en) | 2003-05-22 | 2004-09-28 | International Business Machines Corporation | Method and apparatus for characterizing switching history impact |
| US7020859B2 (en) * | 2003-06-02 | 2006-03-28 | Lsi Logic Corporation | Process skew results for integrated circuits |
| US20050012556A1 (en) | 2003-07-18 | 2005-01-20 | International Business Machines Corporation | Method and apparatus for determining characteristics of MOS devices |
| US6893883B2 (en) | 2003-08-18 | 2005-05-17 | Agere Systems Inc. | Method and apparatus using an on-chip ring oscillator for chip identification |
| US20070004063A1 (en) | 2003-08-25 | 2007-01-04 | Majid Aghababazadeh | Technique for evaluating a fabrication of a die and wafer |
| US7220990B2 (en) | 2003-08-25 | 2007-05-22 | Tau-Metrix, Inc. | Technique for evaluating a fabrication of a die and wafer |
| US20080315196A1 (en) | 2003-08-25 | 2008-12-25 | Majid Aghababazadeh | Technique for evaluating a fabrication of a die and wafer |
| US20050090916A1 (en) | 2003-08-25 | 2005-04-28 | Majid Aghababazadeh | Intra-chip power and test signal generation for use with test structures on wafers |
| US20050090027A1 (en) | 2003-08-25 | 2005-04-28 | Majid Aghababazadeh | System and apparatus for using test structures inside of a chip during the fabrication of the chip |
| US20050085032A1 (en) | 2003-08-25 | 2005-04-21 | Majid Aghababazadeh | Technique for evaluating a fabrication of a die and wafer |
| US7423288B2 (en) | 2003-08-25 | 2008-09-09 | Tau-Metrix, Inc. | Technique for evaluating a fabrication of a die and wafer |
| US20080100319A1 (en) | 2003-08-25 | 2008-05-01 | Majid Aghababazadeh | Intra-chip power and test signal generation for use with test structures on wafers |
| US7339388B2 (en) | 2003-08-25 | 2008-03-04 | Tau-Metrix, Inc. | Intra-clip power and test signal generation for use with test structures on wafers |
| US20070238206A1 (en) | 2003-08-25 | 2007-10-11 | Majid Aghababazadeh | System and apparatus for using test structures inside of a chip during the fabrication of the chip |
| US7256055B2 (en) | 2003-08-25 | 2007-08-14 | Tau-Metrix, Inc. | System and apparatus for using test structures inside of a chip during the fabrication of the chip |
| US20070187679A1 (en) | 2003-08-25 | 2007-08-16 | Majid Aghababazadeh | Technique for evaluating a fabrication of a die and wafer |
| US20070236232A1 (en) | 2003-08-25 | 2007-10-11 | Majid Aghababazadeh | System and apparatus for using test structures inside of a chip during the fabrication of the chip |
| US6939727B1 (en) * | 2003-11-03 | 2005-09-06 | Lsi Logic Corporation | Method for performing statistical post processing in semiconductor manufacturing using ID cells |
| US7012537B2 (en) | 2004-02-10 | 2006-03-14 | Credence Systems Corporation | Apparatus and method for determining voltage using optical observation |
| US7155360B2 (en) | 2004-07-27 | 2006-12-26 | Fujitsu Limited | Process variation detector and process variation detecting method |
| US20060044004A1 (en) | 2004-08-31 | 2006-03-02 | Manjul Bhushan | Method and apparatus for measuring transfer characteristics of a semiconductor device |
| US20060100811A1 (en) | 2004-10-20 | 2006-05-11 | Manjul Bhushan | Method and apparatus for rapid inline measurement of parameter spreads and defects in integrated circuit chips |
Non-Patent Citations (49)
| Title |
|---|
| Baliga, J., "Advanced Process Control Soon To Be a Must," Semiconductor International, Cahners Pub., Newton, Mas, IL, US, Jul. 1999, pp. 76-78, 80, 82, 8, XP009015968, ISSN: 0163-3767, the whole document. |
| Bowman, Keith A. et al, "Impact of extrinsic and intrinsic parameter variations on CMOS system on a chip performance," 0-7803-5632-2/99 IEEE 1999. |
| De Almeida, M. et al., "A statistical method for the analysis of CMOS process fluctuations on dynamic performance," 0-7803-3243-1, Proceedings of the IEEE 1997 Int. Conference on Microelectronic Test Structures, vol. 10, Mar. 1997. |
| Hannaman, D. J. et al., "The inverter matrix -a vehicle for assessing process quality through inverter parameter analysis of variance"CH2907-4/91/0000-0107 IEEE 1991. |
| International Preliminary Report on Patentability of Jun. 16, 2006 in International Application No. PCT/US04/027770. |
| International Search Report and Written Opinion of the International Searching Authority in International Application PCT/US2004/02770, World Intellectual Property Organization, Feb. 23, 2005, 22 pgs. |
| K Soumyanath et al., "Accurate On-Chip Interconnect Evaluation: A Time-Domain Technique", IEEE Journal of Solid-State Circuits, vol. 34, No. 5, pp. 623-631, May 1999. |
| Lei, Junzhao et al., "Predicting system performance variances using enhanced propagation of variance," 0-7803-4756-0/98 IEEE, 1998. |
| Lei, Junzhao et al.,"Propagation of variance using a new approximation in system design of integrated circuits," 0-7803-4449-9/98 IEEE 1998. |
| Matsumoto, S. et al., "Test-circuit-based extraction of inter-and intra-chip MOSFET-performance variations for analog-design reliability," 0-70803-6591-7/01 IEEE 2001. |
| Non-Final Office Action mailed Apr. 6, 2009 in U.S. Appl. No. 11/763,001 11 pgs. |
| Non-Final Office Action mailed Aug. 8, 2007 in U.S. Appl. No. 11/738,219 6 pgs. |
| Non-Final Office Action mailed Jul. 9, 2008 in U.S. Appl. No. 11/469,305 7 pgs. |
| Non-Final Office Action mailed Jun. 10, 2009 in U.S. Appl. No. 12/196,032 7 pgs. |
| Non-Final Office Action mailed May 13, 2009 in U.S. Appl. No. 11/762,944 7 pgs. |
| Non-Final Office Action mailed May 6, 2009 in U.S. Appl. No. 11/469,305 7 pgs. |
| Notice of Allowance mailed Dec. 30, 2008 in U.S. Appl. No. 11/935,297 7 pgs. |
| Notice of Allowance mailed Jun. 11, 2008 in U.S. Appl. No. 11/738,219 6 pgs. |
| Notice of Allowance mailed May 1, 20/08 in U.S. Appl. No. 11/738,219 7 pgs. |
| Notice of Allowance mailed May 29, 2009 in U.S. Appl. No. 11/935,297 5 pgs. |
| Notice of Allowance mailed Sep. 25, 2007 in U.S. Appl. No. 10/927,406 6 pgs. |
| Nurani, Rama K. et al., "The impact of lot-to-lot and wafer-to-wafer variations on SPC" 0-7803-3737-9/97 IEEE 1997. |
| Okada, Kenichi et al. "A statistical gate delay model for intra-chip and inter-chip variabilities," 07803-7659-5/03/ IEEE 2003. |
| Orshansky, Michael eet al., "Intra-field gate CD variability and its Impact on circuit performance," 0-7803-5410-9/99 IEEE 1999. |
| Orshansky, Michael et al, "Characterization of Spatial Intrafield Gate CD Variability, Its Impact on Circuit Performance, and Spatial Mask-Level Correction," IEEE Transactions on Semiconductor Manufacturing, vol. 17, No. 1, Feb. 2004. |
| Orshansky, Michael et al., "Circuit performance variability decomposition," Department of EECS, University of California at Berkeley, omisha@eecs.berkeley.edu. |
| Orshansky, Michael, et al. "Impact of spatial intrachip gate length variability on the performance of high-screen digital circuits," IEEE Transactions on Computer Aided Design of Integrated Circuits, vol. 21, No. 5, May 2002. |
| Orshansky, Michael, et al. "Impact of systematic spatial intra-chip gate length variability on performance of high-speed digital circuits," iccad, p. 62, 2000 International Conference on Computer-Aided Design (ICCAD '00), 2000. |
| Ouyang, X et al., "High-spatial-frequency MOS transistor gate length variations in SRAM circuits," 0-7803-6275-6-3/00 IEEE 2000. |
| Rowlands, David et al., "Derivation of a nonlinear variance equation and its application to SOI Technology," IEEE Transactions on Semiconductor Manufacturing, vol. 13, No. 4, Nov. 2000. |
| Santiesteban, Ramon S. et al., "Effect of tilt angle variations in a halo implant on Vth values for 0.14-um CMOS devices,", IEEE Transactions on Semiconductor Manufacturing, vol. 16, No. 4, Nov. 2003. |
| U.S. Appl. No. 10/927,258, Aghababazadeh et al. |
| U.S. Appl. No. 10/927,260, Aghababazadeh et al. |
| U.S. Appl. No. 10/927,406, Aghababazadeh et al. |
| U.S. Appl. No. 11/469,305, Aghababazadeh et al. |
| U.S. Appl. No. 11/738,219, Aghababazadeh et al. |
| U.S. Appl. No. 11/762,944, Aghababazadeh et al. |
| U.S. Appl. No. 11/763,001, Aghababazadeh et al. |
| U.S. Appl. No. 11/935,297, filed Nov. 5, 2007, Aghababazadeh et al. |
| U.S. Appl. No. 12/196,032, filed Aug. 21, 2008, Aghababazadeh et al. |
| USPTO Notice of Allowance dated Jan. 25, 2007 in U.S. Appl. No. 10/927,260, issued as patent No. 7,220,990 B2, 12 pages. |
| USPTO Notice of Allowance dated Mar. 17, 2006 in U.S. Appl. No. 10/927,260, issued as patent No. 7,220,990 B2, 8 pages. |
| USPTO Notice of Allowance dated Mar. 21, 2007 in U.S. Appl. No. 10/927,258, published as US 2005-0090027 A1, 14 pages. |
| USPTO Office Action dated Jul. 3, 2006 in U.S. Appl. No. 10/927,406, published as US 2005-0090916 A1, 6 pages. |
| USPTO Office Action dated Mar. 28, 2007 in U.S. Appl. No. 10/927,406, published as US 2005-0090916 A1, 6 pages. |
| USPTO Office Action dated Sep. 25, 2006 in U.S. Appl. No. 10/927,258, published as US 2005-0090027 A1, 6 pages. |
| USPTO Office Action dated Sep. 27, 2005 in U.S. Appl. No. 10/927,260, issued as patent No. 7,220,990 B2, 5 pages. |
| Zeitzoff, Peter, M., "Modeling the Statistical Variability and Optimal Process Control Requirements for a 0.18 mum NMOS Transistor," International SEMATECH, Inc., Austin, TX 78741, May 25, 2001. |
| Zeitzoff, Peter, M., "Modeling the Statistical Variability and Optimal Process Control Requirements for a 0.18 μm NMOS Transistor," International SEMATECH, Inc., Austin, TX 78741, May 25, 2001. |
Cited By (24)
| Publication number | Priority date | Publication date | Assignee | Title |
|---|---|---|---|---|
| US8990759B2 (en) * | 2003-08-25 | 2015-03-24 | Tau-Metrix, Inc. | Contactless technique for evaluating a fabrication of a wafer |
| US20100304509A1 (en) * | 2003-08-25 | 2010-12-02 | Majid Aghababazadeh | Contactless technique for evaluating a fabrication of a wafer |
| US20110047523A1 (en) * | 2006-11-01 | 2011-02-24 | Garcia Ii John D | Differential voltage defectivity monitoring method |
| US8112736B2 (en) * | 2006-11-01 | 2012-02-07 | Synopsys, Inc. | Differential voltage defectivity monitoring method |
| US8494817B1 (en) * | 2006-11-30 | 2013-07-23 | Pdf Solutions, Inc. | Methods for yield variability benchmarking, assessment, quantification, and localization |
| US8001492B2 (en) * | 2007-06-28 | 2011-08-16 | Linden Design Technologies, Inc. | Evaluation method for interconnects interacted with integrated-circuit manufacture |
| US20090001369A1 (en) * | 2007-06-28 | 2009-01-01 | Lin Wallace W | Evaluation method for interconnects interacted with integrated-circuit manufacture |
| US8161431B2 (en) * | 2008-10-30 | 2012-04-17 | Agere Systems Inc. | Integrated circuit performance enhancement using on-chip adaptive voltage scaling |
| US20100115475A1 (en) * | 2008-10-30 | 2010-05-06 | Buonpane Michael S | Integrated Circuit Performance Enhancement Using On-Chip Adaptive Voltage Scaling |
| US20100181847A1 (en) * | 2009-01-22 | 2010-07-22 | Shen-Yu Huang | Method for reducing supply voltage drop in digital circuit block and related layout architecture |
| US8640074B2 (en) | 2009-01-22 | 2014-01-28 | Mediatek Inc. | Digital circuit block having reducing supply voltage drop and method for constructing the same |
| US20100237345A1 (en) * | 2009-03-18 | 2010-09-23 | Tdk Corporation | Wafer and manufacturing method of electronic component |
| US8021712B2 (en) * | 2009-03-18 | 2011-09-20 | Tdk Corporation | Wafer and manufacturing method of electronic component |
| US20120023464A1 (en) * | 2010-01-15 | 2012-01-26 | Semiconductor Manufacturing International (Shanghai) Corporation | Automatic identification of systematic repeating defects in semiconductor production |
| US8312395B2 (en) * | 2010-01-15 | 2012-11-13 | Semiconductor Manufacturing International (Shanghai) Corporation | Automatic identification of systematic repeating defects in semiconductor production |
| US20130174115A1 (en) * | 2010-03-16 | 2013-07-04 | Synopsys, Inc. | Modeling of cell delay change for electronic design automation |
| US8977993B2 (en) * | 2010-03-16 | 2015-03-10 | Synopsys, Inc. | Modeling of cell delay change for electronic design automation |
| US20140046466A1 (en) * | 2012-08-09 | 2014-02-13 | International Business Machines Corporation | Integrated circuit product yield optimization using the results of performance path testing |
| US9058034B2 (en) * | 2012-08-09 | 2015-06-16 | International Business Machines Corporation | Integrated circuit product yield optimization using the results of performance path testing |
| US20150213952A1 (en) * | 2014-01-30 | 2015-07-30 | Hamilton Sundstrand Corporation | Multilayer capacitor with integrated busbar |
| US9552926B2 (en) * | 2014-01-30 | 2017-01-24 | Hamilton Sundstrand Corporation | Multilayer capacitor with integrated busbar |
| US10049819B2 (en) | 2014-01-30 | 2018-08-14 | Hamilton Sundstrand Corporation | Multilayer capacitor with integrated busbar |
| US10060973B1 (en) * | 2014-05-29 | 2018-08-28 | National Technology & Engineering Solutions Of Sandia, Llc | Test circuits for integrated circuit counterfeit detection |
| US9666411B1 (en) | 2014-11-14 | 2017-05-30 | Kla-Tencor Corporation | Virtual ground for target substrate using floodgun and feedback control |
Also Published As
| Publication number | Publication date |
|---|---|
| US20070004063A1 (en) | 2007-01-04 |
| WO2005020297A2 (en) | 2005-03-03 |
| JP5543953B2 (en) | 2014-07-09 |
| US20080315196A1 (en) | 2008-12-25 |
| US20070187679A1 (en) | 2007-08-16 |
| US7220990B2 (en) | 2007-05-22 |
| US7339388B2 (en) | 2008-03-04 |
| US20100304509A1 (en) | 2010-12-02 |
| US8344745B2 (en) | 2013-01-01 |
| US20050090916A1 (en) | 2005-04-28 |
| US8990759B2 (en) | 2015-03-24 |
| JP2007504654A (en) | 2007-03-01 |
| US20080100319A1 (en) | 2008-05-01 |
| JP2011097099A (en) | 2011-05-12 |
| TW200519697A (en) | 2005-06-16 |
| US7423288B2 (en) | 2008-09-09 |
| TWI276147B (en) | 2007-03-11 |
| US20050085932A1 (en) | 2005-04-21 |
| US20050090027A1 (en) | 2005-04-28 |
| WO2005020297A3 (en) | 2006-04-13 |
| US7723724B2 (en) | 2010-05-25 |
| US7605597B2 (en) | 2009-10-20 |
| JP5340538B2 (en) | 2013-11-13 |
| EP1665362A2 (en) | 2006-06-07 |
| JP2011097098A (en) | 2011-05-12 |
| US20070236232A1 (en) | 2007-10-11 |
| US20050085032A1 (en) | 2005-04-21 |
| US7736916B2 (en) | 2010-06-15 |
| US7256055B2 (en) | 2007-08-14 |
| US20070238206A1 (en) | 2007-10-11 |
| JP2012074725A (en) | 2012-04-12 |
Similar Documents
| Publication | Publication Date | Title |
|---|---|---|
| US7730434B2 (en) | Contactless technique for evaluating a fabrication of a wafer | |
| US7772867B2 (en) | Structures for testing and locating defects in integrated circuits | |
| KR100734186B1 (en) | Apparatus and method for dynamic diagnostic testing of integrated circuits | |
| JP5105720B2 (en) | Integrated circuit signal observation apparatus and method | |
| US20060164115A1 (en) | Defect analyzing device for semiconductor integrated circuits, system therefor, and detection method | |
| CN101556930B (en) | Technique for evaluating a fabrication of a semiconductor component and wafer | |
| US6650130B1 (en) | Integrated circuit device defect detection method and apparatus employing light emission imaging | |
| Apolinaria | Utilization of ELITE System for Precise Fault Localization of Metal Defect Functional Failure | |
| US6700399B1 (en) | High density parasitic measurement structure | |
| Burmer et al. | Failure analyses for debug and ramp-up of modern IC’s | |
| Ouimet et al. | Analysis of 0.13 μm CMOS technology using time resolved light emission | |
| Lee et al. | Wafer level failure analysis process flow | |
| Babazadeh et al. | First Look at Across-chip Performance Variation Using Non-Contact, Performance-Based Metrology | |
| Pelella et al. | Performance-based metrology of critical device performance parameters for in-line non-contact high-density intra-die monitor/control on a 32nm SOI advanced logic product platform | |
| Stellari et al. | Root cause identification of an hard-to-find on-chip power supply coupling fail |
Legal Events
| Date | Code | Title | Description |
|---|---|---|---|
| AS | Assignment |
Owner name: TAU-METRIX, INC.,CALIFORNIA Free format text: ASSIGNMENT OF ASSIGNORS INTEREST;ASSIGNORS:AGHABABAZADEH, MAJID;ESTABIL, JOSE J.;PAKDAMAN, NADER;AND OTHERS;SIGNING DATES FROM 20050606 TO 20050616;REEL/FRAME:016604/0813 Owner name: TAU-METRIX, INC., CALIFORNIA Free format text: ASSIGNMENT OF ASSIGNORS INTEREST;ASSIGNORS:AGHABABAZADEH, MAJID;ESTABIL, JOSE J.;PAKDAMAN, NADER;AND OTHERS;REEL/FRAME:016604/0813;SIGNING DATES FROM 20050606 TO 20050616 |
|
| STCF | Information on status: patent grant |
Free format text: PATENTED CASE |
|
| AS | Assignment |
Owner name: TEL VENTURE CAPITAL, INC., CALIFORNIA Free format text: SECURITY AGREEMENT;ASSIGNOR:TAU-METRIX, INC.;REEL/FRAME:026934/0237 Effective date: 20100809 |
|
| REMI | Maintenance fee reminder mailed | ||
| FPAY | Fee payment |
Year of fee payment: 4 |
|
| SULP | Surcharge for late payment | ||
| FEPP | Fee payment procedure |
Free format text: MAINTENANCE FEE REMINDER MAILED (ORIGINAL EVENT CODE: REM.) |
|
| FEPP | Fee payment procedure |
Free format text: 7.5 YR SURCHARGE - LATE PMT W/IN 6 MO, SMALL ENTITY (ORIGINAL EVENT CODE: M2555) |
|
| MAFP | Maintenance fee payment |
Free format text: PAYMENT OF MAINTENANCE FEE, 8TH YR, SMALL ENTITY (ORIGINAL EVENT CODE: M2552) Year of fee payment: 8 |
|
| FEPP | Fee payment procedure |
Free format text: MAINTENANCE FEE REMINDER MAILED (ORIGINAL EVENT CODE: REM.); ENTITY STATUS OF PATENT OWNER: SMALL ENTITY |
|
| LAPS | Lapse for failure to pay maintenance fees |
Free format text: PATENT EXPIRED FOR FAILURE TO PAY MAINTENANCE FEES (ORIGINAL EVENT CODE: EXP.); ENTITY STATUS OF PATENT OWNER: SMALL ENTITY |
|
| STCH | Information on status: patent discontinuation |
Free format text: PATENT EXPIRED DUE TO NONPAYMENT OF MAINTENANCE FEES UNDER 37 CFR 1.362 |
|
| FP | Lapsed due to failure to pay maintenance fee |
Effective date: 20220601 |