US7817817B2 - Method for concealing data in curves of an image - Google Patents
Method for concealing data in curves of an image Download PDFInfo
- Publication number
- US7817817B2 US7817817B2 US11/221,727 US22172705A US7817817B2 US 7817817 B2 US7817817 B2 US 7817817B2 US 22172705 A US22172705 A US 22172705A US 7817817 B2 US7817817 B2 US 7817817B2
- Authority
- US
- United States
- Prior art keywords
- curve
- parameters
- original
- image
- sample points
- Prior art date
- Legal status (The legal status is an assumption and is not a legal conclusion. Google has not performed a legal analysis and makes no representation as to the accuracy of the status listed.)
- Expired - Fee Related, expires
Links
Images


Classifications
-
- G—PHYSICS
- G06—COMPUTING; CALCULATING OR COUNTING
- G06T—IMAGE DATA PROCESSING OR GENERATION, IN GENERAL
- G06T1/00—General purpose image data processing
- G06T1/0021—Image watermarking
- G06T1/005—Robust watermarking, e.g. average attack or collusion attack resistant
-
- G—PHYSICS
- G06—COMPUTING; CALCULATING OR COUNTING
- G06T—IMAGE DATA PROCESSING OR GENERATION, IN GENERAL
- G06T1/00—General purpose image data processing
- G06T1/0021—Image watermarking
- G06T1/0028—Adaptive watermarking, e.g. Human Visual System [HVS]-based watermarking
-
- G—PHYSICS
- G06—COMPUTING; CALCULATING OR COUNTING
- G06T—IMAGE DATA PROCESSING OR GENERATION, IN GENERAL
- G06T2201/00—General purpose image data processing
- G06T2201/005—Image watermarking
- G06T2201/0051—Embedding of the watermark in the spatial domain
-
- G—PHYSICS
- G06—COMPUTING; CALCULATING OR COUNTING
- G06T—IMAGE DATA PROCESSING OR GENERATION, IN GENERAL
- G06T2201/00—General purpose image data processing
- G06T2201/005—Image watermarking
- G06T2201/0063—Image watermarking in relation to collusion attacks, e.g. collusion attack resistant
-
- G—PHYSICS
- G06—COMPUTING; CALCULATING OR COUNTING
- G06T—IMAGE DATA PROCESSING OR GENERATION, IN GENERAL
- G06T2201/00—General purpose image data processing
- G06T2201/005—Image watermarking
- G06T2201/0065—Extraction of an embedded watermark; Reliable detection
Definitions
- the invention described herein is most directly related to watermarking or fingerprinting data in images. Specifically, the invention is directed to altering curves in images by hiding data in parameters defining the curves, where the hidden data may be extracted from the difference between the original parameter and the altered parameter.
- maps are representations of geospatial information and are ubiquitous in government, military, intelligence, and commercial operations.
- maps are representations of geospatial information and are ubiquitous in government, military, intelligence, and commercial operations.
- map publishers are highly motivated to prevent unauthorized copying or distribution.
- Curvilinear structures are major components of maps, drawings, signatures, and other images and graphics.
- a huge number of curve-based documents continue to be brought into the digital domain, owing to the popularity of scanning devices and pen-based devices, such as Tablet PCs.
- Images such as digital maps and drawings are also generated directly by various computer programs, such as map-making software and computer-aided design systems.
- map-making software and computer-aided design systems The capability of hiding digital watermarks or other secondary data in curves, such as that provided by the present invention, can facilitate digital rights management of important documents in government, military, and commercial operations.
- digital fingerprints To be an effective forensic mechanism for tracing a document to its source, unique digital IDs embedded in a document, referred to herein as digital fingerprints, must be difficult to remove.
- the fingerprint For maps and other visual documents, the fingerprint has to be embedded in a robust way against attempts to bypass the protection, such as by collusion, where several users combine information from several copies of the protected map, each having the same content but different fingerprints, so as to generate a new copy in which the original fingerprints are removed or attenuated.
- Other bypass techniques include various geometric transformations, such as rotation, scaling, and translation (RST), and D/A-A/D conversions, such as printing-and-scanning.
- the fingerprint must also be embedded in a visually nonintrusive way, i.e., without changing the geographical and/or visual information conveyed by the document, in that, as previously stated, intrusive changes may have serious consequences in critical military and commercial operations. For example, disastrous equipment failures and even loss of life can ensue when inaccurate data are given to troops or fed into navigation systems.
- Curve-based documents are also represented as binary bitmap images (known as the raster representation thereof) and, as such, the prior art includes techniques for data embedding in general binary images.
- the fragility of the conventional embedding techniques for raster images and their dependence on precise sampling of pixels for correct decoding severely limit their applicability.
- Other methods embed information in dithered images by manipulating the dithering patterns.
- Known methods include manipulating the run-length fax images and changing the line spacing and character spacing in textual images. However, these methods cannot be extended easily to marking curve-based documents.
- the present invention is a robust curve watermarking method of images and may be applied to watermarking or fingerprinting maps without interfering with the geospatial meanings conveyed by the map.
- B-spline control points of curves are selected as the feature domain mutually independent, noise-like sequences are added as digital fingerprints to the coordinates of the control points.
- a proper set of B-spline control points forms a compact collection of salient features representing the shape of the curve, which is analogous to the perceptually significant components in continuous-tone image.
- the shape of curves is also invariant to such challenging attacks as printing-and-scanning and vector/raster-raster/vector conversions.
- the additive spread spectrum embedding and the corresponding correlation-based detection generally provide a good tradeoff between imperceptibility and robustness, especially when the original host signal is available to the detector, as in most of the fingerprinting applications.
- registration with the original unmarked curve is, in certain embodiments, implemented as a preprocessing step.
- B-splines have invariance to affine transformations in that the affine transformation of a curve is equivalent to the affine transformation of its control points. This affine invariance property of B-splines can facilitate automatic curve registration.
- an iterative alignment-minimization (IAM) algorithm is provided to simultaneously align the curves and identify the corresponding control points with high precision.
- IAM iterative alignment-minimization
- the curve watermarking technique of the present invention can sustain a number of challenging attacks, such as collusion, cropping, geometric transformations, vector/raster-raster/vector conversions, and printing-and-scanning and is therefore capable of building collusion-resistant fingerprinting for maps and other curve-based documents.
- a method for concealing data in an image.
- a numerical model is provided that is operable to produce a curve responsive to a plurality of parameters provided thereto.
- a plurality of numerical values representative of the data to be hidden is selected and at least one original curve is selected from the image.
- a plurality of first parameters is determined such that the model produces the first curve responsive thereto.
- Each of the plurality of values is added to a corresponding one of the first parameters to produce a plurality of second parameters, which are provided to the model to form a marked curve.
- the original curve is replaced in the image by the marked curve.
- a method for conveying information through data concealed in an image.
- a numerical model is provided that is operable to produce a curve responsive to a plurality of parameters provided thereto.
- a plurality of numerical values representative of the data is selected and at least one original curve in the image is selected.
- a plurality of first parameters is determined such that the model produces the original curve responsive thereto.
- Each of the values is added to a corresponding one of the first parameters to produce a plurality of second parameters, which are provided to the model to form a marked curve.
- the original curve is replaced in the image by the marked curve.
- a plurality of third parameters is determined such that the model produces the marked curve responsive thereto.
- Each of the plurality of values is determined from a difference between the first parameter and the third parameter.
- a method for marking an image for identifying authorized possession thereof.
- a numerical model is provided that is operable to produce a curve responsive to a plurality of parameters provided thereto.
- Each of a plurality of identification codes is assigned to a corresponding entity authorized to possess the image and a plurality of numerical values representative of one of said identification codes is selected.
- At least one original curve is selected from the image.
- a plurality of first parameters is determined such that the model produces the original curve responsive thereto.
- Each of the plurality of values is added to a corresponding one of the plurality of first parameters to produce a plurality of second parameters, which are provided to the model to form a marked curve.
- the original curve is replaced in the image by the marked curve.
- a plurality of third parameters is determined such that the model produces the produces a test curve (which may be a marked curve corrupted by noise and other distortions) responsive thereto.
- Each of the plurality of values is determined from a difference between the first parameter and the third parameter and the identification code is assembled from the retrieved values. The identity of the entity assigned the identification code can then be determined.
- FIG. 1 is a block diagram illustrating process flow and fundamental functional components of embodiments of the present invention
- FIGS. 2A-2B are line drawings respectively illustrating an original curve and a curve fingerprinted in accordance with the present invention
- FIG. 2C is a graph of a detection statistic of data concealed in the fingerprinted curve of FIG. 2B ;
- FIG. 3A is a line drawing of a printed and scanned curve that has been fingerprinted in accordance with the present invention.
- FIG. 3B is a graph of a detection statistic of data concealed in the fingerprinted curve of FIG. 3A ;
- FIG. 4 is a flow diagram illustrating fundamental processing steps of an iterative alignment-minimization algorithm (IAM) in accordance with the present invention
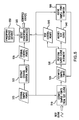
- FIG. 5 is a block diagram illustrating process flow and fundamental functional components of embodiments of the present invention implementing IAM
- FIGS. 6A-6C illustrate curve registration by IAM in accordance with the present invention
- FIGS. 7A-7C are topographical chart sections having original contours overlaid with contours fingerprinted in accordance with the present invention.
- FIGS. 8A-8C are graphs of detection statistics of fingerprinted curves after attempts at bypassing the fingerprinting of the present invention by collusion
- FIGS. 9A-9C illustrate failure of attempts at bypassing the fingerprinting of the present invention by image cropping
- FIGS. 10A-10C illustrate the detection of a fingerprint in a curve in accordance with the invention after attempts at bypassing the fingerprinting by affine transformation of the image;
- FIGS. 11A-11C illustrate the detection of a fingerprint in a curve in accordance with the invention using IAM after attempts at bypassing the fingerprinting by vector-raster-vector conversion combined with affine transformation of the image;
- FIG. 12A is a graph of detection statistics of fingerprinted curves after attempts at bypassing the fingerprinting of the present invention by vector-raster-vector conversion;
- FIGS. 12B-12C are graphs of detection statistics of fingerprinted curves after attempts at bypassing the fingerprinting of the present invention by point deletion in vector maps and raster maps, respectively;
- FIGS. 13A-13B are graphs of detection statistics of fingerprinted curves after attempts at bypassing the fingerprinting of the present invention by curve smoothing;
- FIGS. 14A-14C illustrate the derivation of 2D contours from 3D digital elevation maps
- FIG. 15 is a block diagram illustrating process flow and fundamental functional components of contour extracting embodiments of the present invention applied to 3D digital elevation maps.
- aspects of the present invention are directed to manipulating the controlling parameters that define the structure of one or more curves in an image.
- the controlling parameters may be coordinates of the control points of B-spline curve segments, to which values representative of the data to be concealed are added.
- exemplary embodiments described below utilize certain fingerprint data as the data to be hidden in the curves, the invention is applicable to other data not specifically described. Thus, the invention is not limited to curves of any specific type of image nor is it limited to any specific data that may be concealed thereby.
- image is used herein to refer to a broad class of data structures. That is to say, that while the present invention is applicable to images in hard copy documents and images displayed on a display device, the term as used herein is also intended to refer to data structures that may not be rendered in such a way as to be visible in the traditional sense to a human observer.
- image is used herein to describe any data structure that contains a curve, whether that curve is explicitly rendered or not.
- B-splines are piecewise polynomial functions that provide local approximations of curves using a small number of parameters known as the control points.
- Its B-spline approximation ⁇ p [B] (t) ⁇ can be written as
- B i,k (t) is recursively defined as
- ⁇ t i ⁇ are parameters known as knots and represent locations where the B-spline functions are tied together. The placement of knots controls the form of B-spline functions and in turn the control points.
- the number of B-spline control points necessary to represent a curve to a desired precision can be much smaller than the number of points that can be sampled from the curve.
- certain embodiments of the invention determine a smaller set of control points for its B-spline approximation by minimizing the least-squares approximation error to the original curve.
- coordinates of m+1 samples on the curve are represented as an (m+1) ⁇ 2 matrix
- each of the n+1 control points is extracted at block 110 has two coordinate values x and y, the overall length of the fingerprint sequence corresponding thereto is 2(n+1).
- a fingerprint sequence (w x ,w y ) is generated at block 115 , is scaled at block 120 , and added to the coordinates of a set of control points (c x ,c y ) at block 130 to produce watermarked control points (c′ x ,c′ y ), i.e.,
- a watermarked curve can then be constructed according to the B-spline synthesis of Eq. (1) using the resulting watermarked control points (c′ x ,c′ y ) as indicated at block 140 .
- control points ( ⁇ tilde over (c) ⁇ x , ⁇ tilde over (c) ⁇ y ) are extracted from the test curve as shown at block 150 .
- the accurate registration and correct extraction of control points are beneficial features provided by the present invention to the detection of fingerprints.
- the test control points ( ⁇ tilde over (c) ⁇ x , ⁇ tilde over (c) ⁇ y ) may be extracted from ( ⁇ tilde over (p) ⁇ x , ⁇ tilde over (p) ⁇ y ) using Eq. (6).
- the estimated fingerprint sequence extracted from a test curve includes one or more sequences corresponding to one or more users as well as noise contributions resulting from distortion or attacks.
- the problem of determining which user(s) has(have) contributed to the estimated fingerprint can be formulated through, for example, hypothesis testing known in the art.
- the similarity between the estimated fingerprint sequence and each fingerprint sequence in a database may be evaluated through a correlation-based statistic.
- the detection statistic is normalized to unity variance and to approximate a Gaussian distribution under distortions and attacks.
- a correlation statistic may be normalized by the product of the standard deviation of the noise and the watermark's L 2 norm.
- the sample correlation coefficient r between ⁇ tilde over (w) ⁇ and w may be computed by
- the corresponding components of an extracted fingerprint in question and a particular user's fingerprint may be considered as i.i.d. samples from a bivariate normal population.
- the expected correlation coefficient is zero, and the Z statistic will approximate a Gaussian distribution with a zero mean and a unit variance.
- the Z statistic will have a large positive mean determined by the correlation coefficient ⁇ .
- a random variable Y W+N may be defined and the extracted fingerprint consists of i.i.d. samples from Y.
- W may be a zero-mean Gaussian random variable representing the user's fingerprint
- N is a zero-mean Gaussian random variable representing noise.
- the correlation coefficient of this bivariate normal population (W, y) is
- the distribution of the Z statistics is then known in the presence and absence of the user's fingerprint, and the probabilities of detection P d and false alarm P fa may be determined for different decision thresholds. For example, a threshold of 3 results in a false alarm probability on the order of 10 ⁇ 3 , while a threshold of 6 corresponds to the order of 10 ⁇ 9 .
- the correlation test, indicated at block 170 identifies the user whose fingerprint is embedded on the test curve.
- Effective collusion resistance is a defense against different users manipulating copies of the same content in the possession of each traitor to remove the respective embedded IDs therefrom.
- a collusion-resistant coded fingerprint implementation requires that each code symbol be reliably embedded, thus consuming a nontrivial number of markable features per embedded bit.
- the markable feature for the curve watermarking of the present invention is, in the exemplary embodiment, the coordinates of control points. As the number of control points is limited and the changes thereto should be made small, orthogonal modulation that implements orthogonal signals to represent different users is preferred to other possible coding techniques of the prior art. It has been shown in previous studies that the maximum number of colluders that the system can resist is a function of the watermark-to-noise ratio, the number of markable features, the total number of users, as well as the false positive and negative threshold margins.
- a pseudo-random number generator is used to produce a sequence of independent random numbers as a fingerprint and uses different seeds for different users.
- the actual fingerprints are statistically uncorrelated, but may have a nonzero correlation.
- Such correlation can accommodate a larger number of fingerprint vectors than the vector's dimension, but it also affects the detection performance to some degree. Since the correlation is very low between the independent fingerprints, the impact has been shown to be small.
- the knots connecting adjacent segments of B-splines should be prudently placed, and the sampling points should be properly chosen so as to be compatible with the least-squares estimator for the control points.
- uniform sampling can be used when there are no abrupt changes in a curve segment, while nonuniform sampling is desirable for curve segments that exhibit substantial variations in curvature.
- k ⁇ ( t ) ⁇ ⁇ ⁇ p x ′ ⁇ p y ′′ - p y ′ ⁇ p x ′′ ( p x ′2 + p y ′2 ) 3 / 2 ( 13 )
- p′ x dp x /dt
- p′′ x d 2 p x /dt 2
- p′ y dp y /dt
- p′′ y d 2 p y /dt 2 .
- the curvature is approximated at each point on the curve by measuring the angular change in the tangent line at its location.
- a 1 st -order polynomial curve fitting may be applied on an l-pixel interval before and after the curve point p (t) to get two slopes, k 1 and k 2 .
- ⁇ circumflex over (k) ⁇ (t) more sample points may be selected from higher-curvature segments and fewer sample points may be selected from lower-curvature segments.
- the uniform nonperiodic B-spline blending function of order k 3
- t values of the sample points are increased in proportion to the chord length
- a set of discrete, nonuniformly spaced points for each curve is provided. Since a vector curve can be rendered as a raster curve by interpolation, sample points and corresponding indexing values of a vector curve may be determined by rendering into a raster curve and then performing the curvature-based sampling and the chord-length method, as described above. In an alternative method the given discrete points are directly used as sample points, but their indexing values are assigned according to a curvature-based rule. For example, the curvature of each sample point (p x (s j ),p y (s j )) may be approximated by
- k ⁇ ⁇ ( s j ) ⁇ arctan ⁇ ⁇ p y ⁇ ( s j + 1 ) - p y ⁇ ( s j ) p x ⁇ ( s j + 1 ) - p x ⁇ ( s j ) - arctan ⁇ p y ⁇ ( s j ) - p y ⁇ ( s j - 1 ) p x ⁇ ( s j ) - p x ⁇ ( s j - 1 ) ⁇ ( 15 )
- the values of t of the sample points are increased in inverse proportion to their curvature; the higher the curvature, the smaller the increase in the t value.
- the number of control points is an important parameter for tuning in that depending on the shape of the curve, using too few control points may cause the details of the curve to be lost, while using too many control points may lead to introducing artifacts before data embedding.
- One method of determining the number of control points in accordance with the invention is to compute the approximate curvature of each sample point as in Eq. (15) and assign higher weights to points with higher curvature. The number of control points may then be determined according to the total weights of all sample points on the curve. In many applications, the number of control points is approximately 5-8% of the total number of curve pixels.
- the scaling factor ⁇ also affects the invisibility and robustness of fingerprints.
- industrial standards provide guidelines on the maximum allowable changes. Perturbation of two to three pixels is usually considered acceptable. Random number sequences with a unit variance as fingerprints and ⁇ set to 0.5 has shown to comply with standards as well as provide adequate robustness.
- d (a,b) be the distance between two points a and b, which are on two curves A and B, respectively.
- the distance from point a to curve B is defined as d(a,B) inf b ⁇ B d(a,b), and the distance from curve A to curve B is defined as d B (A) sup a ⁇ A d ( ⁇ ,B).
- the Hausdorff distance between curve A and B is then h( A,B ) d B ( A )+d A ( B ).
- the fingerprint detection process previously described makes use of the original unmarked copy and is thus known as nonblind detection.
- Blind detection is preferred for some major data hiding applications (such as ownership verification, authentication, and annotation), but nonblind detection techniques are preferred for many fingerprinting applications.
- Nonblind detection is preferred because fingerprint verification is usually handled by the content owner or by an authorized central server, who can have access to the original host signal and use it to detect the origin of the fingerprint in a suspicious document.
- the availability of the original unmarked copy in the detection gives a high equivalent watermark-to-noise ratio, thus allowing for high resistance against noise and attacks.
- the detector can register a test copy that suffers from geometric distortions, which provide resilience to various geometric transformations as will be described below.
- FIG. 2A illustrates a curve that was hand-drawn on a Tablet PC and stored as binary image of size 521 ⁇ 288.
- a contour following algorithm known in the art was used to traverse the curve and obtain a set of ordered curve points. Uniform sampling on the curve points was conducted and the indexing values of the sample points were determined using the chord-length method.
- the Hausdorff distance between the original and marked curve is 3.4. The differences are hardly visible to the human eye.
- the test control points are provided to the correlation-based detection process.
- the detection results on the fingerprinted curve are shown in FIG. 2C , which illustrates a high Z value for the correct positive detection with the 1000 th sequence corresponding to the true user, and very small Z statistics for the correct negative detection with other sequences of innocent users.
- FIGS. 3A-3B printing-and-scanning resiliency of the present invention is demonstrated. Registration between the scanned fingerprinted curve and the original unmarked curve was accomplished manually. The fingerprinted curve was printed on a laser printer and scanned back as a 527 ⁇ 288 binary image, as shown in FIG. 3A . In addition to registration, certain embodiments of the invention perform a thinning operation on the curve to extract a one-pixel-wide skeleton from the scanned curve that is usually several pixels wide after high-resolution scanning. The detection results are shown in FIG. 3B , where it can be observed that, despite the curve being simple and the number of control points being relatively small, the fingerprint survives the printing-an-scanning process and gives a detection statistic higher than the detection threshold.
- a step preceding the basic fingerprint detection module is provided to align the test curve with the original. While the manual registration previously demonstrated is one way to compensate for simple geometric distortions, automated registration is more desirable in that both accuracy and efficiency are improved thereby.
- a test curve should be registered with the original unmarked curve, and any “clean/undistorted” fingerprinted copies known to the detector should not be used as a reference for registering the test curve. This is not only to allow a determination of fingerprints are present in the test curve, but also because using a fingerprinted copy as a reference for registration may increase the false alarm probability in determining the presence or absence of a particular fingerprint.
- B-splines possess an affine invariance property, they have been previously used in curve alignment prior art.
- B-spline control points which refers to the fact that the same curve can be effectively approximated by more than one different set of B-spline control points.
- the difference between two sets of unmarked control points it is possible for the difference between two sets of unmarked control points to be much larger than the embedded fingerprint sequence.
- the fingerprint sequence may not be resoluble.
- View-I will refer to the geometric configuration of the original unmarked curve and the term “View-I” to refer to the configuration of the test curve.
- the two curves can be registered by transforming the test curve from “View-II” to View-I” or transforming the original curve from “View-I” to “View-II.”
- each point (x, y) on one curve may be transformed to a corresponding point ( ⁇ tilde over (x) ⁇ , ⁇ tilde over (y) ⁇ ) on another curve via
- [ x ⁇ y ⁇ ] [ a 11 a 12 a 21 a 22 ] ⁇ [ x y ] + [ a 13 a 23 ] ( 17 )
- ⁇ a ij ⁇ are parameters representing the collective effect of scaling, rotation, translation, reflection and shearing.
- the transform parameters can also be represented in a homogeneous coordinate by two column vectors a x and a y or by a single matrix A:
- the original curve available to the detector in fingerprinting applications can be a raster curve or a vector curve. It is assumed that the detector knows the original set of sample points (p x ,p y ) ⁇ (Bc x ,Bc y ) used for estimating the set of control points on which data embedding is applied.
- the test curve can be a vector curve with sampled curve points ( ⁇ tilde over (v) ⁇ x , ⁇ tilde over (v) ⁇ y ) or a raster curve with pixel coordinates ( ⁇ tilde over (r) ⁇ x , ⁇ tilde over (r) ⁇ y ).
- test vector points ( ⁇ tilde over (v) ⁇ , ⁇ tilde over (v) ⁇ y ) and the original set of control points (c x ,c y ) are related by
- (n x , n y ) represents additional noise applied to the transformed fingerprinted vector points
- 1 is a column vector with all 1s.
- an iterative alignment-minimization algorithm is used to align the test curves with the original curves while concurrently identifying the point correspondence of the sample points.
- an IAM algorithm consistent with the present invention is composed of three main steps, where the latter two steps are executed iteratively.
- First, an initial estimation of the test sample point is obtained.
- curve alignment is performed to estimate concurrently both the transform parameters and the control points of the test curve.
- Curve alignment may be achieved by fitting a B-spline to the superimposed curves and minimizing the fitting error.
- the estimation of point correspondence is refined through a nearest-neighbor rule.
- a loop index i is initialized in block 410 .
- initial sample points ( ⁇ tilde over (p) ⁇ x (1) , ⁇ tilde over (p) ⁇ y (1) ) are selected from the test curve using the following simple estimator.
- ⁇ j m are integers ranging from 0 to M ⁇ 1
- ⁇ tilde over (J) ⁇ round(( ⁇ tilde over (M) ⁇ 1/M ⁇ 1) ⁇ J).
- the corresponding sample points from the test curve are taken as the initial estimate.
- an attempt is made to align the curve with the estimated sample points.
- a curve alignment method such as that described in Xia, et al., “Image Registration by ‘Super-curves’”, IEEE Trans. Image Process , Vol. 13, no. 5, pp. 720-732, May 2004, is applied to estimate the transform parameters and the control points of the test curve. For example, the transform parameters from View-I (the original curve) to View-II (the test curve) are taken (a x (i) ,a y (i) ).
- the sample points on the test curve can be transformed back to View-I by (g x (i) ,g y (i) )
- the transformed test sample points as well as the original sample points are fit with a single B-spline curve.
- a set of transform parameters ( ⁇ x (i) , ⁇ y (i) ) and B-spline control points ( ⁇ x (i) , ⁇ y (i) ) is sought that minimizes the fitting error
- flow is directed to block 450 where refinement of the sample point estimation on the test curve is performed.
- the test raster curve ( ⁇ tilde over (r) ⁇ x , ⁇ tilde over (r) ⁇ y ) is aligned with the original curve by transforming it to View-I
- the closest point from the aligned test raster curve ( ⁇ tilde over (r) ⁇ x,I (i) , ⁇ tilde over (r) ⁇ y,I (i) ) to the point (Bc x ,Bc y ) is sought.
- the collection of these closest points is denoted as ( ⁇ tilde over (p) ⁇ x,I (i+1) , ⁇ tilde over (p) ⁇ y,I (i+1) ).
- These nearest neighbors form a refined estimate of the test sample points in View-I and are then transformed with parameters ( ⁇ x (i) , ⁇ y (i) ) back to View-II as a new estimate of the test sample points
- FIG. 5 illustrates an exemplary embodiment of the detection process of the present invention with IAM implemented therein.
- the sample points of the original curve are used to extract the original control points, in block 525 , and are used to initialize the estimation of the sample points of a test curve, as described above, in block 510 .
- the estimated sample points, indicated at block 520 are provided to the super-curve alignment procedure described above in block 530 .
- the aligned test curve, indicated at block 540 is provided to the sample point estimation process, such as the nearest-neighbor process described above, in block 560 .
- the refined sample points are fed back to the super-curve alignment of block 530 for the next iteration of the registration process.
- the super-curve alignment process at block 530 provides a set of test control points, indicated at block 545 .
- the test control points are compared with the original control points 535 to extract, as described above, the fingerprint sequence associated with the test curve, as shown in block 555 .
- the fingerprint sequence can be compared to those in a database, as indicated at block 550 , to determine the identity of the user.
- FIG. 6A there is shown an original curve and a fingerprint curve having undergone vector-raster conversion and geometric transformation.
- the original curve consists of 367 vector points, which are used as sample points to estimate a set of 200 control points for data embedding.
- a fingerprinted curve with 367 vector points is generated, rendered to be a raster curve, and affinely transformed.
- the IAM algorithm is applied to align the test curve with the original one and to estimate the correspondence between sample points.
- the estimated sample points for the test curve after one iteration and 15 iterations are shown in FIG. 6B and FIG. 6C , respectively. It is to be noted that, initially, the estimated values deviate from the true values by a nontrivial amount, whereas after 15 iterations, the estimated values converge on the true values.
- test curves may be effectively registered with the original unmarked curve and the fingerprinted control points may be extracted with high accuracy.
- the data embedding method of the present invention is resilient to combinations of scaling, rotation, translation, and shearing.
- the explicit estimation of point correspondence also provides resilience to the vector-raster and vector-raster-vector conversions.
- a fingerprinted curve stored in vector format is rendered as a raster curve, and thus the point correspondence is no longer directly available from the raster curve representation.
- the intermediate raster curve is converted to a vector curve with a new set of vector points that are likely to be different from the initial vector points prior to the conversion, even though there is little visual difference between these two vector curves.
- the point correspondence is likely to be corrupted by the conversion, and accurate estimation of point correspondence becomes a significant step in the successful detection of the fingerprint.
- the curve fingerprinting method of the present invention can resist a number of challenging attacks and distortions.
- the distortion from printing-and-scanning involves both vector-raster rendering and a certain amount of rotation, scaling, and translation; a fingerprinted curve in vector format may be rendered as a raster image and then affinely transformed before reaching the detector; in the collusion scenario, colluders may construct a colluded copy, print it out, and then distribute it out of the allowed domain.
- the curve fingerprinting method of the present invention will now be demonstrated in the context of tracing and tracking topographic maps.
- a topographic map provides a two-dimensional representation of the earth's 3-D surface. Vertical elevation is shown with contour lines (also known as level lines) to represent the earth's surfaces that are of equal altitude.
- Contour lines in topographic maps often exhibit a considerable amount of variations and irregularities, prompting the need for nonuniform sampling of curve points in the parametric modeling of the contours.
- FIG. 7A An 1100 ⁇ 1100 topographic vector map is shown in FIG. 7A .
- Nine curves that are sufficiently long for demonstration purposes are selected and for each of these nine curves, a set of nonuniformly spaced vector points is given by the original dataset.
- the vector points are used as sample points and their indexing values are determined according to the curvature-based rule presented above.
- a total of 1331 control points are used to carry the fingerprint.
- FIG. 7B the nine original curves and the corresponding marked curves are overlayed using solid lines and dotted lines, respectively.
- FIG. 7C an enlarged portion of the overlaid image is shown in FIG. 7C . It can be observed that the fingerprinted map preserves the geospatial information in the original map with high precision.
- the perturbation can be adapted to be compliant with cartographic industry standards and/or the need of specific applications.
- FIGS. 8A-8C illustrates the detection statistics under two different types of collusion attacks.
- FIG. 8A shows the collusion results under a random interleaving attack, where the control points for each curve are equiprobably taken from two differently fingerprinted maps.
- the collusion attack shown in FIG. 8B and FIG. 8C is known as averaging, where the coordinates of the corresponding control points from two and five differently fingerprinted maps are averaged, respectively. The availability of correct point correspondence has been assumed. It should be observed from the detection statistics that the embedded fingerprints from all contributing users survive the collusion attacks and are identified with high confidence.
- an area of a fingerprinted vector map is cropped and utilized as the test map.
- the nine curves used for carrying the fingerprint only two curves are retained having sufficient length to carry a fingerprint sequence.
- detection is performed on these two retained segments and obtain the detection result shown in FIG. 9C .
- the detection statistic with the correct fingerprint is still sufficiently high so that its corresponding user can be identified with high confidence.
- a fingerprinted vector map has applied thereto a combination of rotation, scaling, and translation. More specifically, the image is rotated by 30°, then scaled by 120% and 80% in the X and Y directions, respectively, followed by 100- and 200-pixel translation in the X and Y directions, respectively.
- the resulting vector map is shown in FIG. 10A . It is assumed that correct point correspondence is available. Thus, the super-curve alignment method cited above can be directly applied to register the original and the test curves and to extract the control points.
- the registered vector map is shown in FIG. 10B , and FIG. 10C shows the detection statistics. It is observed that the embedded fingerprint can survive affine transformations, and the detection statistic with the correct fingerprint is high after the registration.
- FIG. 11A a fingerprinted vector map after raster rendering as a 1100 ⁇ 110 image and affine transformations is provided as shown in FIG. 11A .
- the affine transformation consists of 10° rotation, 80% and 140% scaling in the X and Y directions, respectively, and 10- and 20-pixel translation in the X and Y directions, respectively.
- the IAM algorithm is applied to estimate the transform parameters and to locate the sample points on test curves corresponding to those used in the embedding.
- the registered raster map results as is shown in FIG. 11B , with the detection statistics being shown in FIG. 11C .
- the detection statistic results suggest that the embedded fingerprint is identified with high confidence.
- the total duration of the detection process is approximately 42.43 sec., including 40.05 sec for curve registration and fingerprint extraction from nine curves and 2.38 sec for evaluating Z statistics with 1000 fingerprint sequences.
- a fingerprinted vector map is first rendered as a raster map. Then, the rendered map is uniformly sampled to obtain a new vector map, which has the same number of vector points as prior to the conversion, but at different sampling locations. In the detection process, this “new” vector map is rendered as a raster map by linear interpolation and then the IAM algorithm is applied. From the high detection statistic shown in FIG. 12A , it is readily observed that the invention method is robust against the vector-raster-vector attack.
- Traitor tracing applications usually involve adversaries who have strong incentives to remove fingerprints. Attackers may delete a certain number of points from a fingerprinted vector/raster map while keeping similar shapes of its contour lines. Detection statistics after point deletion in a fingerprinted vector and raster are shown in FIGS. 12B and 12C , respectively. For the vector map, 20% of points were randomly chosen and removed from each fingerprinted curve, whereas in the raster map 70% of black pixels on the curve were randomly chosen and removed. It is plain that the embedded fingerprints can survive point deletion applied to both vector maps and raster maps. Similar to the vector-raster-vector conversion test, linear interpolation and the IAM algorithm were used in fingerprint detection.
- curve smoothing can be applied to topographic maps as an attempt to remove the embedded fingerprint.
- each marked curve is traversed and a moving average filter is applied thereto.
- a curve point with coordinates (r x i ,r y i ) will be replaced by a new point, whose coordinates (r x i (s) ,r y i (s) ), by
- the fingerprint is weakened by the smoothing operation, but the detection statistics are still well above the threshold for a correct positive detection. In the latter case, when a long filter is used in the smoothing attack, some visual details are lost from the curves.
- the present invention is robust against curve smoothing, provided that the smoothing does not severely change the shape of the curve and the fingerprint sequence is sufficiently long for the detector to collect adequate information for a positive detection.
- the present invention has been shown above as being an effective method for concealing data in 2-dimensional image data. It is to be noted, however, that the invention is not confined to such images. In fact, the extension of the present invention to 3-D digital elevation maps (DEMs) is described in the paragraphs that follow.
- DEMs digital elevation maps
- a DEM provides a discrete digital representation of surface terrains, by defining a set of points (x, y, z) in three-dimensional space.
- the coordinates (x, y) indicate the spatial location of the point, while the z coordinate represents its elevation.
- An example DEM for the Monterey Bay region is shown in FIG. 14A , where the ocean-floor depth data are obtained from the U.S. National Geophysical Data Center (NGDC).
- NGDC National Geophysical Data Center
- acquisition systems used to obtain DEM data have been improved to achieve better resolution in both the spatial plane and the elevation coordinate. With such improvement, DEMs have become more widely used in military and commercial operations, such as navigation, landing, petroleum exploration, and land use planning.
- DEMs Because of the large amount of efforts put in acquiring DEM data as well as their critical role in practical applications, DEMs have high commercial values and should be protected from unauthorized copying and re-distribution. Furthermore, DEM data used in military applications contain sensitive information, and prompt the need for preventing information leakage as well as tracing the source of a leak.
- the data points of DEMs are generally acquired and archived using a rectangular grid. If the spatial location (x, y) are taken as the image coordinates, and the elevation value z as the image intensity, a 3-D DEM can be represented by a 2-D gray-scaled image, as shown in FIG. 14B .
- a DEM generally contains significant amounts of redundant information in that neighboring points in many regions have smoothly changing elevations. Thus, applications of the DEM often focus on elevation contours extracted from the DEM, as opposed to the DEM itself
- a contour line represents the earth's surfaces that have an equal altitude. From a given DEM, a set of contours corresponding to certain elevations can be extracted, forming a 2-D topographic map as shown in FIG. 14C .
- a DEM has critical contours corresponding to topographic features of a terrain, such as the maxima, the minima, and the saddle points.
- critical contours are essential to a DEM and largely determine the terrain features, attackers are often not willing to completely remove or seriously distort them.
- the critical contours corresponding to saddle points are extracted and used to carry the fingerprint.
- other critical contours may be selected but consideration to the probability of their exclusion in an attack should be duly paid.
- FIG. 15 The fundamental steps of the invention are shown in FIG. 15 .
- the critical 2-D contours are identified and extracted from the given DEM, as shown at block 1510 .
- Flow is then transferred to block 1530 , where the fingerprint sequence, generated in block 1515 and scaled in block 1520 as described above, are embedded into the selected 2-D contours in accordance with the invention.
- a fingerprinted DEM is constructed in block 1540 from the marked 2-D contours.
- the critical contours are extracted at the elevations corresponding to those used in the embedding, as shown at block 1550 .
- the data in question are already rendered in 2-D contours, in which case they are passed directly to the detector.
- the fingerprint sequence is determined from these 2-D contours, as shown at block 1560 , by the inventive methods described above.
- the similarity between the estimated fingerprint sequence and a fingerprint sequence retrieved from a database, as shown at block 1565 is evaluated through, for example, a correlation-based Z statistic. If the similarity is higher than a predetermined threshold, the user corresponding to the fingerprint sequence may be identified as a source of information leakage.
- the correlation based threshold detection is shown at block 1570 of the Figure.
- the critical elevations may be identified using Morse theory and extrema filters.
- the upper level set of a critical elevation consists of locations where the height is greater than or equal to the critical elevation.
- the canny edge detection method or similar methods known in the art, may be used to extract the boundary of the upper level set as one critical contour. Each extracted critical contour is traversed and represented as a set of ordered curve points.
- the curve points are non-uniformly sampled, with more sample points selected for higher-curvature segments.
- the selected sample points may be provided to a least-squares estimator to obtain the B-spline control points of the contour.
- a scaled version of the fingerprint sequence is added to the coordinates of the B-spline control points, and a watermarked 2-D contour is constructed from the watermarked control points by using the B-spline synthesis equation.
- the elevation values of the original 3-D DEM are modified at locations around the marked contour so that the upper level set from the modified 3-D DEM has the marked 2-D contour as its boundary.
Abstract
Description
where t ranges from 0 to n−1, ci=(cx
where {ti} are parameters known as knots and represent locations where the B-spline functions are tied together. The placement of knots controls the form of B-spline functions and in turn the control points.
The indexing values of the B-spline blending functions corresponding to these m+1 samples are t=s0, s1, . . . , sm where s0<s1< . . . <sm. Further, let C represent a set of n+1 control points
Then, the least-squares solution is that of
where {B}ji is the value of the k-th order B-spline blending function Bi,k(t) in Eq. (2) evaluated at t=sj for the i-th control point and † denotes the pseudo inverse of a matrix. Because of the natural decoupling of the x and y coordinates in the B-spline representation, the solution can be found separately along the axes of each of the two coordinates as
where the scaling factor α adjusts the fingerprint influence on the curve. A watermarked curve can then be constructed according to the B-spline synthesis of Eq. (1) using the resulting watermarked control points (c′x,c′y) as indicated at
has been shown to asymptotically follow a normal distribution when L→∞, and the distribution has a mean approximating (½) log((1+ρ)/(1−ρ)) and a
The approximation of Eq. (9) has proven to provide excellent results with as few as ten pairs of samples.
where the watermark-to-noise ratio WNR
where p′x=dpx/dt,p″x=d2px/dt2, p′y=dpy/dt and p″y=d2py/dt2. In many practical implementations of the invention the curvature is approximated at each point on the curve by measuring the angular change in the tangent line at its location. For example, a 1st-order polynomial curve fitting may be applied on an l-pixel interval before and after the curve point p (t) to get two slopes, k1 and k2. The approximate curvature {circumflex over (k)}(t) may then be computed by {circumflex over (k)}(t)=|arctan(k1)−arctan(k2)|. As determined from {circumflex over (k)}(t), more sample points may be selected from higher-curvature segments and fewer sample points may be selected from lower-curvature segments.
where s0=0 and ∥pj−pj−1∥ denotes the chord length between points pj and pj−1.
The values of t of the sample points are increased in inverse proportion to their curvature; the higher the curvature, the smaller the increase in the t value. This is equivalent to having more control points for higher-curvature segments. With more “resources” in terms of B-spline control points assigned to segments with more details (i.e., higher curvature segments), improved B-spline approximation is provided.
h(A,B)
where {aij} are parameters representing the collective effect of scaling, rotation, translation, reflection and shearing. The transform parameters can also be represented in a homogeneous coordinate by two column vectors ax and ay or by a single matrix A:
Similarly, the inverse transform can be represented by
where (nx, ny) represents additional noise applied to the transformed fingerprinted vector points, and 1 is a column vector with all 1s. With the point correspondence known, the only issue is curve alignment, which can be achieved by directly applying any of many known curve alignment methods. However, in addition to possible affine transformations between the original and the test curves, the correct point correspondence information may not always be available. This is especially the case after a fingerprinted curve undergoes vector-raster conversions and/or printing-and-scanning. In these situations, both transform parameters for the curve alignment and point correspondence must be estimated in order to locate the fingerprinted control points successfully.
where {tilde over (P)}(i)
The estimated control points (ĉx (i),ĉy (i)) can then be used to estimate the fingerprint sequence and further compute the detection statistic Z(i), as described above.
As the fingerprinted sample points (B(cx+αwx),B(cy+αwy)) are located in the neighborhood of their corresponding unmarked version (Bcx,Bcy), a nearest-neighbor rule may be applied to refine the estimation of the test curve's sample points. For example, for each point of(Bcx,Bcy), the closest point from the aligned test raster curve ({tilde over (r)}x,I (i),{tilde over (r)}y,I (i)) to the point (Bcx,Bcy) is sought. The collection of these closest points is denoted as ({tilde over (p)}x,I (i+1),{tilde over (p)}y,I (i+1)). These nearest neighbors form a refined estimate of the test sample points in View-I and are then transformed with parameters (ãx (i),ãy (i)) back to View-II as a new estimate of the test sample points
After this update, the index i is incremented at
where 2S+1 is the filter length. Finally, the IAM algorithm of the present invention is applied to these smoothed curves and the detection statistics were computed. Two different filter lengths (5 and 21) are used in our experiments. As shown in
Claims (9)
Priority Applications (1)
| Application Number | Priority Date | Filing Date | Title |
|---|---|---|---|
| US11/221,727 US7817817B2 (en) | 2004-09-10 | 2005-09-09 | Method for concealing data in curves of an image |
Applications Claiming Priority (2)
| Application Number | Priority Date | Filing Date | Title |
|---|---|---|---|
| US60883904P | 2004-09-10 | 2004-09-10 | |
| US11/221,727 US7817817B2 (en) | 2004-09-10 | 2005-09-09 | Method for concealing data in curves of an image |
Publications (2)
| Publication Number | Publication Date |
|---|---|
| US20060056695A1 US20060056695A1 (en) | 2006-03-16 |
| US7817817B2 true US7817817B2 (en) | 2010-10-19 |
Family
ID=36033998
Family Applications (1)
| Application Number | Title | Priority Date | Filing Date |
|---|---|---|---|
| US11/221,727 Expired - Fee Related US7817817B2 (en) | 2004-09-10 | 2005-09-09 | Method for concealing data in curves of an image |
Country Status (1)
| Country | Link |
|---|---|
| US (1) | US7817817B2 (en) |
Cited By (8)
| Publication number | Priority date | Publication date | Assignee | Title |
|---|---|---|---|---|
| US20090003667A1 (en) * | 2007-06-27 | 2009-01-01 | National Cheng Kung University | Cephalogram Image Analysis Method |
| US20120261135A1 (en) * | 2011-04-15 | 2012-10-18 | Nowak Ethan J | Shape-Based Metrics In Reservoir Characterization |
| US20130129196A1 (en) * | 2010-06-03 | 2013-05-23 | Sylvain Paris | Image Adjustment |
| US8731309B1 (en) * | 2013-03-15 | 2014-05-20 | Exelis Inc. | Method and system for processing raster scan images |
| US8787659B2 (en) | 2011-09-02 | 2014-07-22 | Adobe Systems Incorporated | Automatic adaptation to image processing pipeline |
| US9008415B2 (en) | 2011-09-02 | 2015-04-14 | Adobe Systems Incorporated | Automatic image adjustment parameter correction |
| US20150170313A1 (en) * | 2013-12-16 | 2015-06-18 | Thomson Licensing | Method for watermarking a three dimensional object |
| US9721318B2 (en) | 2014-08-29 | 2017-08-01 | Thomson Licensing | Method for watermarking a three dimensional object and method for obtaining a payload from a three dimensional object |
Families Citing this family (25)
| Publication number | Priority date | Publication date | Assignee | Title |
|---|---|---|---|---|
| US6449377B1 (en) * | 1995-05-08 | 2002-09-10 | Digimarc Corporation | Methods and systems for watermark processing of line art images |
| US7817817B2 (en) * | 2004-09-10 | 2010-10-19 | University Of Maryland | Method for concealing data in curves of an image |
| US7567262B1 (en) * | 2005-02-25 | 2009-07-28 | IDV Solutions LLC | Hybrid graphics for interactive reporting |
| KR100809521B1 (en) * | 2005-12-08 | 2008-03-04 | 한국전자통신연구원 | Method and apparatus of surface reconstruction using corresponding curves in multiple images |
| US7848571B2 (en) * | 2006-06-26 | 2010-12-07 | Keystream Corporation | Computer-implemented method for efficient image segmentation using automated saddle-point detection |
| US20080051648A1 (en) * | 2006-08-25 | 2008-02-28 | Suri Jasjit S | Medical image enhancement system |
| US8077933B1 (en) * | 2006-09-06 | 2011-12-13 | Fiske Software, Llc | Matching prints with feature collections |
| JP4123299B1 (en) * | 2007-02-21 | 2008-07-23 | 富士ゼロックス株式会社 | Image processing apparatus and image processing program |
| US7975313B2 (en) | 2007-08-14 | 2011-07-05 | International Business Machines Corporation | System and method for tracing Tardos fingerprint codes |
| US9729316B2 (en) | 2008-02-27 | 2017-08-08 | International Business Machines Corporation | Unified broadcast encryption system |
| US20100004526A1 (en) * | 2008-06-04 | 2010-01-07 | Eigen, Inc. | Abnormality finding in projection images |
| US8122501B2 (en) * | 2008-06-20 | 2012-02-21 | International Business Machines Corporation | Traitor detection for multilevel assignment |
| US8108928B2 (en) * | 2008-06-20 | 2012-01-31 | International Business Machines Corporation | Adaptive traitor tracing |
| US8422684B2 (en) * | 2008-08-15 | 2013-04-16 | International Business Machines Corporation | Security classes in a media key block |
| US8571209B2 (en) | 2009-01-19 | 2013-10-29 | International Business Machines | Recording keys in a broadcast-encryption-based system |
| US8893292B2 (en) * | 2012-11-14 | 2014-11-18 | Mitsubishi Electric Research Laboratories, Inc. | Privacy preserving statistical analysis for distributed databases |
| CN103440614B (en) * | 2013-02-05 | 2016-03-09 | 浙江工业大学 | Based on the three-dimensional mesh data guard method of virtual pattern watermark |
| US9965893B2 (en) * | 2013-06-25 | 2018-05-08 | Google Llc. | Curvature-driven normal interpolation for shading applications |
| EP3058339B1 (en) | 2013-10-07 | 2019-05-22 | APDN (B.V.I.) Inc. | Multimode image and spectral reader |
| US9412284B2 (en) * | 2014-04-15 | 2016-08-09 | Apdn (B.V.I.) Inc. | Contour encryption and decryption |
| AU2014216000A1 (en) * | 2014-08-22 | 2016-03-10 | Canon Kabushiki Kaisha | A non-uniform curve sampling method for object tracking |
| WO2016105574A1 (en) * | 2014-12-23 | 2016-06-30 | Qualcomm Incorporated | High order b-spline sampling rate conversion (src) |
| US10995371B2 (en) | 2016-10-13 | 2021-05-04 | Apdn (B.V.I.) Inc. | Composition and method of DNA marking elastomeric material |
| US10920274B2 (en) | 2017-02-21 | 2021-02-16 | Apdn (B.V.I.) Inc. | Nucleic acid coated submicron particles for authentication |
| CN106909730B (en) * | 2017-02-21 | 2020-05-05 | 山东师范大学 | Building three-dimensional model simulation method and system based on homotopy mapping algorithm |
Citations (19)
| Publication number | Priority date | Publication date | Assignee | Title |
|---|---|---|---|---|
| US6058200A (en) * | 1996-05-10 | 2000-05-02 | Blaseio; Gunther | Method of manipulating cephalometric line tracings |
| US6304266B1 (en) * | 1999-06-14 | 2001-10-16 | Schlumberger Technology Corporation | Method and apparatus for volume rendering |
| US20010056410A1 (en) * | 2000-06-26 | 2001-12-27 | Kazushi Ishigaki | Electronic commerce system and method |
| US6567087B1 (en) * | 2000-03-27 | 2003-05-20 | The United States Of America As Represented By The Secretary Of The Army | Method to create a high resolution database |
| US20030128209A1 (en) * | 2002-01-09 | 2003-07-10 | Massachusetts Institute Of Technology | Shape-intrinsic watermarks for 3-D solids |
| US20030161498A1 (en) * | 1999-01-13 | 2003-08-28 | Nec Corporation | Digital watermark inserting system and digital watermark characteristic parameter table generating method |
| US6678378B1 (en) * | 1998-06-09 | 2004-01-13 | Monolith Co., Ltd. | 3-dimensional shape data encryption and decryption |
| US20040027344A1 (en) * | 2002-03-27 | 2004-02-12 | Sony Corporation | Three-dimensional terrain-information generating system and method, and computer program therefor |
| US6697497B1 (en) * | 1998-12-22 | 2004-02-24 | Novell, Inc. | Boundary identification and characterization through density differencing |
| US20040095352A1 (en) * | 2000-11-27 | 2004-05-20 | Ding Huang | Modeling object interactions and facial expressions |
| US6748362B1 (en) * | 1999-09-03 | 2004-06-08 | Thomas W. Meyer | Process, system, and apparatus for embedding data in compressed audio, image video and other media files and the like |
| US20040113910A1 (en) * | 2002-12-12 | 2004-06-17 | Electronic Data Systems Corporation | System and method for the rebuild of curve networks in curve-based surface generation using constrained-surface fitting |
| US20060056695A1 (en) * | 2004-09-10 | 2006-03-16 | Min Wu | Method for concealing data in curves of an image |
| US7117026B2 (en) * | 2002-06-12 | 2006-10-03 | Koninklijke Philips Electronics N.V. | Physiological model based non-rigid image registration |
| US7190805B2 (en) * | 2002-04-30 | 2007-03-13 | Hewlett-Packard Development Company, L.P. | Method of and system for edge watermarking of an image |
| US7412360B2 (en) * | 2000-09-19 | 2008-08-12 | Technion Research & Development Foundation Ltd. | Method and apparatus for shape deformation and placement |
| US20080240491A1 (en) * | 2007-01-31 | 2008-10-02 | Olympus Corporation | Instrumentation endoscope apparatus |
| US20090070075A1 (en) * | 2006-03-06 | 2009-03-12 | Fraunhofer-Gesellschaft Zur Forderung Der Angewandten Forschung E.V. | Creation of a Linear or Planar Shape |
| US20090092278A1 (en) * | 2007-01-31 | 2009-04-09 | Olympus Corporation | Endoscope apparatus and program |
-
2005
- 2005-09-09 US US11/221,727 patent/US7817817B2/en not_active Expired - Fee Related
Patent Citations (20)
| Publication number | Priority date | Publication date | Assignee | Title |
|---|---|---|---|---|
| US6058200A (en) * | 1996-05-10 | 2000-05-02 | Blaseio; Gunther | Method of manipulating cephalometric line tracings |
| US6678378B1 (en) * | 1998-06-09 | 2004-01-13 | Monolith Co., Ltd. | 3-dimensional shape data encryption and decryption |
| US6697497B1 (en) * | 1998-12-22 | 2004-02-24 | Novell, Inc. | Boundary identification and characterization through density differencing |
| US20030161498A1 (en) * | 1999-01-13 | 2003-08-28 | Nec Corporation | Digital watermark inserting system and digital watermark characteristic parameter table generating method |
| US6304266B1 (en) * | 1999-06-14 | 2001-10-16 | Schlumberger Technology Corporation | Method and apparatus for volume rendering |
| US6748362B1 (en) * | 1999-09-03 | 2004-06-08 | Thomas W. Meyer | Process, system, and apparatus for embedding data in compressed audio, image video and other media files and the like |
| US6567087B1 (en) * | 2000-03-27 | 2003-05-20 | The United States Of America As Represented By The Secretary Of The Army | Method to create a high resolution database |
| US20010056410A1 (en) * | 2000-06-26 | 2001-12-27 | Kazushi Ishigaki | Electronic commerce system and method |
| US7412360B2 (en) * | 2000-09-19 | 2008-08-12 | Technion Research & Development Foundation Ltd. | Method and apparatus for shape deformation and placement |
| US20040095352A1 (en) * | 2000-11-27 | 2004-05-20 | Ding Huang | Modeling object interactions and facial expressions |
| US6956568B2 (en) * | 2002-01-09 | 2005-10-18 | Massachussetts Institute Of Technology | Shape-intrinsic watermarks for 3-D solids |
| US20030128209A1 (en) * | 2002-01-09 | 2003-07-10 | Massachusetts Institute Of Technology | Shape-intrinsic watermarks for 3-D solids |
| US20040027344A1 (en) * | 2002-03-27 | 2004-02-12 | Sony Corporation | Three-dimensional terrain-information generating system and method, and computer program therefor |
| US7190805B2 (en) * | 2002-04-30 | 2007-03-13 | Hewlett-Packard Development Company, L.P. | Method of and system for edge watermarking of an image |
| US7117026B2 (en) * | 2002-06-12 | 2006-10-03 | Koninklijke Philips Electronics N.V. | Physiological model based non-rigid image registration |
| US20040113910A1 (en) * | 2002-12-12 | 2004-06-17 | Electronic Data Systems Corporation | System and method for the rebuild of curve networks in curve-based surface generation using constrained-surface fitting |
| US20060056695A1 (en) * | 2004-09-10 | 2006-03-16 | Min Wu | Method for concealing data in curves of an image |
| US20090070075A1 (en) * | 2006-03-06 | 2009-03-12 | Fraunhofer-Gesellschaft Zur Forderung Der Angewandten Forschung E.V. | Creation of a Linear or Planar Shape |
| US20080240491A1 (en) * | 2007-01-31 | 2008-10-02 | Olympus Corporation | Instrumentation endoscope apparatus |
| US20090092278A1 (en) * | 2007-01-31 | 2009-04-09 | Olympus Corporation | Endoscope apparatus and program |
Non-Patent Citations (14)
| Title |
|---|
| Barni, M., et al.; "Robust watermarking of cartographic images"; EURASIP J. Applied Signal Process.; vol. 2, 2002, pp. 197-208. |
| Chang, H., et al.; "Watermarking 2D/3D graphics for copyright protection"; in Proc. IEEE ICASSP; 2003, pp. 720-723. |
| Cox, I., et al.; "Secure spread spectrum watermarking for multimedia"; IEEE Trans. Image Process.; vol. 6, No. 12, Dec. 1997, pp. 1673-1687. |
| Jae Jun Lee, Nam Ik Cho, Jong Weon Kim, "Watermarking for 3D NURBS graphic data", Multimedia Signal Processing, 2002 IEEE Workshop on, Dec. 9-11, 2002, pp. 304-307, ISBN: 0-7803-7713-3. * |
| Jae Jun Lee, Nam Ik Cho, Sang Uk Lee, "Watermarking algorithms for 3D NURBS graphic data", EURASIP Journal on Applied Signal Processing, vol. 2004 , (Jan. 2004), pp. 2142-2152, ISSN:1110-8657. * |
| Lee, J., et al.; "Watermarking algorithms for 3D NURBS graphic data"; EURASIP J. Appl. Signal Process.; No. 14, Oct. 2004, pp. 2142-2152. |
| Ohbuchi, R., et al.; "A shape-preserving data embedding algorithm for NURBS curves and surfaces"; in Proc. CGI; 1999, pp. 180-187. |
| Ohbuchi, R., Masuda, H., Aono, M., "A shape-preserving data embedding algorithm for NURBS curves and surfaces", Computer Graphics International, 1999. Proceedings, 1999, pp. 180-187, ISBN: 0-7695-0185-0. * |
| Ohbuchi, R.; et al.; "Watermarking 2D vector maps in the mesh-spectral domain"; Proc. Shape Modeling Int. Conf.; 2003. |
| Praun, E. et al.; "Robust mesh watermarking"; in Proc. Comput. Graphics; 1999, pp. 49-56. |
| Sanchez-Reyes, J., "A simple technique for NURBS shape modification", Computer Graphics and Applications, IEEE, Jan./Feb. 1997, vol. 17, Issue: 1, pp. 52-59, ISSN: 0272-1716. * |
| Solachidis, V., et al.; "Watermarking polygonal lines using Fourier descriptors"; IEEE Computer Graphics Appl.; vol. 24, No. 3, May/Jun. 2004, pp. 44-51. |
| Sole, A., et al.; "Morse description and geometric encoding of Digital Elevation Maps"; IEEE Trans. On Image Processing; vol. 13, No. 9, Sep. 2004, pp. 1245-1262. |
| Xia, M., et al.; "Image registration by 'super-curves'"; IEEE Trans. Image Process.; vol. 13, No. 5, May 2004, pp. 720-732. |
Cited By (16)
| Publication number | Priority date | Publication date | Assignee | Title |
|---|---|---|---|---|
| US20090003667A1 (en) * | 2007-06-27 | 2009-01-01 | National Cheng Kung University | Cephalogram Image Analysis Method |
| US7881515B2 (en) * | 2007-06-27 | 2011-02-01 | National Cheng Kung University | Cephalogram image analysis method |
| US9070044B2 (en) | 2010-06-03 | 2015-06-30 | Adobe Systems Incorporated | Image adjustment |
| US20130129196A1 (en) * | 2010-06-03 | 2013-05-23 | Sylvain Paris | Image Adjustment |
| US20130322739A1 (en) * | 2010-06-03 | 2013-12-05 | Adobe Systems Incorporated | Image Adjustment |
| US8666148B2 (en) * | 2010-06-03 | 2014-03-04 | Adobe Systems Incorporated | Image adjustment |
| US9020243B2 (en) * | 2010-06-03 | 2015-04-28 | Adobe Systems Incorporated | Image adjustment |
| US9128204B2 (en) * | 2011-04-15 | 2015-09-08 | Exxonmobil Upstream Research Company | Shape-based metrics in reservoir characterization |
| US20120261135A1 (en) * | 2011-04-15 | 2012-10-18 | Nowak Ethan J | Shape-Based Metrics In Reservoir Characterization |
| US9008415B2 (en) | 2011-09-02 | 2015-04-14 | Adobe Systems Incorporated | Automatic image adjustment parameter correction |
| US8903169B1 (en) | 2011-09-02 | 2014-12-02 | Adobe Systems Incorporated | Automatic adaptation to image processing pipeline |
| US8787659B2 (en) | 2011-09-02 | 2014-07-22 | Adobe Systems Incorporated | Automatic adaptation to image processing pipeline |
| US9292911B2 (en) | 2011-09-02 | 2016-03-22 | Adobe Systems Incorporated | Automatic image adjustment parameter correction |
| US8731309B1 (en) * | 2013-03-15 | 2014-05-20 | Exelis Inc. | Method and system for processing raster scan images |
| US20150170313A1 (en) * | 2013-12-16 | 2015-06-18 | Thomson Licensing | Method for watermarking a three dimensional object |
| US9721318B2 (en) | 2014-08-29 | 2017-08-01 | Thomson Licensing | Method for watermarking a three dimensional object and method for obtaining a payload from a three dimensional object |
Also Published As
| Publication number | Publication date |
|---|---|
| US20060056695A1 (en) | 2006-03-16 |
Similar Documents
| Publication | Publication Date | Title |
|---|---|---|
| US7817817B2 (en) | Method for concealing data in curves of an image | |
| US20220335561A1 (en) | Embedding signals in a raster image processor | |
| Bas et al. | Geometrically invariant watermarking using feature points | |
| Zheng et al. | A survey of RST invariant image watermarking algorithms | |
| Miller et al. | Informed embedding: exploiting image and detector information during watermark insertion | |
| Niu et al. | A survey of digital vector map watermarking | |
| Simitopoulos et al. | Robust image watermarking based on generalized radon transformations | |
| US6904151B2 (en) | Method for the estimation and recovering of general affine transform | |
| Wang et al. | Reversible fragile watermarking for 2-D vector map authentication with localization | |
| US7158653B2 (en) | Encoding information in a watermark | |
| Doncel et al. | An optimal detector structure for the Fourier descriptors domain watermarking of 2D vector graphics | |
| Hosam | Attacking image watermarking and steganography-a survey | |
| Gou et al. | Data hiding in curves with application to fingerprinting maps | |
| Wang et al. | A high capacity reversible data hiding method for 2D vector maps based on virtual coordinates | |
| KR20010113857A (en) | Rotation, scale, and translation resilient public watermarking for images | |
| Yan et al. | A normalization-based watermarking scheme for 2D vector map data | |
| Kim | Robust Vector Digital Watermarking Using Angles and a Random Table. | |
| Monga et al. | Image authentication under geometric attacks via structure matching | |
| Munib et al. | Robust image watermarking technique using triangular regions and Zernike moments for quantization based embedding | |
| Roy et al. | Watermarking through image geometry change tracking | |
| Keskinarkaus et al. | Image watermarking with feature point based synchronization robust to print–scan attack | |
| Chen et al. | Screen-cam robust and blind watermarking for tile satellite images | |
| Ferreira et al. | A robust 3D point cloud watermarking method based on the graph Fourier transform | |
| Zope-Chaudhari et al. | Copyright protection of vector data using vector watermark | |
| US8934660B2 (en) | Two dimensional information symbol |
Legal Events
| Date | Code | Title | Description |
|---|---|---|---|
| AS | Assignment |
Owner name: MARYLAND, UNIVERSITY OF, MARYLAND Free format text: ASSIGNMENT OF ASSIGNORS INTEREST;ASSIGNORS:WU, MIN;GOU, HONGMEI;REEL/FRAME:016804/0558 Effective date: 20050901 |
|
| STCF | Information on status: patent grant |
Free format text: PATENTED CASE |
|
| FEPP | Fee payment procedure |
Free format text: PATENT HOLDER CLAIMS MICRO ENTITY STATUS, ENTITY STATUS SET TO MICRO (ORIGINAL EVENT CODE: STOM); ENTITY STATUS OF PATENT OWNER: MICROENTITY |
|
| FPAY | Fee payment |
Year of fee payment: 4 |
|
| MAFP | Maintenance fee payment |
Free format text: PAYMENT OF MAINTENANCE FEE, 8TH YEAR, MICRO ENTITY (ORIGINAL EVENT CODE: M3552) Year of fee payment: 8 |
|
| FEPP | Fee payment procedure |
Free format text: MAINTENANCE FEE REMINDER MAILED (ORIGINAL EVENT CODE: REM.); ENTITY STATUS OF PATENT OWNER: MICROENTITY |
|
| LAPS | Lapse for failure to pay maintenance fees |
Free format text: PATENT EXPIRED FOR FAILURE TO PAY MAINTENANCE FEES (ORIGINAL EVENT CODE: EXP.); ENTITY STATUS OF PATENT OWNER: MICROENTITY |
|
| STCH | Information on status: patent discontinuation |
Free format text: PATENT EXPIRED DUE TO NONPAYMENT OF MAINTENANCE FEES UNDER 37 CFR 1.362 |
|
| FP | Lapsed due to failure to pay maintenance fee |
Effective date: 20221019 |