US8095193B2 - Apparatus and method for controlling operation of vehicles or machinery by intoxicated or impaired individuals - Google Patents
Apparatus and method for controlling operation of vehicles or machinery by intoxicated or impaired individuals Download PDFInfo
- Publication number
- US8095193B2 US8095193B2 US11/393,341 US39334106A US8095193B2 US 8095193 B2 US8095193 B2 US 8095193B2 US 39334106 A US39334106 A US 39334106A US 8095193 B2 US8095193 B2 US 8095193B2
- Authority
- US
- United States
- Prior art keywords
- equipment
- subject
- tissue
- concentration
- alcohol
- Prior art date
- Legal status (The legal status is an assumption and is not a legal conclusion. Google has not performed a legal analysis and makes no representation as to the accuracy of the status listed.)
- Active, expires
Links
- 238000000034 method Methods 0.000 title claims abstract description 113
- 230000001771 impaired effect Effects 0.000 title description 7
- LFQSCWFLJHTTHZ-UHFFFAOYSA-N Ethanol Chemical compound CCO LFQSCWFLJHTTHZ-UHFFFAOYSA-N 0.000 claims abstract description 152
- 239000012491 analyte Substances 0.000 claims abstract description 65
- 238000005259 measurement Methods 0.000 claims description 164
- 230000003595 spectral effect Effects 0.000 claims description 82
- 238000004458 analytical method Methods 0.000 claims description 42
- 238000005070 sampling Methods 0.000 claims description 37
- 230000005855 radiation Effects 0.000 claims description 32
- 239000000126 substance Substances 0.000 claims description 29
- 238000005286 illumination Methods 0.000 claims description 22
- 230000005540 biological transmission Effects 0.000 claims description 19
- 230000008859 change Effects 0.000 claims description 17
- 238000004611 spectroscopical analysis Methods 0.000 claims description 17
- 238000000491 multivariate analysis Methods 0.000 claims description 14
- 230000004044 response Effects 0.000 claims description 12
- 230000003993 interaction Effects 0.000 claims description 11
- 238000004891 communication Methods 0.000 claims description 10
- 238000001069 Raman spectroscopy Methods 0.000 claims description 5
- 238000013528 artificial neural network Methods 0.000 claims description 5
- 238000004497 NIR spectroscopy Methods 0.000 claims description 2
- 229940079593 drug Drugs 0.000 claims description 2
- 239000003814 drug Substances 0.000 claims description 2
- 238000010224 classification analysis Methods 0.000 claims 2
- 238000004566 IR spectroscopy Methods 0.000 claims 1
- 238000001506 fluorescence spectroscopy Methods 0.000 claims 1
- 238000012795 verification Methods 0.000 abstract description 23
- 238000001228 spectrum Methods 0.000 description 85
- 210000001519 tissue Anatomy 0.000 description 60
- 239000000835 fiber Substances 0.000 description 31
- 239000008280 blood Substances 0.000 description 22
- 210000004369 blood Anatomy 0.000 description 22
- 230000003287 optical effect Effects 0.000 description 22
- XLYOFNOQVPJJNP-UHFFFAOYSA-N water Substances O XLYOFNOQVPJJNP-UHFFFAOYSA-N 0.000 description 20
- 238000012360 testing method Methods 0.000 description 17
- 230000008901 benefit Effects 0.000 description 14
- 210000003491 skin Anatomy 0.000 description 14
- 150000002632 lipids Chemical class 0.000 description 13
- 201000009032 substance abuse Diseases 0.000 description 13
- 238000012546 transfer Methods 0.000 description 13
- 238000010521 absorption reaction Methods 0.000 description 12
- 238000013459 approach Methods 0.000 description 11
- 230000008569 process Effects 0.000 description 11
- 230000002500 effect on skin Effects 0.000 description 9
- 230000007613 environmental effect Effects 0.000 description 9
- 238000010586 diagram Methods 0.000 description 8
- 230000006870 function Effects 0.000 description 8
- 238000010200 validation analysis Methods 0.000 description 8
- 239000013598 vector Substances 0.000 description 8
- 238000002835 absorbance Methods 0.000 description 7
- 230000000694 effects Effects 0.000 description 7
- 238000007920 subcutaneous administration Methods 0.000 description 7
- 238000001727 in vivo Methods 0.000 description 6
- 206010006326 Breath odour Diseases 0.000 description 5
- 238000001514 detection method Methods 0.000 description 5
- 238000012423 maintenance Methods 0.000 description 5
- 239000000463 material Substances 0.000 description 5
- 102000008186 Collagen Human genes 0.000 description 4
- 108010035532 Collagen Proteins 0.000 description 4
- 230000015572 biosynthetic process Effects 0.000 description 4
- 229920001436 collagen Polymers 0.000 description 4
- 230000006735 deficit Effects 0.000 description 4
- 210000000245 forearm Anatomy 0.000 description 4
- 238000012417 linear regression Methods 0.000 description 4
- 238000011068 loading method Methods 0.000 description 4
- 239000013307 optical fiber Substances 0.000 description 4
- 238000010238 partial least squares regression Methods 0.000 description 4
- 238000000411 transmission spectrum Methods 0.000 description 4
- 238000002604 ultrasonography Methods 0.000 description 4
- QTBSBXVTEAMEQO-UHFFFAOYSA-N Acetic acid Chemical compound CC(O)=O QTBSBXVTEAMEQO-UHFFFAOYSA-N 0.000 description 3
- CSCPPACGZOOCGX-UHFFFAOYSA-N Acetone Chemical compound CC(C)=O CSCPPACGZOOCGX-UHFFFAOYSA-N 0.000 description 3
- WQZGKKKJIJFFOK-GASJEMHNSA-N Glucose Natural products OC[C@H]1OC(O)[C@H](O)[C@@H](O)[C@@H]1O WQZGKKKJIJFFOK-GASJEMHNSA-N 0.000 description 3
- 241000282412 Homo Species 0.000 description 3
- 238000004847 absorption spectroscopy Methods 0.000 description 3
- 238000000862 absorption spectrum Methods 0.000 description 3
- 238000013475 authorization Methods 0.000 description 3
- 239000006227 byproduct Substances 0.000 description 3
- 238000012937 correction Methods 0.000 description 3
- 238000002474 experimental method Methods 0.000 description 3
- 239000008103 glucose Substances 0.000 description 3
- 238000000338 in vitro Methods 0.000 description 3
- 230000000670 limiting effect Effects 0.000 description 3
- 239000000203 mixture Substances 0.000 description 3
- 230000002829 reductive effect Effects 0.000 description 3
- 241000894007 species Species 0.000 description 3
- 238000000342 Monte Carlo simulation Methods 0.000 description 2
- BRUQQQPBMZOVGD-XFKAJCMBSA-N Oxycodone Chemical compound O=C([C@@H]1O2)CC[C@@]3(O)[C@H]4CC5=CC=C(OC)C2=C5[C@@]13CCN4C BRUQQQPBMZOVGD-XFKAJCMBSA-N 0.000 description 2
- 238000003841 Raman measurement Methods 0.000 description 2
- CYQFCXCEBYINGO-UHFFFAOYSA-N THC Natural products C1=C(C)CCC2C(C)(C)OC3=CC(CCCCC)=CC(O)=C3C21 CYQFCXCEBYINGO-UHFFFAOYSA-N 0.000 description 2
- 238000004422 calculation algorithm Methods 0.000 description 2
- ZPUCINDJVBIVPJ-LJISPDSOSA-N cocaine Chemical compound O([C@H]1C[C@@H]2CC[C@@H](N2C)[C@H]1C(=O)OC)C(=O)C1=CC=CC=C1 ZPUCINDJVBIVPJ-LJISPDSOSA-N 0.000 description 2
- 239000000470 constituent Substances 0.000 description 2
- 230000000875 corresponding effect Effects 0.000 description 2
- 238000000354 decomposition reaction Methods 0.000 description 2
- CYQFCXCEBYINGO-IAGOWNOFSA-N delta1-THC Chemical compound C1=C(C)CC[C@H]2C(C)(C)OC3=CC(CCCCC)=CC(O)=C3[C@@H]21 CYQFCXCEBYINGO-IAGOWNOFSA-N 0.000 description 2
- 230000001419 dependent effect Effects 0.000 description 2
- 210000004207 dermis Anatomy 0.000 description 2
- 238000013461 design Methods 0.000 description 2
- 238000011161 development Methods 0.000 description 2
- 238000009826 distribution Methods 0.000 description 2
- 229960004242 dronabinol Drugs 0.000 description 2
- 210000000624 ear auricle Anatomy 0.000 description 2
- 230000005670 electromagnetic radiation Effects 0.000 description 2
- 238000005516 engineering process Methods 0.000 description 2
- 210000002615 epidermis Anatomy 0.000 description 2
- 239000012530 fluid Substances 0.000 description 2
- 230000036571 hydration Effects 0.000 description 2
- 238000006703 hydration reaction Methods 0.000 description 2
- 230000002452 interceptive effect Effects 0.000 description 2
- 210000004072 lung Anatomy 0.000 description 2
- 229960001252 methamphetamine Drugs 0.000 description 2
- MYWUZJCMWCOHBA-VIFPVBQESA-N methamphetamine Chemical compound CN[C@@H](C)CC1=CC=CC=C1 MYWUZJCMWCOHBA-VIFPVBQESA-N 0.000 description 2
- 230000000116 mitigating effect Effects 0.000 description 2
- BQJCRHHNABKAKU-KBQPJGBKSA-N morphine Chemical compound O([C@H]1[C@H](C=C[C@H]23)O)C4=C5[C@@]12CCN(C)[C@@H]3CC5=CC=C4O BQJCRHHNABKAKU-KBQPJGBKSA-N 0.000 description 2
- 206010033675 panniculitis Diseases 0.000 description 2
- 230000036961 partial effect Effects 0.000 description 2
- JTJMJGYZQZDUJJ-UHFFFAOYSA-N phencyclidine Chemical compound C1CCCCN1C1(C=2C=CC=CC=2)CCCCC1 JTJMJGYZQZDUJJ-UHFFFAOYSA-N 0.000 description 2
- 238000000926 separation method Methods 0.000 description 2
- 239000007787 solid Substances 0.000 description 2
- 239000000243 solution Substances 0.000 description 2
- 238000012306 spectroscopic technique Methods 0.000 description 2
- 210000004304 subcutaneous tissue Anatomy 0.000 description 2
- VZGDMQKNWNREIO-UHFFFAOYSA-N tetrachloromethane Chemical compound ClC(Cl)(Cl)Cl VZGDMQKNWNREIO-UHFFFAOYSA-N 0.000 description 2
- 208000007848 Alcoholism Diseases 0.000 description 1
- 238000012935 Averaging Methods 0.000 description 1
- 244000025254 Cannabis sativa Species 0.000 description 1
- 235000012766 Cannabis sativa ssp. sativa var. sativa Nutrition 0.000 description 1
- 235000012765 Cannabis sativa ssp. sativa var. spontanea Nutrition 0.000 description 1
- GVGLGOZIDCSQPN-PVHGPHFFSA-N Heroin Chemical compound O([C@H]1[C@H](C=C[C@H]23)OC(C)=O)C4=C5[C@@]12CCN(C)[C@@H]3CC5=CC=C4OC(C)=O GVGLGOZIDCSQPN-PVHGPHFFSA-N 0.000 description 1
- 238000001237 Raman spectrum Methods 0.000 description 1
- 206010039203 Road traffic accident Diseases 0.000 description 1
- 208000027418 Wounds and injury Diseases 0.000 description 1
- 238000009825 accumulation Methods 0.000 description 1
- IKHGUXGNUITLKF-XPULMUKRSA-N acetaldehyde Chemical compound [14CH]([14CH3])=O IKHGUXGNUITLKF-XPULMUKRSA-N 0.000 description 1
- 230000009471 action Effects 0.000 description 1
- 230000003044 adaptive effect Effects 0.000 description 1
- 230000002730 additional effect Effects 0.000 description 1
- 206010001584 alcohol abuse Diseases 0.000 description 1
- 125000003158 alcohol group Chemical group 0.000 description 1
- 208000025746 alcohol use disease Diseases 0.000 description 1
- 238000000149 argon plasma sintering Methods 0.000 description 1
- 230000003542 behavioural effect Effects 0.000 description 1
- 238000004364 calculation method Methods 0.000 description 1
- 238000012512 characterization method Methods 0.000 description 1
- 238000007621 cluster analysis Methods 0.000 description 1
- 229960003920 cocaine Drugs 0.000 description 1
- 239000013065 commercial product Substances 0.000 description 1
- 238000010276 construction Methods 0.000 description 1
- 238000011109 contamination Methods 0.000 description 1
- 230000001276 controlling effect Effects 0.000 description 1
- 230000002596 correlated effect Effects 0.000 description 1
- 230000008878 coupling Effects 0.000 description 1
- 238000010168 coupling process Methods 0.000 description 1
- 238000005859 coupling reaction Methods 0.000 description 1
- 230000006378 damage Effects 0.000 description 1
- 230000001627 detrimental effect Effects 0.000 description 1
- 229960002069 diamorphine Drugs 0.000 description 1
- 238000010790 dilution Methods 0.000 description 1
- 239000012895 dilution Substances 0.000 description 1
- 238000006073 displacement reaction Methods 0.000 description 1
- 210000003722 extracellular fluid Anatomy 0.000 description 1
- 239000000499 gel Substances 0.000 description 1
- 238000002329 infrared spectrum Methods 0.000 description 1
- 230000002401 inhibitory effect Effects 0.000 description 1
- 208000014674 injury Diseases 0.000 description 1
- 230000031700 light absorption Effects 0.000 description 1
- 239000007788 liquid Substances 0.000 description 1
- 230000000873 masking effect Effects 0.000 description 1
- 239000011159 matrix material Substances 0.000 description 1
- 238000000691 measurement method Methods 0.000 description 1
- 230000004060 metabolic process Effects 0.000 description 1
- 238000012544 monitoring process Methods 0.000 description 1
- 229960005181 morphine Drugs 0.000 description 1
- 238000012627 multivariate algorithm Methods 0.000 description 1
- 230000001151 other effect Effects 0.000 description 1
- 229960002085 oxycodone Drugs 0.000 description 1
- 229940105606 oxycontin Drugs 0.000 description 1
- 238000005192 partition Methods 0.000 description 1
- 229950010883 phencyclidine Drugs 0.000 description 1
- 230000035479 physiological effects, processes and functions Effects 0.000 description 1
- 230000035790 physiological processes and functions Effects 0.000 description 1
- 230000002265 prevention Effects 0.000 description 1
- 238000012545 processing Methods 0.000 description 1
- 239000000047 product Substances 0.000 description 1
- 238000011002 quantification Methods 0.000 description 1
- 238000004445 quantitative analysis Methods 0.000 description 1
- 239000002096 quantum dot Substances 0.000 description 1
- 230000011514 reflex Effects 0.000 description 1
- 238000011160 research Methods 0.000 description 1
- 238000012552 review Methods 0.000 description 1
- 210000003296 saliva Anatomy 0.000 description 1
- 238000012216 screening Methods 0.000 description 1
- 239000004065 semiconductor Substances 0.000 description 1
- 230000035945 sensitivity Effects 0.000 description 1
- 238000004088 simulation Methods 0.000 description 1
- 230000000699 topical effect Effects 0.000 description 1
- 230000007704 transition Effects 0.000 description 1
- WFKWXMTUELFFGS-UHFFFAOYSA-N tungsten Chemical compound [W] WFKWXMTUELFFGS-UHFFFAOYSA-N 0.000 description 1
- 229910052721 tungsten Inorganic materials 0.000 description 1
- 239000010937 tungsten Substances 0.000 description 1
- 238000009827 uniform distribution Methods 0.000 description 1
- 210000002700 urine Anatomy 0.000 description 1
- 238000012418 validation experiment Methods 0.000 description 1
- 230000035899 viability Effects 0.000 description 1
- 230000004304 visual acuity Effects 0.000 description 1
- 230000000007 visual effect Effects 0.000 description 1
- 210000000707 wrist Anatomy 0.000 description 1
Images


Classifications
-
- A—HUMAN NECESSITIES
- A61—MEDICAL OR VETERINARY SCIENCE; HYGIENE
- A61B—DIAGNOSIS; SURGERY; IDENTIFICATION
- A61B5/00—Measuring for diagnostic purposes; Identification of persons
- A61B5/0059—Measuring for diagnostic purposes; Identification of persons using light, e.g. diagnosis by transillumination, diascopy, fluorescence
- A61B5/0071—Measuring for diagnostic purposes; Identification of persons using light, e.g. diagnosis by transillumination, diascopy, fluorescence by measuring fluorescence emission
-
- A—HUMAN NECESSITIES
- A61—MEDICAL OR VETERINARY SCIENCE; HYGIENE
- A61B—DIAGNOSIS; SURGERY; IDENTIFICATION
- A61B5/00—Measuring for diagnostic purposes; Identification of persons
- A61B5/0059—Measuring for diagnostic purposes; Identification of persons using light, e.g. diagnosis by transillumination, diascopy, fluorescence
- A61B5/0075—Measuring for diagnostic purposes; Identification of persons using light, e.g. diagnosis by transillumination, diascopy, fluorescence by spectroscopy, i.e. measuring spectra, e.g. Raman spectroscopy, infrared absorption spectroscopy
-
- A—HUMAN NECESSITIES
- A61—MEDICAL OR VETERINARY SCIENCE; HYGIENE
- A61B—DIAGNOSIS; SURGERY; IDENTIFICATION
- A61B5/00—Measuring for diagnostic purposes; Identification of persons
- A61B5/0059—Measuring for diagnostic purposes; Identification of persons using light, e.g. diagnosis by transillumination, diascopy, fluorescence
- A61B5/0082—Measuring for diagnostic purposes; Identification of persons using light, e.g. diagnosis by transillumination, diascopy, fluorescence adapted for particular medical purposes
- A61B5/0088—Measuring for diagnostic purposes; Identification of persons using light, e.g. diagnosis by transillumination, diascopy, fluorescence adapted for particular medical purposes for oral or dental tissue
-
- A—HUMAN NECESSITIES
- A61—MEDICAL OR VETERINARY SCIENCE; HYGIENE
- A61B—DIAGNOSIS; SURGERY; IDENTIFICATION
- A61B5/00—Measuring for diagnostic purposes; Identification of persons
- A61B5/145—Measuring characteristics of blood in vivo, e.g. gas concentration, pH value; Measuring characteristics of body fluids or tissues, e.g. interstitial fluid, cerebral tissue
- A61B5/14532—Measuring characteristics of blood in vivo, e.g. gas concentration, pH value; Measuring characteristics of body fluids or tissues, e.g. interstitial fluid, cerebral tissue for measuring glucose, e.g. by tissue impedance measurement
-
- A—HUMAN NECESSITIES
- A61—MEDICAL OR VETERINARY SCIENCE; HYGIENE
- A61B—DIAGNOSIS; SURGERY; IDENTIFICATION
- A61B5/00—Measuring for diagnostic purposes; Identification of persons
- A61B5/145—Measuring characteristics of blood in vivo, e.g. gas concentration, pH value; Measuring characteristics of body fluids or tissues, e.g. interstitial fluid, cerebral tissue
- A61B5/14546—Measuring characteristics of blood in vivo, e.g. gas concentration, pH value; Measuring characteristics of body fluids or tissues, e.g. interstitial fluid, cerebral tissue for measuring analytes not otherwise provided for, e.g. ions, cytochromes
-
- G—PHYSICS
- G01—MEASURING; TESTING
- G01J—MEASUREMENT OF INTENSITY, VELOCITY, SPECTRAL CONTENT, POLARISATION, PHASE OR PULSE CHARACTERISTICS OF INFRARED, VISIBLE OR ULTRAVIOLET LIGHT; COLORIMETRY; RADIATION PYROMETRY
- G01J3/00—Spectrometry; Spectrophotometry; Monochromators; Measuring colours
- G01J3/02—Details
- G01J3/0205—Optical elements not provided otherwise, e.g. optical manifolds, diffusers, windows
- G01J3/0218—Optical elements not provided otherwise, e.g. optical manifolds, diffusers, windows using optical fibers
-
- G—PHYSICS
- G01—MEASURING; TESTING
- G01J—MEASUREMENT OF INTENSITY, VELOCITY, SPECTRAL CONTENT, POLARISATION, PHASE OR PULSE CHARACTERISTICS OF INFRARED, VISIBLE OR ULTRAVIOLET LIGHT; COLORIMETRY; RADIATION PYROMETRY
- G01J3/00—Spectrometry; Spectrophotometry; Monochromators; Measuring colours
- G01J3/02—Details
- G01J3/0291—Housings; Spectrometer accessories; Spatial arrangement of elements, e.g. folded path arrangements
-
- G—PHYSICS
- G01—MEASURING; TESTING
- G01N—INVESTIGATING OR ANALYSING MATERIALS BY DETERMINING THEIR CHEMICAL OR PHYSICAL PROPERTIES
- G01N21/00—Investigating or analysing materials by the use of optical means, i.e. using sub-millimetre waves, infrared, visible or ultraviolet light
- G01N21/17—Systems in which incident light is modified in accordance with the properties of the material investigated
- G01N21/25—Colour; Spectral properties, i.e. comparison of effect of material on the light at two or more different wavelengths or wavelength bands
- G01N21/27—Colour; Spectral properties, i.e. comparison of effect of material on the light at two or more different wavelengths or wavelength bands using photo-electric detection ; circuits for computing concentration
- G01N21/274—Calibration, base line adjustment, drift correction
-
- G—PHYSICS
- G01—MEASURING; TESTING
- G01N—INVESTIGATING OR ANALYSING MATERIALS BY DETERMINING THEIR CHEMICAL OR PHYSICAL PROPERTIES
- G01N21/00—Investigating or analysing materials by the use of optical means, i.e. using sub-millimetre waves, infrared, visible or ultraviolet light
- G01N21/17—Systems in which incident light is modified in accordance with the properties of the material investigated
- G01N21/47—Scattering, i.e. diffuse reflection
- G01N21/4738—Diffuse reflection, e.g. also for testing fluids, fibrous materials
- G01N21/474—Details of optical heads therefor, e.g. using optical fibres
-
- A—HUMAN NECESSITIES
- A61—MEDICAL OR VETERINARY SCIENCE; HYGIENE
- A61B—DIAGNOSIS; SURGERY; IDENTIFICATION
- A61B5/00—Measuring for diagnostic purposes; Identification of persons
- A61B5/72—Signal processing specially adapted for physiological signals or for diagnostic purposes
- A61B5/7235—Details of waveform analysis
- A61B5/7264—Classification of physiological signals or data, e.g. using neural networks, statistical classifiers, expert systems or fuzzy systems
-
- G—PHYSICS
- G01—MEASURING; TESTING
- G01N—INVESTIGATING OR ANALYSING MATERIALS BY DETERMINING THEIR CHEMICAL OR PHYSICAL PROPERTIES
- G01N21/00—Investigating or analysing materials by the use of optical means, i.e. using sub-millimetre waves, infrared, visible or ultraviolet light
- G01N21/17—Systems in which incident light is modified in accordance with the properties of the material investigated
- G01N21/25—Colour; Spectral properties, i.e. comparison of effect of material on the light at two or more different wavelengths or wavelength bands
- G01N21/31—Investigating relative effect of material at wavelengths characteristic of specific elements or molecules, e.g. atomic absorption spectrometry
- G01N21/35—Investigating relative effect of material at wavelengths characteristic of specific elements or molecules, e.g. atomic absorption spectrometry using infrared light
- G01N21/359—Investigating relative effect of material at wavelengths characteristic of specific elements or molecules, e.g. atomic absorption spectrometry using infrared light using near infrared light
-
- G—PHYSICS
- G01—MEASURING; TESTING
- G01N—INVESTIGATING OR ANALYSING MATERIALS BY DETERMINING THEIR CHEMICAL OR PHYSICAL PROPERTIES
- G01N2201/00—Features of devices classified in G01N21/00
- G01N2201/12—Circuits of general importance; Signal processing
- G01N2201/129—Using chemometrical methods
Definitions
- the present invention relates to an interlock to prevent vehicle or machinery operation by intoxicated or impaired individuals, and more specifically to an interlock that uses spectroscopic information to measure alcohol and/or one or more substances of abuse and to perform a biometric measurement.
- Alcohol abuse is a national problem that extends into virtually all aspects of society. Over 17,000 people are killed each year in alcohol related traffic accidents due to the detrimental effects of alcohol on motor control and judgment. Given the magnitude of the driving under the influence (DUI) problem, increased attention is being focused on interlocks as a tool to prevent intoxicated individuals from operating motor vehicles and machinery.
- DAI driving under the influence
- biometric devices In order to address these limitations, several combinations of breath and biometric devices have been disclosed in the art.
- the most common biometric methods in interlocks are voice recognition (see U.S. Pat. No. 4,738,333 and U.S. Pat. No. 6,748,301), video recognition (see U.S. Pat. No. 6,748,792 and U.S. Pat. No. 6,956,484), and bodily feature identification (see U.S. Pat. No. 4,996,161).
- voice recognition see U.S. Pat. No. 4,738,333 and U.S. Pat. No. 6,748,301
- video recognition see U.S. Pat. No. 6,748,792 and U.S. Pat. No. 6,956,484
- bodily feature identification see U.S. Pat. No. 4,996,161
- the biometric device relies upon a measurement or action that is distinct from the breath alcohol measurement. Consequently, there is concern over the robustness of the combined measurement methods as well as the potential for the measurement to be defeated by taking advantage
- transdermal alcohol sensors have been disclosed as an alternative to breath and blood alcohol measurements.
- US 2005230175 A1 discloses the use of a transdermal alcohol sensor as part of an ignition interlock to prevent drunk driving.
- transdermal alcohol measurements require contact between the sensor and skin over long periods of time to measure the alcohol present in perspiration as it leaves the body. The long measurement time represents a significant drawback of transdermal measurements for interlock applications.
- the transdermal method has no inherent means for subject identification other than the physical attachment of the sensor to a body part. Thus, there is no integral means to ensure that the driver is the person wearing the device, which implies that transdermal interlocks suffer from many of the same limitations currently associated with breath-based interlocks. Improved methods for integrating alcohol and identification measurements are needed.
- Spectroscopic measurements such as those described by Robinson in U.S. Pat. No. 6,278,889 for glucose measurements, offer promise for completely noninvasive alcohol measurements in people.
- U.S. Pat. No. 5,743,349 titled “Non-invasive optical blood alcohol concentration reader and vehicle ignition interlock system and method”, filed Sep. 23, 1996, since abandoned, Steinberg discloses a vehicle ignition interlock that incorporates a spectroscopic means for noninvasively measuring blood alcohol concentration. Steinberg does not disclose any means for verifying that the spectroscopic measurement is acquired from the prospective driver.
- Steinberg discloses the measurement of electromagnetic radiation in the 250 to 3000 nm wavelength range by introducing radiation to a finger and measuring the light exiting the opposite side of the finger.
- Such transmission approaches while potentially feasible in the visible region (400 to 800 nm), are limited by the strong absorption of water (water is a major component of the tissue) in the near and mid-infrared regions (>800).
- water is a major component of the tissue
- mid-infrared regions >800.
- the absorption of water results in virtually no measurable radiation exiting the opposite side of the sample. Consequently, little if any radiation remains for subsequent measurement of alcohol concentration.
- FIG. 1 is a schematic illustration of an embodiment of such an interlock system.
- a first component is a system 1 that can measure the alcohol concentration of a prospective operator.
- a second component 2 is a system that can verify that the alcohol measurement was obtained from a specific prospective operator rather than another individual.
- a third component 3 is a system that can prevent or control operation of the vehicle or machinery.
- the present invention links the first two components of the disclosed interlock methods via a single spectroscopic measurement, which eliminates the circumvention problems that limit current approaches.
- the discussion herein generally refers to infrared and near-infrared spectroscopic measurements; visible (UV-vis), Raman, and fluorescence spectroscopic measurements are also feasible techniques for the present invention,
- Absorption spectroscopy is a generally known analytical method.
- absorption spectroscopy measures the electromagnetic radiation (typical wavelength range of 0.3-25 ⁇ m) that a substance absorbs at various wavelengths, though other methods measure other effects a substance has on incident light.
- Absorption phenomena can be related to molecular vibrations and shifts in energy levels of individual atoms or electrons within a molecule. These phenomena cause the absorbing molecule or atom to switch to a higher energy state. Absorption occurs most frequently in limited ranges of wavelengths that are based upon the molecular structure of the species present in the measured sample. Thus, for light passing through a substance at several wavelengths, the substance will absorb a greater percentage of photons at certain wavelengths than it will at others.
- the mid-infrared wavelength region i.e., wavelengths between 2.5-6 ⁇ m.
- use of the mid-infrared region can be problematic because molecules with strong absorbance properties (e.g. water) can result in the total absorption of virtually all light introduced to the sample being measured.
- the problem is overcome through the use of shorter wavelengths (typically in the near infrared region of 0.7-2.5 ⁇ m) where weaker overtones and combinations of the mid-infrared vibrations exist.
- the near-infrared region can be employed in such situations as it preserves the qualitative and quantitative properties of mid-infrared measurements while helping to alleviate the problem of total light absorption.
- FIG. 2 Human skin
- the subcutaneous layer is largely comprised of lipids that are typically absent in other tissue layers.
- the dermal layer is composed primarily of water and collagen.
- the spectroscopic measurement of the present invention inherently contains contributions of the analytes within each tissue layer and therefore provides insight into both the chemical composition and the structure of the tissue.
- the complexity of the spectroscopic tissue measurements necessitates application of multivariate models in order to elucidate the property of interest (e.g. alcohol concentration or biometric identification/verification).
- the inherent spectral complexity can be advantageous. Due to natural physiological variation in skin, people have different tissue properties (e.g. dermal hydration, collagen densities, and tissue layer thicknesses).
- the spectroscopic measurement captures the inter-subject differences which enables discrimination between individuals.
- the noninvasive spectroscopic signal of the present invention simultaneously enables both analyte (alcohol or substances of abuse) and biometric measurements thereby providing and integrally linking two of the three components of an effective interlock method.
- the final component of an effective interlock is a means for preventing operation of the machinery or vehicle.
- the majority of existing interlock methods disclosed in the art generally involve disruption of the ignition system of the vehicle.
- a variety of such ignition disruption devices have been disclosed in the art, all of which are suitable for the embodiments described in the present invention.
- other means for preventing operation are also effective.
- an interlock method incorporating a transmission, brake, computer, engine control system, or steering wheel interlock can be equally suitable for preventing operation of the vehicle or machinery.
- such alternatives to ignition interlocks are advantageous as it enables the operation of vehicle accessories (e.g., radio, safety equipment, etc.) without allowing full operation of the vehicle.
- the noninvasive nature of the interlock methods of the present invention enable embodiments that are transparent and non-intrusive to lawful, unimpaired drivers.
- FIG. 1 is a schematic illustration of an interlock system
- FIG. 2 is a diagram of the layered structure of human skin
- FIG. 3 shows the lipid signals obtained from spectroscopic measurements of 31 individuals
- FIG. 4 shows ultrasound images of 6 individuals that demonstrate the difference in tissue structure between people
- FIG. 5 is a diagram showing the inter-subject discriminatory power of the spectroscopic measurement of the present invention.
- FIG. 6 is a schematic depiction of a system according to the present invention.
- FIG. 7 is a schematic depiction of a system according to the present invention.
- FIG. 8 is a schematic depiction of a system that measures a sample in reflectance
- FIG. 9 is a schematic depiction of a system that measures a sample in transmission
- FIG. 10 is a perspective view of elements of an example tissue sampling subsystem
- FIG. 11 is a plan view of the sampling surface of the tissue sampling subsystem, showing an example arrangement of input and output optical fiber ends;
- FIG. 12 is an alternative embodiment of a sampling surface of a tissue sampling subsystem
- FIG. 13 depicts various aspects of a sampler orientation
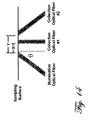
- FIG. 14 is a diagramed view of a two-channel sampling subsystem
- FIG. 15 is a diagram of the net analyte signal (NAS) for a 3 component system
- FIG. 16 is a diagram of the near infrared absorptivity of alcohol before and after tissue pathlength correction
- FIG. 17 is a schematic representation of the hybrid calibration formation process
- FIG. 18 is a diagram of an embodiment of an interlock embodiment known in the art.
- FIG. 19 is a diagram of an embodiment of a complete machinery or vehicle interlock according to the present invention.
- FIG. 20 shows blood, breath, and non-invasive alcohol (obtained from the present invention) over time for two subjects during induced alcohol excursions;
- FIG. 21 is a graph of non-invasive alcohol measurements versus blood alcohol reference for multiple human subjects that demonstrates the ability of the system of the present invention to derive clinically relevant alcohol measurements;
- FIG. 22 shows the biometric verification false acceptance, false rejection, and equal error rates obtained using the spectroscopic method of the present invention in clinical studies.
- Ridder et al. disclose a method for the noninvasive measurement of alcohol based on spectroscopic techniques that provides an alternative to the current blood, breath, urine, saliva, and transdermal methods.
- the device requires passive contact between the noninvasive device and a tissue surface such as a finger, forearm, palm, or earlobe in order to measure the alcohol concentration in the tissue.
- the alcohol measurement described in Ridder typically requires only a short period of time (i.e. 1 minute or less) and thus is suitable for use in vehicle interlocks.
- an advantage of the present invention is that the spectroscopic signal used to measure alcohol concentration, such as that described in Ser. No. 10/852,415, also contains chemical and structural biometric information of the individual being measured as discussed in U.S. Pat. No. 6,628,809 and U.S. Pat. No. 6,560,352.
- the spectroscopic signal inherently contains both alcohol and biometric information, the two measurements are integrally linked, which results in a more robust interlock that is not susceptible to many of the limitations of existing interlock methods.
- the spectroscopic measurement of analytes can also be combined with other identification approaches (e.g., to produce a system that identifies an individual and indicates the presence or concentration of alcohol or a substance of abuse), and with other interlock systems alone (e.g., to prevent operation of an automobile by any intoxicated or drug-using person) or with identification (e.g., to limit operation of equipment to authorized individuals who are not intoxicated).
- other identification approaches e.g., to produce a system that identifies an individual and indicates the presence or concentration of alcohol or a substance of abuse
- other interlock systems alone (e.g., to prevent operation of an automobile by any intoxicated or drug-using person) or with identification (e.g., to limit operation of equipment to authorized individuals who are not intoxicated).
- Another aspect of the present invention is the ability to incorporate the measurement of analytes other than alcohol into the interlock system.
- spectroscopic methods such as those described by Miller et. al. in “Minimally invasive spectroscopic system for intraocular drug detection”, Journal of Biomedical Optics 7(1), 27-33, have been applied to the detection and quantification of substances of abuse.
- the noninvasive spectroscopic measurement described in Ridder will contain the spectroscopic signals of substances of abuse if present within the measured tissue.
- interlock methods based upon the combination of noninvasive spectroscopic measurements of alcohol or substances of abuse with an explicitly linked spectroscopic biometric measurement represents a significant advantage relative to existing interlock methods.
- analyte concentration generally refers to the concentration of an analyte such as alcohol.
- analyte property includes analyte concentration and other properties, such as the presence or absence of the analyte or the direction or rate of change of the analyte concentration, that can be measured in conjunction with or instead of the analyte concentration. While the term “analyte” generally refers to alcohol, other chemicals, particularly substances of abuse and alcohol byproducts, can also benefit from the present invention.
- alcohol byproducts includes the adducts and byproducts of the metabolism of alcohol by the body including, but not limited to, acetone, acetaldehyde, and acetic acid.
- substances of abuse refers to, but is not limited to, THC (Tetrahydrocannabinol or marijuana), cocaine, M-AMP (methamphetamine), OPI (morphine and heroin), OxyContin, Oxycodone, and PCP (phencyclidine).
- THC Tetrahydrocannabinol or marijuana
- cocaine methamphetamine
- OPI morphine and heroin
- OxyContin Oxycodone
- PCP phencyclidine
- subject generally refers to a person from whom a sample measurement was acquired.
- equipment means anything whose operation is desired to be controlled based on the identity, current state (e.g., alcohol concentration), or both, of a prospective operator, including, as examples, vehicles, automobiles, trucks, tractors, airplanes, trains, construction equipment, and machinery.
- the term “dispersive spectrometer” indicates a spectrometer based upon any device, component, or group of components that spatially separate one or more wavelengths of light from other wavelengths. Examples include, but are not limited to spectrometers that use one or more diffraction gratings, prisms, holographic gratings.
- the term “interferometric/modulating spectrometer” indicates a class of spectrometers based upon any device, component, or group of components that either modulate different wavelengths of light to different frequencies in time or selectively transmits or reflects certain wavelengths of light based upon the properties of light interference.
- Examples include, but are not limited to Fourier transform interferometers, Hadamard spectrometers, Sagnac interferometers, mock interferometers, Michelson interferometers, one or more etelons, acousto-optical tunable filters (AOTF's), and one or more LED's or VCSEL's that are scanned or modulated.
- spectrometers based on combinations of dispersive and interferometric/modulating properties, such as those based on lamellar gratings, are also suitable for the present invention.
- the invention makes use of signals, described in some of the examples as absorbance or other spectroscopic measurements.
- Signals can comprise any measurement obtained concerning the spectroscopic measurement of a sample or change in a sample, e.g., absorbance, reflectance, intensity of light returned, fluorescence, transmission, Raman spectra, or various combinations of measurements, at one or more wavelengths.
- Some embodiments make use of one or more models, where such a model can be anything that relates a signal to the desired property.
- models include those derived from multivariate analysis methods such as partial least squares regression (PLS), linear regression, multiple linear regression (MLR), classical least squares regression (CLS), neural networks, discriminant analysis, principal components analysis (PCA), principal components regression (PCR), cluster analysis, and K-nearest neighbors.
- PLS partial least squares regression
- MLR multiple linear regression
- CLS classical least squares regression
- PCA principal components analysis
- PCR principal components regression
- K-nearest neighbors K-nearest neighbors.
- Single or multi-wavelength models based on the Beer-Lambert law are special cases of classical least squares and are thus included in the term multivariate analysis for the purposes of the present invention.
- effective interlock methods for preventing an intoxicated or impaired person from operating machinery or a vehicle are comprised of three essential components.
- the first component is a means for measuring the alcohol (or substance of abuse) concentration in the person and determining if said concentration is above or below a given threshold (e.g. zero if no alcohol is permitted).
- the second component is a means for determining that the desired person (or member of an authorized group of people) is being measured, rather than another individual, and that the person is appropriately complying with the measurement procedure (e.g. no attempts to spoof or fool the measurement).
- the final component of an effective interlock is a means for inhibiting or preventing the operation of the machinery or vehicle if it is determined that the person is intoxicated or impaired.
- Human skin ( FIG. 2 ) is comprised of epidermal, dermal, and subcutaneous layers, each of which has different physiological and chemical characteristics that influence their relative utility for alcohol measurements.
- the epidermis contains very little extracellular fluid, and therefore contains minimal information about hydrophilic analytes such as alcohol.
- the subcutaneous layer is largely comprised of lipids that have low water (and alcohol) solubility which make it poorly suited to alcohol measurements.
- the dermal layer has high water content (generally around 65%) and an extensive capillary bed conducive to the transport of alcohol, which makes it a useful layer of skin tissue for alcohol (or any analyte with high water solubility) measurements.
- the layered structure of the tissue provides a wealth of spectroscopic information that can be used to discriminate between people.
- This biometric signal is a function of many skin properties such as the relative thicknesses of the tissue layers, their scattering coefficients, and the analyte concentrations within each layer.
- the subcutaneous layer is largely comprised of lipids that are typically absent in other tissue layers.
- the dermal layer is composed primarily of water and collagen.
- the spectroscopic measurement contains the relative signal contributions of these analytes and therefore provides insight into both the chemical composition and structure of the tissue.
- the spectroscopic measurement simultaneously captures both analyte signals (e.g. alcohol signal) and the inter-subject differences that collectively form the biometric signal.
- analyte signals e.g. alcohol signal
- FIGS. 3 and 4 combine to provide an example of the inter-subject discriminatory power of the spectroscopic signal.
- FIG. 3 shows the 5500-6000 cm ⁇ 1 region of NIR spectra obtained from 31 subjects.
- the pronounced peaks at 5675 and 5800 cm ⁇ 1 correspond to the spectral signature of lipids, which is an indicator that a portion of the NIR signal originated in the subcutaneous tissue layer for some of the 31 subjects.
- the variation of the lipid signature suggests that the subjects with weaker lipid signal have thicker epidermal and dermal tissue layers, thus preventing the NIR light from reaching the deeper subcutaneous layer where lipids are located.
- FIG. 3 shows the 5500-6000 cm ⁇ 1 region of NIR spectra obtained from 31 subjects.
- the pronounced peaks at 5675 and 5800 cm ⁇ 1 correspond to the spectral signature of lipids, which is an indicator that a portion of the NIR signal originated in the subcutaneous tissue layer for some of the 31 subjects.
- ultrasound images that were obtained from 3 of the 31 subjects who exhibited a strong lipid signal and 3 subjects of the 31 that exhibited no discernable lipid signal.
- a large signal (brighter parts of the image) generally corresponds to a boundary between layers.
- the strong signal near 1 mm of depth in each window of FIG. 3 corresponds to the ultrasound probe-epidermal interface.
- the next region of interest is the dermal-subcutaneous boundary, which generally occurs between 1.5 mm and 2.5 mm of depth.
- Comparison of the two groups demonstrates a marked difference in dermal thickness between the strong and weak lipid signal subjects. Consequently, the magnitude of the lipid signal is of interest because it provides chemical and structural information that can be used to differentiate subjects.
- FIG. 5 is a visual presentation of the inter-subject resolving power of the measurement using 3 extracted properties.
- Each ellipsoid in FIG. 5 encompasses the properties extracted from multiple measurements (typically 10-15) obtained from a single subject. Even with only three properties, the measurements acquired from each subject reside in a distinct region of the 3-dimensional space. This example can be extended to include additional properties and thereby further improve the discriminatory power of the biometric signal.
- the extracted properties can be representative of physical variables (e.g. dermal thickness or scattering coefficient) or purely mathematical (e.g. factors from a principal components analysis, PCA).
- the present invention obtains the first two components of the disclosed interlock methods from a single spectroscopic measurement of tissue (e.g., skin).
- tissue e.g., skin
- spectroscopic measurement devices are described below. These examples should not be construed as limiting to the invention as one skilled in the art recognizes that other embodiments exist that serve substantially the same function.
- Raman measurements and therefore Raman spectrometers are also suitable for the present invention.
- FIG. 6 shows a schematic depiction of a non-invasive measurement device.
- the overall system can be viewed for discussion purposes as comprising six subsystems; those skilled in the art will appreciate other subdivisions of the functionality disclosed.
- the subsystems include an illumination subsystem 100 , a sampling subsystem 200 , a spectrometer subsystem 300 , a data acquisition subsystem 400 , a processing subsystem 500 , and a calibration subsystem 600 .
- the subsystems can be designed and integrated in order to achieve a desirable signal-to-noise ratio and performance.
- FIG. 7 is a schematic depiction of an alternative arrangement of the elements shown in FIG.
- the illumination subsystem 100 generates the near-infrared (NIR) light to interrogate the skin tissue.
- the illumination subsystem contains a broadband, polychromatic light source that emits radiation in the NIR portion of the spectrum.
- the light source can also emit radiation outside of the NIR.
- An example of a suitable light source is a tungsten filament lamp.
- Another example light source is a resistive element such as those commonly used as igniters for furnaces and stoves. These light sources have a lower color temperature than standard filament lamps and are therefore more efficient in the near-infrared spectral region. These sources also have comparatively large emissive surfaces that are less sensitive to spatial effects that are encountered throughout the lifetime of the light source.
- An additional advantage of igniter-based light sources is a substantially longer lifetime when compared to filament lamps.
- Polychromatic sources can also be generated by combining multiple monochromatic or narrow band sources.
- multiple light-emitting diodes (LED's) and/or vertical cavity surface emitting lasers (VCSEL's) can be combined to form a broad-band polychromatic light source.
- Various optical methods can be used to combine the outputs of the various individual light sources into a single beam. Such methods include, but are not limited to, reflective integrating chambers, diffuse integrating chambers, a light homogenizer or light pipe, and optical fibers.
- the output intensities of the discrete light sources can also be independently modulated at predetermined frequencies.
- a monochromatic source is used.
- Solid state or gas lasers are suitable light sources in these embodiments.
- lasers include but are not limited to diode, vertical cavity surface emitting lasers (VCSEL's), NdYg, and HeNe lasers.
- Polychromatic light sources are also feasible if they are sufficiently narrowed using optical filters.
- Other illumination systems that can be suitable with embodiments of the present invention are described by Johnson in U.S. Pat. No. 6,862,091, issued Mar. 1, 2005, by Ridder in U.S. Pat. No. 6,684,099, issued Jan. 27, 2004, and by Maynard in U.S. Pat. No. 6,654,125, issued Nov. 25, 2003, each of which is incorporated herein by reference.
- an area of the sample is selected as the point of analysis for the sampling subsystem 200 .
- this area can include the finger, palms, wrists, earlobe, forearms and any other skin surface.
- the present invention allows use of multiple sites along the area.
- the finger can be measured on both the dorsal and ventral surfaces.
- Embodiments of the sampling subsystem 200 can be such that light is introduced and collected from the sample 250 in either reflectance or transmission geometries (shown in FIGS. 8 and 9 , respectively).
- a preferred embodiment of the sampling subsystem 200 measures the underside of the forearm using reflectance geometry, and will be used to describe various embodiments of the present invention.
- Another advantage of the present invention is that it, unlike fingerprint readers, can use different fingers (or other sites) for enrollment and for subsequent verification.
- This capability provides for increased enrollment efficiency since the user only has to present one enrollment site to the system, but also provides critical flexibility during the use of the device. An example of this flexibility is the case where the user has enrolled a site on a particular hand and that particular site is unavailable for subsequent analysis due to some injury or some severe surface contamination of the site.
- This spectroscopic-based biometric system of the present invention can operate on the site from the other hand without previous enrollment of such site.
- the sampling subsystem 200 introduces radiation generated by the illumination subsystem 100 to the sample and collects portions of the radiation that were not absorbed by the sample and sends that radiation to a spectrometer subsystem 300 for measurement.
- FIGS. 10 through 14 depict elements of preferred embodiments of the sampling subsystem 200 .
- the sampling subsystem 200 has an optical input 202 , a sampling surface 204 which forms an interface 206 that interrogates the sample and an optical output 207 .
- a device that thermostats the sampling subsystem/sample interface is included.
- an index matching fluid can be used to improve the optical interface between the sample and sampling subsystem. See, e.g. U.S. Pat. No.
- the index matching fluid can be considered an interferent that warrants application of a mitigation method as described in co-pending U.S. application Ser. No. 11/305,964.
- the optical input 202 of the sampling subsystem 200 receives radiation from the illumination subsystem 100 (e.g., light exiting a light pipe or other means for coupling light) and transfers that radiation to the interface 206 .
- the optical input can comprise a bundle of optical fibers that are arranged in a geometric pattern that collects an appropriate amount of light from the illumination subsystem.
- the sampling head 216 includes a sampling surface 204 , polished flat to encourage formation of a good interface with the sample and prevent accumulation of interferents on the sampling head surface.
- FIG. 11 depicts one example arrangement.
- the plan view depicts the ends of the input and output fibers in a geometry at the sampling surface including six clusters 208 arranged in a circular pattern.
- Each cluster includes four central output fibers 212 , which collect diffusely reflected light from the sample.
- a cylinder of material 215 Around each grouping of four central output fibers 212 is a cylinder of material 215 , which ensures about a 100 ⁇ m gap between the edges of the central output fibers 212 and the inner ring of input fibers 214 .
- the 100 ⁇ m gap can be important to measuring certain analytes.
- two concentric rings of input fibers 214 can be arranged around the cylinder of material 215 .
- 32 input fibers surround four output fibers.
- FIG. 12 demonstrates an alternative to cluster geometries for the sampling subsystem.
- the illumination and collection fiber optics are arranged in a linear geometry.
- Each row can be either for illumination or light collection and can be of any length suitable to achieve sufficient signal to noise.
- the number of rows can be 2 or more in order to control the physical area covered by the sampling subsystem.
- the total number of potential illumination fibers can depend on the physical size of emissive area of the light source and the diameter of each fiber. Multiple light sources can be used in the illumination subsystem 100 to increase the number of illumination fibers.
- the number of collection fibers can depend on the area of the interface to the spectrometer subsystem 300 .
- a light pipe or other homogenizer followed by an aperture can be used to reduce the size of the output area of the sampling subsystem.
- the light pipe or other homogenizer can encourage that each collection fiber contributes substantially equally to the light that passes through the aperture.
- the sampling subsystem can use one or more channels, where a channel refers to a specific orientation of the illumination and collection fibers.
- An orientation is comprised of the angle of the illumination fiber or fibers, the angle of the collection fiber or fibers, the numerical aperture of the illumination fiber or fibers, the numerical aperture of the collection fiber or fibers, and the separation distance between the illumination and collection fiber or fibers.
- FIG. 13 is a diagram of parameters that form an orientation. Multiple channels can be used in conjunction, either simultaneously or serially, to improve analyte measurements.
- FIG. 14 is a diagram of a two channel sampling subsystem. Each channel provides a measurement of the sample from a different perspective.
- the second perspective can help to provide additional spectroscopic information that helps to decouple the signals due to scattering, absorption, and topical interferents on the skin surface.
- the group of fibers (1 source, 1 receiver # 1 , and 1 receiver # 2 in this example) can be replicated 1 to N times in order to increase the sampler area and improve optical efficiency.
- Each of the fibers can have a different numerical aperture and angle ( ⁇ ).
- the distances between fibers, X and Y, determine the source-receiver separation.
- an additional source channel can be added that creates a 4-channel sampling subsystem.
- the sampling subsystem can use a non-fiber based arrangement that places a pattern of input and output areas on the sample surface.
- the input and output elements of the sampling subsystem can be comprised of a lens system.
- the input element and output element comprise a single lens system that is utilized for both input of light from the energy source and the collection of both specularly and diffusely reflected light from the sample.
- the input element and output element can comprise two lens systems, placed on opposing sides of an analyte-containing sample, wherein light from the energy source is transmitted to the input element and onto the sample, and light transmitted through the analyte-containing sample then passes through the output element to the spectrum analyzer.
- Proper masking of the non-fiber based tissue sampling interface ensures that the input light travels a minimum distance in the tissue and contains valid attribute information.
- the spectrometer subsystem 300 can be comprised of a variety of different technologies and approaches including interferometers (Michelson, mock, Sagnac) and dispersive spectrometers (diffraction gratings, prisms). As demonstrated in FIGS. 6 and 7 , any of these spectrometer types can be placed before or after the sampling subsystem. In some embodiments of the orientation shown in FIG. 7 the illumination 1000 and spectrometer 300 subsystems can be combined. In these embodiments, the combined illumination-spectrometer subsystem's fundamental building blocks are one or more sources of specific wavelengths of light and some means to combine them. One example embodiment comprises multiple, individually addressed, sources (e.g.
- VCSEL Vertical Cavity Emitting Laser
- LEDs Light Emitting Diodes
- the tissue then serves as the means to combine the various wavelengths.
- the light emitted by the individual sources is combined with a dedicated device such as an integrating chamber, light pipe or homogenizer, or a dispersive element (prism or grating). This device combines the multiple sources into a single output beam.
- a single, tunable narrow band source e.g. a vertical cavity surface emitting laser, tunable diode or diode laser
- each source can be modulated in time at a frequency that differs from the other sources in the subsystem.
- the modulation process is easily accomplished with semiconductor light sources that can be rapidly turned on and off at a variety of frequencies.
- the combined beam that contains the various wavelengths that have been uniquely modulated, is equivalent in purpose to the beam that would be obtained from a single broadband source that is subsequently modulated or dispersed by a dedicated spectrometer subsystem.
- the combined beam is then introduced to the tissue sampling subsystem and ultimately the detector in the data acquisition subsystem.
- the data acquisition subsystem then decodes the signal into its individual wavelength components via an appropriate technique such as a Fourier or Hadamard transform.
- Beer-Lambert law is commonly invoked in absorption spectroscopy to elucidate the relationship between the measured signal and the property of interest (alcohol concentration).
- a ⁇ is the absorption of the sample at wavelength ⁇
- ⁇ ⁇ is the absorptivity of the single analyte in the sample at wavelength ⁇
- l is the pathlength that the light travels through the sample
- c is the concentration of the analyte.
- Spectral measurements of complex media can be comprised of many overlapping spectral signatures from a large number of chemical analytes. While feasible in some situations depending on the measurement objectives, the Beer-Lambert/CLS class of approaches can be difficult to implement due to the large number of variables. In such cases, alternative multivariate analysis methods can be used to decouple the signal of the analyte of interest from the signals of other analytes in the system (interferents). Partial Least Squares (PLS) regression is a well established multivariate analysis method that has been applied quantitative analysis of spectroscopic measurements and will be used for demonstrative purposes for the remainder of the disclosure. However, other multivariate analysis methods such as Principal Components Regression (PCR), Ridge Regression, Multiple Linear Regression (MLR) and Neural Networks are equally suitable for the present invention. One skilled in the art will recognize that other methods of similar functionality are also applicable.
- PCR Principal Components Regression
- MLR Multiple Linear Regression
- Neural Networks are equally suitable for the
- a set of spectroscopic calibration measurements is acquired where each has a corresponding reference value for the property of interest (e.g. blood alcohol concentration).
- the calibration spectral data are then decomposed into a series of factors (spectral shapes that are sometimes called loading vectors or latent variables) and scores (the magnitude of the projection of each spectrum onto a given factor) such that the squared covariance between the reference values and the scores on each successive PLS loading vector is maximized.
- the scores of the calibration spectra are then regressed onto the reference values in a multiple linear regression (MLR) step in order to calculate a set of spectral weights (one weight per wavenumber in the spectra) that minimizes the analyte measurement error of the calibration measurements in a least-squares sense. These spectral weights are called the regression vector of the calibration model.
- the goal of the multivariate calibration (PLS or otherwise) in the present invention is to determine the part of the spectroscopic signal of alcohol that is effectively orthogonal (contravariant) to the spectra of all interferents in the sample.
- This part of the signal is referred to as the net attribute signal and can be calculated using the regression vector (b) described above using equation 4. If there are no interfering species, the net attribute spectrum is equal to the pure spectrum of alcohol. If interfering species with similar spectra to the attribute are present, the net attribute signal will be reduced relative to the entire spectrum.
- the concept of net attribute signal for a three-analyte system is depicted graphically in FIG. 15 .
- NAS b ⁇ ⁇ b ⁇ ⁇ 2 2 ( eq . ⁇ 4 )
- a hybrid calibration model can be used to measure the alcohol concentrations of subject spectra.
- the term hybrid model denotes that a partial least squares (PLS) calibration model was developed using a combination of in vitro and in vivo spectral data.
- the in vitro portion of the data can comprise a 0.1 mm pathlength transmission spectrum of 500 mg/dL alcohol in water measured using a non-invasive measurement system configured for transmission measurements.
- the transmission spectrum can be ratioed to a 0.1 mm pathlength transmission spectrum of water, converted to absorbance, and normalized to unit pathlength and concentration.
- v wavenumber
- l i the pathlength traversed by the i th ray in the Monte Carlo simulation [mm]
- N the total number of rays in the simulation
- ⁇ a the (wavenumber-dependent) absorption coefficient [mm ⁇ 1 ]. Due to its large absorption in vivo, water is the only analyte that has a significant effect on the effective pathlength. Therefore, for the purposes of the effective pathlength calculation, the absorption coefficients used were those of water at physiological concentrations.
- the alcohol absorbance spectrum (as measured in transmission) was then scaled by the computed path function to form a corrected alcohol spectrum representative of the wavenumber dependent pathlength measured by the diffuse reflectance optical sampler.
- FIG. 16 shows the alcohol absorbance spectrum before and after correction by the path function. This corrected spectrum formed the base spectrum for the mathematical addition of alcohol to the calibration spectra.
- the in vivo data comprised noninvasive tissue spectra collected from persons who had not consumed alcohol.
- a hybrid model was formed by adding the alcohol pure component spectrum, weighted by various alcohol “concentrations” (ranging from 0 to 160 mg/dL), to the noninvasive tissue spectral data.
- the PLS calibration model was built by regressing the synthetic alcohol concentrations on the hybrid spectral data.
- FIG. 17 is a schematic representation of the hybrid calibration formation process.
- the hybrid calibration in this work used approximately 1500 non-invasive tissue spectra that were collected from 133 subjects over three months.
- hybrid calibration models rather than calibration models built from spectra acquired from subjects who have consumed alcohol, can provide advantages.
- the hybrid modeling process makes it possible to generate calibration spectra that contain higher concentrations (up to 160 mg/dL in one example) of alcohol than would be considered safe for consumption in a human subject study (120 mg/dL is generally considered a safe upper limit).
- the result can be a stronger calibration with a wider range of analyte concentrations that is able to more accurately measure higher alcohol concentrations. This can be important because alcohol concentrations observed in the field can be more than double the maximum safe dosage in a clinical research setting.
- the hybrid calibration process also allows the prevention of correlations between alcohol and the spectral interferents naturally or artificially present in or on the surface of the tissue, thus generating a regression vector with a larger net attribute signal.
- the random addition of alcohol signal to the calibration spectra prevents alcohol concentration from being correlated with water concentration.
- the hybrid approach reduces the possibility that the measurement could spuriously track changes in tissue water content instead of alcohol concentration.
- biometric enrollment information is acquired from each person who is authorized to use a given piece of machinery or vehicle.
- the enrollment measurements can also be used to improve the accuracy and precision of the alcohol or substance of abuse measurement.
- the calibration spectra are mean-centered by subject (all spectra from a subject are located, the mean of those spectra is subtracted from each, and the “mean centered” spectra are returned to the spectral set). In this manner, the majority of inter-subject spectral differences caused by variations in physiology are removed from the calibration measurements and the range of spectral interferents correspondingly reduced.
- the centered spectra and associated analyte reference values are then presented to a multivariate analysis method such as partial least squares regression. This process is referred to as generating an “enrolled”, “generic”, or “tailored” calibration. Additional details on this approach are described in U.S. Pat. No. 6,157,041, entitled “Methods and Apparatus for Tailoring Spectroscopic Calibration Models,” the disclosure of which is incorporated by reference.
- the enrollment spectrum can be subtracted from subsequent measurements prior to determining the alcohol or substance of abuse concentration using the generic calibration model. Similar to the mean-centering by subject operation of the calibration spectra, the subtraction of the enrollment spectrum removes the average spectroscopic signature of the subject while preserving the signal of the analyte of interest (alcohol or substance of abuse). In some embodiments, significant performance advantages can be realized relative to the use of a non-generic calibration method.
- a calibration (generic or otherwise) should remain stable and produce accurate attribute predictions over a desired period of time.
- This process is referred to as calibration maintenance and can comprise multiple methods that can be used individually or in conjunction.
- the first method is to create the calibration in a manner that inherently makes it robust.
- Several different types of instrumental and environmental variation can affect the measurement capability of a calibration model. It is possible and desirable to reduce the magnitude of the effect of instrumental and environmental variation by incorporating this variation into the calibration model.
- the sample can be incorporated into the optical path of the instrument or interface with the sampling subsystem in a manner similar to that of tissue measurements.
- the sample can be used in transmission or in reflectance and can contain stable spectral features or contribute no spectral features of its own.
- the material can be a solid, liquid, or gel material as long as its spectrum is stable or predicable over time. Any unexplained change in the spectra acquired from the sample over time indicate that the instrument has undergone a perturbation or drift due to environmental effects. The spectral change can then be used to correct subsequent tissue measurements in humans in order to ensure and accurate attribute measurement.
- calibration transfer prevents the need for a calibration to be built on each system that is manufactured. This represents a significant time and cost savings that could result in the difference between success or failure of a commercial product.
- Calibration transfer arises from the fact that optical and electronic components vary from unit to unit which, in aggregate, results in differences in the spectra obtained from multiple instruments. For example, two light sources can have different color temperatures thereby resulting in a different light distribution for the two sources. The responsivity of two detectors can also differ significantly, which can result in additional spectral differences.
- the first method is to build the calibration with multiple instruments.
- the presence of multiple instruments allows the spectral variation associated with instrument differences to be determined and made effectively orthogonal to the attribute signal during the calibration formation process. While this does approach reduces the net attribute signal, it can be an effective means of calibration transfer.
- Additional calibration transfer methods involve explicitly determining the difference in the spectral signature of a system relative to those used to build the calibration. In this case, the spectral difference can then be used to correct a spectral measurement prior to attribute prediction on a system or it can be used to correct the predicted attribute value directly.
- the spectral signature specific to an instrument can be determined from the relative difference in spectra of a stable sample acquired from the system of interest and those used to build the calibration.
- Many suitable approaches and algorithms for effective calibration transfer are known in the art; some of which are summarized in “Standardisation and Calibration Transfer for Near Infrared Instruments: a Review”, by Tom Fearn in the Journal of Near Infrared Spectroscopy, vol. 8, pp. 229-244 (2001).
- Biometric identification describes the process of using one or more physical or behavioral features to identify a person or other biological entity. There are two common biometric modes: identification and verification. Biometric identification attempts to answer the question of, “do I know you?” The biometric measurement device collects a set of biometric data from a target individual. From this information alone it assesses whether the person was previously enrolled in the biometric system. Systems that perform the biometric identification task, such as the FBI's Automatic Fingerprint Identification System (AFIS), are generally very expensive (several million dollars or more) and require many minutes to detect a match between an unknown sample and a large database containing hundreds of thousands or millions of entries.
- AFIS Automatic Fingerprint Identification System
- biometric verification the relevant question is, “are you who you say you are?” This mode is used in cases where an individual makes a claim of identity using a code, magnetic card, or other means, and the device uses the biometric data to confirm the identity of the person by comparing the target biometric data with the enrolled data that corresponds with the purported identity.
- Interlock methods for preventing operation of machinery or vehicles by intoxicated or impaired persons can use either biometric mode.
- the calibration data are used to establish spectral features that are important for biometric determinations.
- This set of data consists of series of spectroscopic tissue measurements that are collected from an individual or individuals of known identity. Preferably, these data are collected over a period of time and a set of conditions such that multiple spectra are collected on each individual while they span nearly the full range of physiological states that a person is expected to go through.
- the instrument or instruments used for spectral collection generally should also span the full range of instrumental and environmental effects that it or sister instruments are likely to see in actual use.
- These calibration data are then analyzed in such a way as to establish spectral wavelengths or “factors” (i.e.
- wavelengths or spectral shapes that are sensitive to between-person spectral differences while minimizing sensitivity to within-person, instrumental (both within- and between-instruments), and environmental effects. These wavelengths or factors are then used subsequently to perform the biometric determination tasks.
- the second major set of spectral data used for biometric determinations is the enrollment spectral data.
- the purpose of the enrollment spectra for a given subject or individual is to generate a “representation” of that subject's unique spectroscopic characteristics.
- Enrollment spectra are collected from individuals who are authorized or otherwise required to be recognized by the biometric system. Each enrollment spectrum can be collected over a period of seconds or minutes. Two or more enrollment measurements can be collected from the individual to ensure similarity between the measurements and rule out one or more measurements if artifacts are detected. If one or more measurements are discarded, additional enrollment spectra can be collected.
- the enrollment measurements for a given subject can be averaged together, otherwise combined, or stored separately. In any case, the data are stored in an enrollment database.
- each set of enrollment data are linked with an identifier (e.g. a password or key code) for the persons on whom the spectra were measured.
- the identifier can be used for record keeping purposes of who accessed the biometric system at which times.
- the identifier is used to extract the proper set of enrollment data against which verification is performed.
- the third and final major set of data used for the biometric system is the spectral data collected when a person attempts to use the biometric system for identification or verification. These data are referred to as target spectra. They are compared to the measurements stored in the enrollment database (or subset of the database in the case of identity verification) using the classification wavelengths or factors obtained from the calibration set. In the case of biometric identification, the system compares the target spectrum to all of the enrollment spectra and reports a match if one or more of the enrolled individual's data is sufficiently similar to the target spectrum. If more than one enrolled individual matches the target, then either all of the matching individuals can be reported, or the best match can be reported as the identified person.
- the target spectrum is accompanied by an asserted identity that is collected using a magnetic card, a typed user name or identifier, a transponder, a signal from another biometric system, or other means.
- the asserted identity is then used to retrieve the corresponding set of spectral data from the enrollment database, against which the biometric similarity determination is made and the identity verified or denied. If the similarity is inadequate, then the biometric determination is cancelled and a new target measurement may be attempted.
- principle component analysis is applied to the calibration data to generate spectral factors. These factors are then applied to the spectral difference taken between a target spectrum and an enrollment spectrum to generate Mahalanobis distance and spectral residual magnitude values as similarity metrics. Identify is verified only if the aforementioned distance and magnitude are less than a predetermined threshold set for each. Similarly, in a preferred method for biometric identification, the Mahalanobis distance and spectral residual magnitude are calculated for the target spectrum relative each of the database spectra. The identify of the person providing the test spectrum is established as the person or persons associated with the database measurement that gave the smallest Mahalanobis distance and spectral residual magnitude that is less than a predetermined threshold set for each.
- the identification or verification task is implemented when a person seeks to perform an operation for which there are a limited number of people authorized (e.g., perform a spectroscopic measurement, achieve control over an interlocked vehicle or piece of machinery, pass through an immigration checkpoint, etc.).
- the person's spectral data is used for identification or verification of the person's identity.
- the person initially enrolls in the system by collecting one or more representative tissue spectra. If two or more spectra are collected during the enrollment, then these spectra be checked for consistency and recorded only if they are sufficiently similar, limiting the possibility of a sample artifact corrupting the enrollment data.
- an identifier such as a PIN code, magnetic card number, username, badge, voice pattern, other biometric, or some other identifier can also be collected and associated with the confirmed enrollment spectrum or spectra.
- biometric identification would take place by collecting a spectrum from a person attempting to gain authorization. This spectrum would then be compared to the spectra in the enrolled authorization database and an identification made if the match to an authorized database entry was better than a predetermined threshold.
- the verification task is similar, but would require that the person present the identifier in addition to a collected spectrum. The identifier would then be used to select a particular enrollment database spectrum and authorization would be granted if the current spectrum was sufficiently similar to the selected enrollment spectrum. If the biometric task is associated with an operation for which only a single person is authorized, then the verification task and identification task are the same and both simplify to an assurance that the sole authorized individual is attempting the operation without the need for a separate identifier.
- the biometric measurement can be performed in a variety of ways including linear discriminant analysis, quadratic discriminant analysis, K-nearest neighbors, neural networks, and other multivariate analysis techniques or classification techniques. Some of these methods rely upon establishing the underlying spectral shapes (factors, loading vectors, eigenvectors, latent variables, etc.) in the intra-person calibration database, and then using standard outlier methodologies (spectral F ratios, Mahalanobis distances, Euclidean distances, etc.) to determine the consistency of an incoming measurement with the enrollment database.
- the underlying spectral shapes can be generated by multiple means as disclosed herein.
- the underlying spectral shapes can be generated based upon simple spectral decompositions (eigen analysis, Fourier analysis, etc.) of the calibration data.
- the second method of generating underlying spectral shapes relates to the development of a generic model as described in U.S. Pat. No. 6,157,041, entitled “Methods and Apparatus for Tailoring Spectroscopic Calibration Models,” the disclosure of which is incorporated by reference.
- the underlying spectral shapes are generated through a calibration procedure performed on intra-person spectral features.
- the underlying spectral shapes can be generated by the development of a calibration based upon simulated constituent variation.
- the simulated constituent variation can model the variation introduced by real physiological or environmental or instrumental variation or can be simply be an artificial spectroscopic variation. It is recognized that other means of determining underlying shapes would be applicable to the identification and verification methods of the present invention. These methods can be used either in conjunction with, or in lieu of the aforementioned techniques.
- the final component of an effective machinery or vehicle interlock is a means for preventing or controlling its operation.
- the ignition system is widely recognized as a feasible means for preventing the starting of the motor.
- other types of interlocks can also be suitable, and might be advantageous in some situations.
- a transmission interlock would allow the motor to be started and accessories (e.g. the radio, phone) to be used while the operator finds other means of travel.
- Brake, steering wheel, engine control system, or computer locks are also potential means for preventing operation.
- the signal required to enable or disable the vehicle or machinery can be wireless or wired as deemed appropriate for the application.
- wireless communication can also be used to report the measurement results of the interlock or the operational status of the interlock device to monitoring or law enforcement facilities.
- wireless communication can also be used to report the measurement results of the interlock or the operational status of the interlock device to monitoring or law enforcement facilities.
- the present invention allows many types of control of the operation of equipment.
- Specific modes of operation e.g., ignition disable, transmission disable, accessory enable, event reporting
- analyte property e.g., alcohol concentration
- identity characteristic e.g., some operators may have access to limited operation, event reporting might require specific individual identification
- any specification of such equipment control is termed an “equipment operation parameter.”
- the alcohol interlock device of the present invention can be configured to allow the car to start prior to alcohol or biometric determinations, or independently of one or both determinations.
- the interlock device can then disable driving operation via control of the vehicle's transmission, braking system, or other suitable secondary methods.
- This scheme also allows for interlock systems which require significant system power during operation. It is recognized that some of the proposed instrumentation systems may require high power light sources and/or reasonably lengthy operation periods prior to completing a driver's biometric authentication and alcohol test. By configuring the invention to operate after a vehicle has been started, significantly more system power is available to enable the use of more sophisticated and higher power instrumentation.
- FIGS. 18 and 19 compare a breath alcohol based interlock system for motor vehicles known in the art and an embodiment of the present invention.
- FIG. 18 shows the breath-based interlock which is suitable only for the detection of impairment caused by alcohol and requires a separate measurement to verify the identity of the vehicle operator. These two separate measurements are susceptible to multiple failure modes, and can allow a sober person to perform the alcohol test while an impaired person performs the identity test, allowing either a sober, unauthorized person or an impaired but otherwise authorized person to operate the vehicle.
- FIG. 19 shows an embodiment of the present invention where a single spectroscopic measurement is used to determine impairment and verify identity of the operator, thus providing a significant advantage relative to existing interlock methods.
- the spectroscopic measurement of the present invention is suitable to detect impairment caused by alcohol and/or substances of abuse which significantly increases the utility of the present invention.
- a “smartkey” which can comprise an electronic storage and communication device can be able to store, encrypt, and securely communicate data to the alcohol interlock system.
- Such a smartkey can enable physical access control to a vehicle by utilizing a digital two key authentication scheme.
- the first key can be an authorized electronic access code which is specific to a vehicle or group of vehicles that the user is authorized to drive.
- the second key can be linked to the user's enrollment data which can require that only the authorized driver(s) be able to use that key.
- the system can use existing technology which has been developed for secure encryption, data transmission, and authentication transactions using smart cards/tokens.
- a driver may be required to frequently switch vehicles (fleet shipping, school bus drivers, etc.) the use of a smartkey to store biometric data allows centralized administration of both vehicle-specific and driver-specific security and alcohol policies.
- a driver can be enrolled in the administrator's office on a master interlock device and the resulting enrollment information and driver-specific security policy can be encoded on the driver's key. The driver is then able to perform alcohol and biometric measurements on all vehicles in the fleet, even if that driver had never before used that specific vehicle.
- Centralized administration tasks e.g.
- Security policy updates can be relayed to the fleet's vehicles via RF uplinks or other electronic transmission means.
- RF communication Through the use of RF communication, a driver's smartkey can provide rapid, seamless access to the vehicle via the touch based biometric verification step. No access codes need be required by the driver
- a driver's enrollment measurement can become out of date on a vehicle that they seldom use.
- the driver can always maintain the most current enrollment information.
- Profile updates can be handled via two-way communication with the driver's smartkey upon successful biometric identity verification by a vehicle's alcohol interlock system.
- concerns regarding the theft, manipulation, or dissemination of a driver's biometric identity information can be reduced since only a single copy of that data exists, in a secure, encrypted format, under physical control of the driver.
- Some embodiments for remotely storing enrollment data are comprise a means for storing data, a means for providing power, a means for communication and data transfer.
- the means for storing data can be any electronic or magnetic storage media consistent with the form factor desired.
- Some example embodiments of the means for providing power include, but are not limited to, a battery or external RF power via the communication uplink.
- Some example embodiments of the means for communication and data transfer include, but are not limited to, serial or other secure data protocol via RF, optical, sonic, or direct electrical connections. These components can be combined in a wide variety of possible form factors. Some examples include car key, plastic transponder, credit card style smart card, employee id badge, lapel pin, etc.
- the in vitro portion of the data was a 1.0 mm pathlength spectrum of 501.65 mg/dL alcohol in water measured in transmission.
- the spectrum was ratioed to a 1.0 mm pathlength transmission spectrum of carbon tetrachloride and converted to absorbance.
- the contribution of water to the 501.65 mg/dL alcohol spectrum was removed by subtracting an absorbance spectrum of pure water scaled to the appropriate concentration to account for the displacement effects of alcohol.
- the in vivo calibration data consisted of noninvasive tissue spectra collected from individuals who had not consumed alcohol.
- the hybrid model spectra were formed by adding the alcohol pure component spectrum at various simulated alcohol “concentrations” according to the schematic process shown in FIG. 17 .
- the concentration for each simulated spectrum was simply drawn randomly from a uniform distribution spanning the expected range of alcohol concentrations in vivo (0 to 160 mg/dL). Each spectrum was treated as completely independent of all others, so no inter- or intra-subject differences or time dependencies were incorporated in the concentration assignments.
- a partial least squares (PLS) calibration model was built by regressing the synthetic alcohol concentrations on the hybrid calibration spectral data.
- the hybrid calibration contained approximately 1500 noninvasive NIR measurements collected from 133 subjects over three months.
- the second study was a prospective validation experiment where ten volunteer subjects were measured in a clinical laboratory over a period of 5 days to assess the noninvasive alcohol measurement accuracy relative to blood and breath alcohol measurements. None of these ten subjects participated in the calibration experiment, so they represented an objective and prospective assessment of the noninvasive NIR measurement performance. Subjects were consented according to an IRB-approved protocol. Alcohol doses were administered to achieve peak blood alcohol concentration (BAC) values of 120 mg/dL (0.12%) assuming ingested alcohol would be completely absorbed into the bloodstream. The subjects were asked to consume the total alcohol dose within a 20-minute time period.
- BAC peak blood alcohol concentration
- Baseline capillary blood, breath, and noninvasive alcohol measurements were acquired from each subject upon arrival in order to verify zero initial blood alcohol concentration.
- the blood measurements were acquired using a Yellow Springs Incorporated 2700 Select blood analyzer (YSI). Breath testing was accomplished using an Intoximeters EC/IR in “quick test” mode. Each subject then consumed his or her alcohol dose. Repeated cycles of blood, breath, and noninvasive measurements were then acquired to monitor alcohol concentration throughout each subject's alcohol excursion (about 10-12 minutes per cycle). A total of 372 sets of noninvasive, blood, and breath alcohol measurements were acquired from the 10 subjects in the validation study.
- FIG. 20 depicts the alcohol measurements acquired from two of the 10 validation subjects during their induced alcohol excursions. Each window contains the blood, breath, and noninvasive alcohol concentrations versus time that were measured during the alcohol excursion for that subject.
- FIG. 21 shows a side-by-side comparison of the noninvasive spectroscopic alcohol measurements of the present invention versus blood (BAC) alcohol and breath (BrAC) versus blood (BAC) alcohol that were acquired from the 10 study subjects. Examination of FIG. 19 demonstrates that the breath measurements exhibit a proportional error relative to blood alcohol. This is due to the globally applied blood-breath partition coefficient of 2100 mg EtOH/dL blood per mg EtOH/dL air that relates the concentration of alcohol in expired air from the lungs to blood alcohol.
- the calibration spectra were processed to produce generic data as described in U.S. Pat. No. 6,157,041, entitled “Methods and Apparatus for Tailoring Spectroscopic Calibration Models,” incorporated herein by reference.
- a PCA decomposition of these data was performed to generate 50 factors (also called latent variables, loadings, or eigenvectors) and associated scores (also called weights or eigenvalues).
- the validation measurements were then split into enrollment and test sets.
- the enrollment set was comprised of 37 spectra that were obtained by averaging the first three measurements acquired from each of the 37 validation subjects.
- the test set was comprised of the remaining validation spectra.
- the enrollment spectrum of each subject was subtracted from his or her spectra in the test set.
- the Mahalanobis distances of the resulting “authorized” spectral differences were then calculated using the calibration factors and scores.
- the enrollment spectrum for a given subject was subtracted from the test spectra for the other 36 validation subjects. This was done for each validation subject in round-robin fashion in order to test all possible enrollment/test permutations. Similar to the “authorized” case, the Mahalanobis distance for each of the resulting “intruder” difference spectra was computed relative to the calibration factors and scores.
- the “authorized” and “intruder” Mahalanobis distances were then used to examine the biometric performance of the spectroscopic method using multiple distance thresholds.
- the threshold distance if the distance of a given spectral difference (whether from the “authorized” or “intruder” group) is less than the threshold distance, then the purported identity is verified.
- the case where an “authorized” spectral difference is below the threshold (and the identity verified) is referred to as a “True Accept” (also called a True Positive or True Admission).
- the case where an “authorized” spectral difference is above the threshold is referred to as a “False Reject” or “False Negative”.
- a “True Reject” or “True Negative” occurs when an “intruder” distance is above the threshold and a “False Accept” occurs when an “intruder” distance is below the threshold.
- the overall performance of a technique can be compactly summarized at a given threshold by calculating the “false acceptance rate” and the “false rejection rate”.
- the false acceptance rate is the percentage of measurements acquired from intruders that are erroneously flagged as authorized.
- the false rejection rate is the percentage of measurements acquired from authorized persons that are erroneously flagged as intruders.
- the threshold is a tunable variable that can be used to influence the relative security of the biometric measurement. For example, the threshold can be set to a low value (high security) that will minimize the false acceptance rate at the expense of an increase in the false rejection rate. Likewise, a low security setting would correspond to a high threshold value.
- FIG. 22 shows the false acceptance and false rejection rates at a variety of thresholds for the test data discussed above.
- the “equal error rate” occurs when the false acceptance and rejection rates are equal and is a common metric often used to compare biometric performance across techniques.
- the equal error rate for these data is approximately 0.7% demonstrating a high degree of biometric capability over an extended period of time.
- noninvasive alcohol and biometric identity verification is also useful in applications other than vehicle and ignition interlocks.
- similar alcohol and identity measurements are important in workplace alcohol screening, entry to secure/sensitive facilities where impairment represents a safety hazard, entry to safety sensitive work areas, entry to or presence in facilities such as prisons and jails where alcohol abstinence is required, community corrections, probation, and parole activities where alcohol abstinence is required, and alcohol treatment centers where alcohol abstinence is required.
Abstract
Description
A λ=ελ lc (eq. 1)
A λ1=εαλ1 lc α+εβλ1 lc β
and
A λ2=εαλ2 lc α+εβλ2 lc β (eqs. 2 and 3)
Claims (47)
Priority Applications (2)
| Application Number | Priority Date | Filing Date | Title |
|---|---|---|---|
| US11/393,341 US8095193B2 (en) | 2001-04-11 | 2006-03-30 | Apparatus and method for controlling operation of vehicles or machinery by intoxicated or impaired individuals |
| US13/314,703 US20120078473A1 (en) | 2004-05-24 | 2011-12-08 | Apparatus and Method for Controlling Operation of Vehicles or Machinery by Intoxicated or Impaired Individuals |
Applications Claiming Priority (7)
| Application Number | Priority Date | Filing Date | Title |
|---|---|---|---|
| US09/832,585 US6574490B2 (en) | 2001-04-11 | 2001-04-11 | System for non-invasive measurement of glucose in humans |
| US10/281,576 US7202091B2 (en) | 2001-04-11 | 2002-10-28 | Optically similar reference samples |
| US10/378,237 US6865408B1 (en) | 2001-04-11 | 2003-03-03 | System for non-invasive measurement of glucose in humans |
| US10/753,506 US7016713B2 (en) | 1995-08-09 | 2004-01-08 | Non-invasive determination of direction and rate of change of an analyte |
| US10/852,415 US7403804B2 (en) | 2001-04-11 | 2004-05-24 | Noninvasive determination of alcohol in tissue |
| US11/305,964 US7756558B2 (en) | 2004-05-24 | 2005-12-19 | Apparatus and methods for mitigating the effects of foreign interferents on analyte measurements in spectroscopy |
| US11/393,341 US8095193B2 (en) | 2001-04-11 | 2006-03-30 | Apparatus and method for controlling operation of vehicles or machinery by intoxicated or impaired individuals |
Related Parent Applications (1)
| Application Number | Title | Priority Date | Filing Date |
|---|---|---|---|
| US11/305,964 Continuation-In-Part US7756558B2 (en) | 2001-04-11 | 2005-12-19 | Apparatus and methods for mitigating the effects of foreign interferents on analyte measurements in spectroscopy |
Related Child Applications (1)
| Application Number | Title | Priority Date | Filing Date |
|---|---|---|---|
| PCT/US2010/021898 Continuation-In-Part WO2010085716A1 (en) | 2004-05-24 | 2010-01-23 | System for noninvasive determination of alcohol in tissue |
Publications (2)
| Publication Number | Publication Date |
|---|---|
| US20060173256A1 US20060173256A1 (en) | 2006-08-03 |
| US8095193B2 true US8095193B2 (en) | 2012-01-10 |
Family
ID=46324180
Family Applications (1)
| Application Number | Title | Priority Date | Filing Date |
|---|---|---|---|
| US11/393,341 Active 2025-10-28 US8095193B2 (en) | 2001-04-11 | 2006-03-30 | Apparatus and method for controlling operation of vehicles or machinery by intoxicated or impaired individuals |
Country Status (1)
| Country | Link |
|---|---|
| US (1) | US8095193B2 (en) |
Cited By (12)
| Publication number | Priority date | Publication date | Assignee | Title |
|---|---|---|---|---|
| US20100036592A1 (en) * | 2008-08-07 | 2010-02-11 | Denso Corporation | Engine starting controller |
| US20100121644A1 (en) * | 2006-08-15 | 2010-05-13 | Avery Glasser | Adaptive tuning of biometric engines |
| US20100240969A1 (en) * | 2009-03-23 | 2010-09-23 | Bi Incorporated | Systems and Methods for Transdermal Secretion Detection |
| US20100309003A1 (en) * | 2007-12-21 | 2010-12-09 | Eads Secure Networks | Method of producing a proof of presence or of operation of an entity in an identified zone for a duration greater than a given threshold, and monitoring system |
| US20150066238A1 (en) * | 2013-08-27 | 2015-03-05 | Automotive Coalition For Traffic Safety, Inc. | Systems and methods for controlling vehicle ignition using biometric data |
| US20150130611A1 (en) * | 2009-02-23 | 2015-05-14 | Michael D. Roth | Behavior modification apparatus and method of use thereof |
| US9290095B2 (en) | 2009-02-23 | 2016-03-22 | Michael D. Roth | Ignition interlock identification apparatus and method of use thereof |
| US10099554B2 (en) | 2011-08-29 | 2018-10-16 | Automotive Coalition For Traffic Safety, Inc. | System for non-invasive measurement of an analyte in a vehicle driver |
| US10722292B2 (en) | 2013-05-31 | 2020-07-28 | Covidien Lp | Surgical device with an end-effector assembly and system for monitoring of tissue during a surgical procedure |
| US20210100498A1 (en) * | 2019-10-03 | 2021-04-08 | Dor Zarbel | Devices, systems and methods for non-invasive measurement of blood alcohol level |
| US11513070B2 (en) | 2019-06-12 | 2022-11-29 | Automotive Coalition For Traffic Safety, Inc. | System for non-invasive measurement of an analyte in a vehicle driver |
| US11971351B2 (en) | 2022-11-29 | 2024-04-30 | Automotive Coalition For Traffic Safety, Inc. | System for non-invasive measurement of an analyte in a vehicle driver |
Families Citing this family (43)
| Publication number | Priority date | Publication date | Assignee | Title |
|---|---|---|---|---|
| US8581697B2 (en) * | 2001-04-11 | 2013-11-12 | Trutouch Technologies Inc. | Apparatuses for noninvasive determination of in vivo alcohol concentration using raman spectroscopy |
| US8174394B2 (en) * | 2001-04-11 | 2012-05-08 | Trutouch Technologies, Inc. | System for noninvasive determination of analytes in tissue |
| US7751594B2 (en) | 2003-04-04 | 2010-07-06 | Lumidigm, Inc. | White-light spectral biometric sensors |
| US20110178420A1 (en) * | 2010-01-18 | 2011-07-21 | Trent Ridder | Methods and apparatuses for improving breath alcohol testing |
| US8730047B2 (en) | 2004-05-24 | 2014-05-20 | Trutouch Technologies, Inc. | System for noninvasive determination of analytes in tissue |
| US8515506B2 (en) * | 2004-05-24 | 2013-08-20 | Trutouch Technologies, Inc. | Methods for noninvasive determination of in vivo alcohol concentration using Raman spectroscopy |
| US8229185B2 (en) | 2004-06-01 | 2012-07-24 | Lumidigm, Inc. | Hygienic biometric sensors |
| US8787630B2 (en) * | 2004-08-11 | 2014-07-22 | Lumidigm, Inc. | Multispectral barcode imaging |
| US8549318B2 (en) * | 2006-02-13 | 2013-10-01 | Affirmed Technologies, Llc | Method and system for preventing unauthorized use of a vehicle by an operator of the vehicle |
| US7812712B2 (en) * | 2006-02-13 | 2010-10-12 | All Protect, Llc | Method and system for controlling a vehicle given to a third party |
| US8175346B2 (en) | 2006-07-19 | 2012-05-08 | Lumidigm, Inc. | Whole-hand multispectral biometric imaging |
| US7995808B2 (en) | 2006-07-19 | 2011-08-09 | Lumidigm, Inc. | Contactless multispectral biometric capture |
| US8355545B2 (en) | 2007-04-10 | 2013-01-15 | Lumidigm, Inc. | Biometric detection using spatial, temporal, and/or spectral techniques |
| US7962342B1 (en) * | 2006-08-22 | 2011-06-14 | Avaya Inc. | Dynamic user interface for the temporarily impaired based on automatic analysis for speech patterns |
| US8285010B2 (en) * | 2007-03-21 | 2012-10-09 | Lumidigm, Inc. | Biometrics based on locally consistent features |
| US20110050407A1 (en) * | 2007-12-27 | 2011-03-03 | Alexander Schoenfeld | Sobriety interlock device |
| US8258968B2 (en) * | 2008-02-12 | 2012-09-04 | Viken Der Ghazarian | Remote transponder breathalyzer |
| US8788097B2 (en) | 2009-06-22 | 2014-07-22 | Johnson Controls Technology Company | Systems and methods for using rule-based fault detection in a building management system |
| US9606520B2 (en) | 2009-06-22 | 2017-03-28 | Johnson Controls Technology Company | Automated fault detection and diagnostics in a building management system |
| US9196009B2 (en) | 2009-06-22 | 2015-11-24 | Johnson Controls Technology Company | Systems and methods for detecting changes in energy usage in a building |
| US9753455B2 (en) | 2009-06-22 | 2017-09-05 | Johnson Controls Technology Company | Building management system with fault analysis |
| US8532839B2 (en) | 2009-06-22 | 2013-09-10 | Johnson Controls Technology Company | Systems and methods for statistical control and fault detection in a building management system |
| US11269303B2 (en) | 2009-06-22 | 2022-03-08 | Johnson Controls Technology Company | Systems and methods for detecting changes in energy usage in a building |
| US8600556B2 (en) | 2009-06-22 | 2013-12-03 | Johnson Controls Technology Company | Smart building manager |
| US9286582B2 (en) | 2009-06-22 | 2016-03-15 | Johnson Controls Technology Company | Systems and methods for detecting changes in energy usage in a building |
| US8731724B2 (en) | 2009-06-22 | 2014-05-20 | Johnson Controls Technology Company | Automated fault detection and diagnostics in a building management system |
| US10739741B2 (en) | 2009-06-22 | 2020-08-11 | Johnson Controls Technology Company | Systems and methods for detecting changes in energy usage in a building |
| WO2011006467A1 (en) * | 2009-07-13 | 2011-01-20 | Schaeffler Technologies Gmbh & Co. Kg | Device for preventing a motor vehicle from being set in motion |
| DE112010003414T5 (en) | 2009-08-26 | 2012-12-06 | Lumidigm, Inc. | Biometric multiplex imaging and biometric dual imager sensor |
| US9060687B2 (en) | 2009-10-02 | 2015-06-23 | Sharp Kabushiki Kaisha | Device for monitoring blood vessel conditions and method for monitoring same |
| WO2011100255A2 (en) * | 2010-02-09 | 2011-08-18 | Johnson Controls Technology Company | Systems and methods for measuring and verifying energy savings in buildings |
| US8570149B2 (en) | 2010-03-16 | 2013-10-29 | Lumidigm, Inc. | Biometric imaging using an optical adaptive interface |
| WO2011114578A1 (en) | 2010-03-19 | 2011-09-22 | シャープ株式会社 | Measurement device, measurement method, measurement result processing device, measurement system, measurement result processing method, control program, and recording medium |
| JP5384453B2 (en) | 2010-09-09 | 2014-01-08 | シャープ株式会社 | Measuring device, measuring system, measuring method, control program, and recording medium |
| US8701815B2 (en) | 2010-09-30 | 2014-04-22 | Dräger Safety AG & Co. KGaA | Drug interlock system having a safety function |
| JP5290257B2 (en) | 2010-10-12 | 2013-09-18 | シャープ株式会社 | Detection device, detection method, control program, and recording medium |
| US9390388B2 (en) | 2012-05-31 | 2016-07-12 | Johnson Controls Technology Company | Systems and methods for measuring and verifying energy usage in a building |
| US9778639B2 (en) | 2014-12-22 | 2017-10-03 | Johnson Controls Technology Company | Systems and methods for adaptively updating equipment models |
| US20170063858A1 (en) * | 2015-08-31 | 2017-03-02 | Ca, Inc. | Alertness Based Authorization |
| US10488398B2 (en) | 2015-12-17 | 2019-11-26 | #1 A Lifesafer, Inc. | Chemical impairment detection system with an integrated, multi-function breath chamber |
| EP3555609A4 (en) * | 2016-12-16 | 2020-07-15 | Infusense Corp. | Compositions and methods to detect molecules in a sample |
| US11918352B2 (en) * | 2018-05-15 | 2024-03-05 | Isbrg Corp. | Non-invasive determination of a physiological state of interest in a subject |
| US11668652B2 (en) * | 2019-01-14 | 2023-06-06 | Uvic Industry Partnerships Inc. | Optical fiber-based sensor for determining the concentration of fluoride in water |
Citations (2)
| Publication number | Priority date | Publication date | Assignee | Title |
|---|---|---|---|---|
| US6229908B1 (en) * | 1996-04-26 | 2001-05-08 | Edmonds, Iii Dean Stockett | Driver alcohol ignition interlock |
| US6560352B2 (en) * | 1999-10-08 | 2003-05-06 | Lumidigm, Inc. | Apparatus and method of biometric identification or verification of individuals using optical spectroscopy |
-
2006
- 2006-03-30 US US11/393,341 patent/US8095193B2/en active Active
Patent Citations (2)
| Publication number | Priority date | Publication date | Assignee | Title |
|---|---|---|---|---|
| US6229908B1 (en) * | 1996-04-26 | 2001-05-08 | Edmonds, Iii Dean Stockett | Driver alcohol ignition interlock |
| US6560352B2 (en) * | 1999-10-08 | 2003-05-06 | Lumidigm, Inc. | Apparatus and method of biometric identification or verification of individuals using optical spectroscopy |
Cited By (22)
| Publication number | Priority date | Publication date | Assignee | Title |
|---|---|---|---|---|
| US20100121644A1 (en) * | 2006-08-15 | 2010-05-13 | Avery Glasser | Adaptive tuning of biometric engines |
| US8842886B2 (en) * | 2006-08-15 | 2014-09-23 | Avery Glasser | Adaptive tuning of biometric engines |
| US20100309003A1 (en) * | 2007-12-21 | 2010-12-09 | Eads Secure Networks | Method of producing a proof of presence or of operation of an entity in an identified zone for a duration greater than a given threshold, and monitoring system |
| US8477038B2 (en) * | 2007-12-21 | 2013-07-02 | Cassidian Sas | Method of producing a proof of presence or of operation of an entity in an identified zone for a duration greater than a given threshold, and monitoring system |
| US8469134B2 (en) * | 2008-08-07 | 2013-06-25 | Denso Corporation | Engine starting controller |
| US20100036592A1 (en) * | 2008-08-07 | 2010-02-11 | Denso Corporation | Engine starting controller |
| US20150130611A1 (en) * | 2009-02-23 | 2015-05-14 | Michael D. Roth | Behavior modification apparatus and method of use thereof |
| US9454859B2 (en) * | 2009-02-23 | 2016-09-27 | Michael D. Roth | Behavior modification apparatus and method of use thereof |
| US9290095B2 (en) | 2009-02-23 | 2016-03-22 | Michael D. Roth | Ignition interlock identification apparatus and method of use thereof |
| US9241659B2 (en) * | 2009-03-23 | 2016-01-26 | Bi Incorporated | Systems and methods for transdermal secretion detection |
| US8657744B2 (en) * | 2009-03-23 | 2014-02-25 | Bi Incorporated | Systems and methods for transdermal secretion detection |
| US20100240969A1 (en) * | 2009-03-23 | 2010-09-23 | Bi Incorporated | Systems and Methods for Transdermal Secretion Detection |
| US10099554B2 (en) | 2011-08-29 | 2018-10-16 | Automotive Coalition For Traffic Safety, Inc. | System for non-invasive measurement of an analyte in a vehicle driver |
| US20190275886A1 (en) * | 2011-08-29 | 2019-09-12 | Automotive Coalition For Traffic Safety, Inc. | System for non-invasive measurement of an analyte in a vehicle driver |
| US11001142B2 (en) * | 2011-08-29 | 2021-05-11 | Automotive Coalition For Traffic Safety, Inc. | System for non-invasive measurement of an analyte in a vehicle driver |
| US10722292B2 (en) | 2013-05-31 | 2020-07-28 | Covidien Lp | Surgical device with an end-effector assembly and system for monitoring of tissue during a surgical procedure |
| US11166760B2 (en) | 2013-05-31 | 2021-11-09 | Covidien Lp | Surgical device with an end-effector assembly and system for monitoring of tissue during a surgical procedure |
| US20150066238A1 (en) * | 2013-08-27 | 2015-03-05 | Automotive Coalition For Traffic Safety, Inc. | Systems and methods for controlling vehicle ignition using biometric data |
| US10710455B2 (en) * | 2013-08-27 | 2020-07-14 | Automotive Coalition For Traffic Safety | Systems and methods for controlling vehicle ignition using biometric data |
| US11513070B2 (en) | 2019-06-12 | 2022-11-29 | Automotive Coalition For Traffic Safety, Inc. | System for non-invasive measurement of an analyte in a vehicle driver |
| US20210100498A1 (en) * | 2019-10-03 | 2021-04-08 | Dor Zarbel | Devices, systems and methods for non-invasive measurement of blood alcohol level |
| US11971351B2 (en) | 2022-11-29 | 2024-04-30 | Automotive Coalition For Traffic Safety, Inc. | System for non-invasive measurement of an analyte in a vehicle driver |
Also Published As
| Publication number | Publication date |
|---|---|
| US20060173256A1 (en) | 2006-08-03 |
Similar Documents
| Publication | Publication Date | Title |
|---|---|---|
| US8095193B2 (en) | Apparatus and method for controlling operation of vehicles or machinery by intoxicated or impaired individuals | |
| US7616123B2 (en) | Apparatus and method for noninvasively monitoring for the presence of alcohol or substances of abuse in controlled environments | |
| US8174394B2 (en) | System for noninvasive determination of analytes in tissue | |
| US20120078473A1 (en) | Apparatus and Method for Controlling Operation of Vehicles or Machinery by Intoxicated or Impaired Individuals | |
| US11001142B2 (en) | System for non-invasive measurement of an analyte in a vehicle driver | |
| US8730047B2 (en) | System for noninvasive determination of analytes in tissue | |
| US8581697B2 (en) | Apparatuses for noninvasive determination of in vivo alcohol concentration using raman spectroscopy | |
| US20110178420A1 (en) | Methods and apparatuses for improving breath alcohol testing | |
| US8515506B2 (en) | Methods for noninvasive determination of in vivo alcohol concentration using Raman spectroscopy | |
| US9487398B2 (en) | Apparatus and method of biometric determination using specialized optical spectroscopy systems | |
| US6816605B2 (en) | Methods and systems for biometric identification of individuals using linear optical spectroscopy | |
| JP2007524441A (en) | Multispectral biometric sensor | |
| AU2002251767A1 (en) | Apparatus and method of biometric determination on the basis of spectral opitical measurements | |
| US20130317328A1 (en) | Methods and Apparatuses for Noninvasive Determination of in vivo Alcohol Concentration using Raman Spectroscopy | |
| US11513070B2 (en) | System for non-invasive measurement of an analyte in a vehicle driver | |
| US11971351B2 (en) | System for non-invasive measurement of an analyte in a vehicle driver |
Legal Events
| Date | Code | Title | Description |
|---|---|---|---|
| AS | Assignment |
Owner name: TRUTOUCH TECHNOLOGIES, INC., NEW MEXICO Free format text: ASSIGNMENT OF ASSIGNORS INTEREST;ASSIGNORS:RIDDER, TRENT;VER STEEG, BEN;MCNALLY, JAMES;SIGNING DATES FROM 20060826 TO 20060913;REEL/FRAME:018394/0623 Owner name: TRUTOUCH TECHNOLOGIES, INC., NEW MEXICO Free format text: ASSIGNMENT OF ASSIGNORS INTEREST;ASSIGNORS:RIDDER, TRENT;VER STEEG, BEN;MCNALLY, JAMES;REEL/FRAME:018394/0623;SIGNING DATES FROM 20060826 TO 20060913 |
|
| STCF | Information on status: patent grant |
Free format text: PATENTED CASE |
|
| FPAY | Fee payment |
Year of fee payment: 4 |
|
| FEPP | Fee payment procedure |
Free format text: MAINTENANCE FEE REMINDER MAILED (ORIGINAL EVENT CODE: REM.); ENTITY STATUS OF PATENT OWNER: SMALL ENTITY |
|
| FEPP | Fee payment procedure |
Free format text: 7.5 YR SURCHARGE - LATE PMT W/IN 6 MO, SMALL ENTITY (ORIGINAL EVENT CODE: M2555); ENTITY STATUS OF PATENT OWNER: SMALL ENTITY |
|
| MAFP | Maintenance fee payment |
Free format text: PAYMENT OF MAINTENANCE FEE, 8TH YR, SMALL ENTITY (ORIGINAL EVENT CODE: M2552); ENTITY STATUS OF PATENT OWNER: SMALL ENTITY Year of fee payment: 8 |
|
| AS | Assignment |
Owner name: ROCKLEY PHOTONICS LIMITED, GREAT BRITAIN Free format text: ASSIGNMENT OF ASSIGNORS INTEREST;ASSIGNOR:TRUTOUCH TECHNOLOGIES, INC.;REEL/FRAME:054569/0976 Effective date: 20201123 |
|
| FEPP | Fee payment procedure |
Free format text: ENTITY STATUS SET TO UNDISCOUNTED (ORIGINAL EVENT CODE: BIG.); ENTITY STATUS OF PATENT OWNER: LARGE ENTITY |
|
| AS | Assignment |
Owner name: WILMINGTON SAVINGS FUND SOCIETY, FSB, AS COLLATERAL AGENT, DELAWARE Free format text: SECURITY INTEREST;ASSIGNOR:ROCKLEY PHOTONICS LIMITED;REEL/FRAME:060204/0749 Effective date: 20220527 |
|
| AS | Assignment |
Owner name: WILMINGTON SAVINGS FUND SOCIETY, FSB, AS COLLATERAL AGENT, DELAWARE Free format text: SECURITY INTEREST - SUPER SENIOR INDENTURE;ASSIGNOR:ROCKLEY PHOTONICS LIMITED;REEL/FRAME:061768/0082 Effective date: 20221025 |
|
| AS | Assignment |
Owner name: ROCKLEY PHOTONICS LIMITED, UNITED KINGDOM Free format text: RELEASE OF PATENT SECURITY INTEREST - SUPER SENIOR INDENTURE - REEL/FRAME 061768/0082;ASSIGNOR:WILMINGTON SAVINGS FUND SOCIETY, FSB, AS COLLATERAL AGENT;REEL/FRAME:063264/0416 Effective date: 20230314 Owner name: ROCKLEY PHOTONICS LIMITED, UNITED KINGDOM Free format text: RELEASE OF SECURITY INTEREST - REEL/FRAME 060204/0749;ASSIGNOR:WILMINGTON SAVINGS FUND SOCIETY, FSB, AS COLLATERAL AGENT;REEL/FRAME:063264/0333 Effective date: 20230314 Owner name: WILMINGTON SAVINGS FUND SOCIETY, FSB, AS COLLATERAL AGENT, DELAWARE Free format text: SECURITY INTEREST;ASSIGNOR:ROCKLEY PHOTONICS LIMITED;REEL/FRAME:063287/0879 Effective date: 20230314 |
|
| MAFP | Maintenance fee payment |
Free format text: PAYMENT OF MAINTENANCE FEE, 12TH YEAR, LARGE ENTITY (ORIGINAL EVENT CODE: M1553); ENTITY STATUS OF PATENT OWNER: LARGE ENTITY Year of fee payment: 12 |