US9848820B2 - Apnea analysis system and method - Google Patents
Apnea analysis system and method Download PDFInfo
- Publication number
- US9848820B2 US9848820B2 US14/590,609 US201514590609A US9848820B2 US 9848820 B2 US9848820 B2 US 9848820B2 US 201514590609 A US201514590609 A US 201514590609A US 9848820 B2 US9848820 B2 US 9848820B2
- Authority
- US
- United States
- Prior art keywords
- apnea
- ppg
- breath
- signal
- waveform
- Prior art date
- Legal status (The legal status is an assumption and is not a legal conclusion. Google has not performed a legal analysis and makes no representation as to the accuracy of the status listed.)
- Active, expires
Links
- 208000008784 apnea Diseases 0.000 title claims abstract description 200
- 238000004458 analytical method Methods 0.000 title claims abstract description 132
- 238000000034 method Methods 0.000 title claims description 45
- 230000000241 respiratory effect Effects 0.000 claims abstract description 110
- 208000003417 Central Sleep Apnea Diseases 0.000 claims abstract description 35
- 230000000414 obstructive effect Effects 0.000 claims abstract description 32
- 230000029058 respiratory gaseous exchange Effects 0.000 claims description 108
- 230000000747 cardiac effect Effects 0.000 claims description 28
- QVGXLLKOCUKJST-UHFFFAOYSA-N atomic oxygen Chemical compound [O] QVGXLLKOCUKJST-UHFFFAOYSA-N 0.000 claims description 19
- 229910052760 oxygen Inorganic materials 0.000 claims description 19
- 239000001301 oxygen Substances 0.000 claims description 19
- 239000007789 gas Substances 0.000 claims description 9
- 238000001514 detection method Methods 0.000 abstract description 38
- 238000004891 communication Methods 0.000 abstract description 5
- CURLTUGMZLYLDI-UHFFFAOYSA-N Carbon dioxide Chemical compound O=C=O CURLTUGMZLYLDI-UHFFFAOYSA-N 0.000 description 24
- 230000002238 attenuated effect Effects 0.000 description 20
- 239000008280 blood Substances 0.000 description 19
- 210000004369 blood Anatomy 0.000 description 19
- 229910002092 carbon dioxide Inorganic materials 0.000 description 19
- 239000001569 carbon dioxide Substances 0.000 description 19
- 230000000875 corresponding effect Effects 0.000 description 14
- 238000012545 processing Methods 0.000 description 13
- 230000036387 respiratory rate Effects 0.000 description 11
- 229910003798 SPO2 Inorganic materials 0.000 description 8
- 230000006870 function Effects 0.000 description 8
- 230000008569 process Effects 0.000 description 8
- 238000005070 sampling Methods 0.000 description 8
- 230000007423 decrease Effects 0.000 description 6
- 238000010586 diagram Methods 0.000 description 6
- 230000004044 response Effects 0.000 description 6
- 230000007774 longterm Effects 0.000 description 5
- 239000011159 matrix material Substances 0.000 description 5
- 238000012544 monitoring process Methods 0.000 description 5
- 230000009467 reduction Effects 0.000 description 5
- 239000000523 sample Substances 0.000 description 5
- 238000003745 diagnosis Methods 0.000 description 4
- 230000031700 light absorption Effects 0.000 description 4
- 238000009423 ventilation Methods 0.000 description 4
- 238000010521 absorption reaction Methods 0.000 description 3
- 230000003247 decreasing effect Effects 0.000 description 3
- 230000000694 effects Effects 0.000 description 3
- 238000000605 extraction Methods 0.000 description 3
- 210000001061 forehead Anatomy 0.000 description 3
- 230000003287 optical effect Effects 0.000 description 3
- 230000036961 partial effect Effects 0.000 description 3
- 230000002685 pulmonary effect Effects 0.000 description 3
- 238000002106 pulse oximetry Methods 0.000 description 3
- 230000005236 sound signal Effects 0.000 description 3
- 102000001554 Hemoglobins Human genes 0.000 description 2
- 108010054147 Hemoglobins Proteins 0.000 description 2
- 206010020591 Hypercapnia Diseases 0.000 description 2
- 206010021143 Hypoxia Diseases 0.000 description 2
- 238000002835 absorbance Methods 0.000 description 2
- 230000002411 adverse Effects 0.000 description 2
- 230000017531 blood circulation Effects 0.000 description 2
- 230000036772 blood pressure Effects 0.000 description 2
- 238000004364 calculation method Methods 0.000 description 2
- 210000000038 chest Anatomy 0.000 description 2
- 238000004590 computer program Methods 0.000 description 2
- 230000002596 correlated effect Effects 0.000 description 2
- 230000001351 cycling effect Effects 0.000 description 2
- 238000013500 data storage Methods 0.000 description 2
- 238000005516 engineering process Methods 0.000 description 2
- 230000036044 hypoxaemia Effects 0.000 description 2
- 239000004973 liquid crystal related substance Substances 0.000 description 2
- 230000000926 neurological effect Effects 0.000 description 2
- 230000002829 reductive effect Effects 0.000 description 2
- 210000000115 thoracic cavity Anatomy 0.000 description 2
- 238000011282 treatment Methods 0.000 description 2
- 238000012935 Averaging Methods 0.000 description 1
- 208000006545 Chronic Obstructive Pulmonary Disease Diseases 0.000 description 1
- 230000005856 abnormality Effects 0.000 description 1
- 230000003044 adaptive effect Effects 0.000 description 1
- 238000013528 artificial neural network Methods 0.000 description 1
- 208000006673 asthma Diseases 0.000 description 1
- 210000004204 blood vessel Anatomy 0.000 description 1
- 210000004556 brain Anatomy 0.000 description 1
- 230000006931 brain damage Effects 0.000 description 1
- 231100000874 brain damage Toxicity 0.000 description 1
- 208000029028 brain injury Diseases 0.000 description 1
- 230000035565 breathing frequency Effects 0.000 description 1
- 230000008859 change Effects 0.000 description 1
- 230000004087 circulation Effects 0.000 description 1
- 239000003086 colorant Substances 0.000 description 1
- 239000000470 constituent Substances 0.000 description 1
- 230000003292 diminished effect Effects 0.000 description 1
- 229940079593 drug Drugs 0.000 description 1
- 239000003814 drug Substances 0.000 description 1
- 210000000624 ear auricle Anatomy 0.000 description 1
- 230000001747 exhibiting effect Effects 0.000 description 1
- 210000003414 extremity Anatomy 0.000 description 1
- 230000008713 feedback mechanism Effects 0.000 description 1
- 238000001914 filtration Methods 0.000 description 1
- 210000003811 finger Anatomy 0.000 description 1
- 210000000245 forearm Anatomy 0.000 description 1
- 210000004072 lung Anatomy 0.000 description 1
- 230000007257 malfunction Effects 0.000 description 1
- 239000000463 material Substances 0.000 description 1
- 238000005259 measurement Methods 0.000 description 1
- 238000002483 medication Methods 0.000 description 1
- 238000012986 modification Methods 0.000 description 1
- 230000004048 modification Effects 0.000 description 1
- 238000012806 monitoring device Methods 0.000 description 1
- 230000003121 nonmonotonic effect Effects 0.000 description 1
- 208000001797 obstructive sleep apnea Diseases 0.000 description 1
- 238000002496 oximetry Methods 0.000 description 1
- 230000010412 perfusion Effects 0.000 description 1
- 230000000541 pulsatile effect Effects 0.000 description 1
- 230000000630 rising effect Effects 0.000 description 1
- 239000007787 solid Substances 0.000 description 1
- 230000001360 synchronised effect Effects 0.000 description 1
- 210000003371 toe Anatomy 0.000 description 1
- 230000007704 transition Effects 0.000 description 1
- 239000011800 void material Substances 0.000 description 1
Images


Classifications
-
- A—HUMAN NECESSITIES
- A61—MEDICAL OR VETERINARY SCIENCE; HYGIENE
- A61B—DIAGNOSIS; SURGERY; IDENTIFICATION
- A61B5/00—Measuring for diagnostic purposes; Identification of persons
- A61B5/48—Other medical applications
- A61B5/4806—Sleep evaluation
- A61B5/4818—Sleep apnoea
-
- A—HUMAN NECESSITIES
- A61—MEDICAL OR VETERINARY SCIENCE; HYGIENE
- A61B—DIAGNOSIS; SURGERY; IDENTIFICATION
- A61B5/00—Measuring for diagnostic purposes; Identification of persons
- A61B5/02—Detecting, measuring or recording pulse, heart rate, blood pressure or blood flow; Combined pulse/heart-rate/blood pressure determination; Evaluating a cardiovascular condition not otherwise provided for, e.g. using combinations of techniques provided for in this group with electrocardiography or electroauscultation; Heart catheters for measuring blood pressure
- A61B5/0205—Simultaneously evaluating both cardiovascular conditions and different types of body conditions, e.g. heart and respiratory condition
- A61B5/02055—Simultaneously evaluating both cardiovascular condition and temperature
-
- A—HUMAN NECESSITIES
- A61—MEDICAL OR VETERINARY SCIENCE; HYGIENE
- A61B—DIAGNOSIS; SURGERY; IDENTIFICATION
- A61B5/00—Measuring for diagnostic purposes; Identification of persons
- A61B5/02—Detecting, measuring or recording pulse, heart rate, blood pressure or blood flow; Combined pulse/heart-rate/blood pressure determination; Evaluating a cardiovascular condition not otherwise provided for, e.g. using combinations of techniques provided for in this group with electrocardiography or electroauscultation; Heart catheters for measuring blood pressure
- A61B5/024—Detecting, measuring or recording pulse rate or heart rate
- A61B5/02416—Detecting, measuring or recording pulse rate or heart rate using photoplethysmograph signals, e.g. generated by infrared radiation
-
- A—HUMAN NECESSITIES
- A61—MEDICAL OR VETERINARY SCIENCE; HYGIENE
- A61B—DIAGNOSIS; SURGERY; IDENTIFICATION
- A61B5/00—Measuring for diagnostic purposes; Identification of persons
- A61B5/08—Detecting, measuring or recording devices for evaluating the respiratory organs
- A61B5/0826—Detecting or evaluating apnoea events
-
- A—HUMAN NECESSITIES
- A61—MEDICAL OR VETERINARY SCIENCE; HYGIENE
- A61B—DIAGNOSIS; SURGERY; IDENTIFICATION
- A61B5/00—Measuring for diagnostic purposes; Identification of persons
- A61B5/145—Measuring characteristics of blood in vivo, e.g. gas concentration, pH value; Measuring characteristics of body fluids or tissues, e.g. interstitial fluid, cerebral tissue
- A61B5/1455—Measuring characteristics of blood in vivo, e.g. gas concentration, pH value; Measuring characteristics of body fluids or tissues, e.g. interstitial fluid, cerebral tissue using optical sensors, e.g. spectral photometrical oximeters
- A61B5/14551—Measuring characteristics of blood in vivo, e.g. gas concentration, pH value; Measuring characteristics of body fluids or tissues, e.g. interstitial fluid, cerebral tissue using optical sensors, e.g. spectral photometrical oximeters for measuring blood gases
-
- A—HUMAN NECESSITIES
- A61—MEDICAL OR VETERINARY SCIENCE; HYGIENE
- A61B—DIAGNOSIS; SURGERY; IDENTIFICATION
- A61B5/00—Measuring for diagnostic purposes; Identification of persons
- A61B5/72—Signal processing specially adapted for physiological signals or for diagnostic purposes
- A61B5/7271—Specific aspects of physiological measurement analysis
- A61B5/7278—Artificial waveform generation or derivation, e.g. synthesising signals from measured signals
-
- A—HUMAN NECESSITIES
- A61—MEDICAL OR VETERINARY SCIENCE; HYGIENE
- A61B—DIAGNOSIS; SURGERY; IDENTIFICATION
- A61B5/00—Measuring for diagnostic purposes; Identification of persons
- A61B5/72—Signal processing specially adapted for physiological signals or for diagnostic purposes
- A61B5/7271—Specific aspects of physiological measurement analysis
- A61B5/7282—Event detection, e.g. detecting unique waveforms indicative of a medical condition
-
- A—HUMAN NECESSITIES
- A61—MEDICAL OR VETERINARY SCIENCE; HYGIENE
- A61B—DIAGNOSIS; SURGERY; IDENTIFICATION
- A61B7/00—Instruments for auscultation
- A61B7/003—Detecting lung or respiration noise
-
- A—HUMAN NECESSITIES
- A61—MEDICAL OR VETERINARY SCIENCE; HYGIENE
- A61B—DIAGNOSIS; SURGERY; IDENTIFICATION
- A61B5/00—Measuring for diagnostic purposes; Identification of persons
- A61B5/08—Detecting, measuring or recording devices for evaluating the respiratory organs
- A61B5/0816—Measuring devices for examining respiratory frequency
-
- A—HUMAN NECESSITIES
- A61—MEDICAL OR VETERINARY SCIENCE; HYGIENE
- A61B—DIAGNOSIS; SURGERY; IDENTIFICATION
- A61B5/00—Measuring for diagnostic purposes; Identification of persons
- A61B5/08—Detecting, measuring or recording devices for evaluating the respiratory organs
- A61B5/083—Measuring rate of metabolism by using breath test, e.g. measuring rate of oxygen consumption
- A61B5/0836—Measuring rate of CO2 production
-
- A—HUMAN NECESSITIES
- A61—MEDICAL OR VETERINARY SCIENCE; HYGIENE
- A61B—DIAGNOSIS; SURGERY; IDENTIFICATION
- A61B5/00—Measuring for diagnostic purposes; Identification of persons
- A61B5/08—Detecting, measuring or recording devices for evaluating the respiratory organs
- A61B5/087—Measuring breath flow
-
- A—HUMAN NECESSITIES
- A61—MEDICAL OR VETERINARY SCIENCE; HYGIENE
- A61B—DIAGNOSIS; SURGERY; IDENTIFICATION
- A61B5/00—Measuring for diagnostic purposes; Identification of persons
- A61B5/145—Measuring characteristics of blood in vivo, e.g. gas concentration, pH value; Measuring characteristics of body fluids or tissues, e.g. interstitial fluid, cerebral tissue
- A61B5/1455—Measuring characteristics of blood in vivo, e.g. gas concentration, pH value; Measuring characteristics of body fluids or tissues, e.g. interstitial fluid, cerebral tissue using optical sensors, e.g. spectral photometrical oximeters
-
- A—HUMAN NECESSITIES
- A61—MEDICAL OR VETERINARY SCIENCE; HYGIENE
- A61B—DIAGNOSIS; SURGERY; IDENTIFICATION
- A61B5/00—Measuring for diagnostic purposes; Identification of persons
- A61B5/72—Signal processing specially adapted for physiological signals or for diagnostic purposes
- A61B5/7221—Determining signal validity, reliability or quality
-
- A—HUMAN NECESSITIES
- A61—MEDICAL OR VETERINARY SCIENCE; HYGIENE
- A61B—DIAGNOSIS; SURGERY; IDENTIFICATION
- A61B5/00—Measuring for diagnostic purposes; Identification of persons
- A61B5/72—Signal processing specially adapted for physiological signals or for diagnostic purposes
- A61B5/7225—Details of analog processing, e.g. isolation amplifier, gain or sensitivity adjustment, filtering, baseline or drift compensation
-
- A—HUMAN NECESSITIES
- A61—MEDICAL OR VETERINARY SCIENCE; HYGIENE
- A61B—DIAGNOSIS; SURGERY; IDENTIFICATION
- A61B5/00—Measuring for diagnostic purposes; Identification of persons
- A61B5/72—Signal processing specially adapted for physiological signals or for diagnostic purposes
- A61B5/7235—Details of waveform analysis
- A61B5/7253—Details of waveform analysis characterised by using transforms
-
- A—HUMAN NECESSITIES
- A61—MEDICAL OR VETERINARY SCIENCE; HYGIENE
- A61B—DIAGNOSIS; SURGERY; IDENTIFICATION
- A61B5/00—Measuring for diagnostic purposes; Identification of persons
- A61B5/72—Signal processing specially adapted for physiological signals or for diagnostic purposes
- A61B5/7235—Details of waveform analysis
- A61B5/7264—Classification of physiological signals or data, e.g. using neural networks, statistical classifiers, expert systems or fuzzy systems
Definitions
- Embodiments of the present disclosure generally relate to physiological signal processing and, more particularly, to an apnea analysis system and method, such as may be used to detect and classify types of apnea.
- Capnography represents a system and method of monitoring and displaying carbon dioxide (CO 2 ) level(s), CO 2 waveform(s), and/or other CO 2 related parameters, such as End Tidal CO 2 (EtCO 2 ), or a concentration or partial pressure of CO 2 , from an entire inhalation and exhalation respiratory cycle of an individual.
- CO 2 carbon dioxide
- EtCO 2 End Tidal CO 2
- a typical capnographic system generates waveforms and numeric values of an individual's respiratory cycle, and may be used to identify adverse ventilation events.
- Apnea may be detected using a capnographic system. For example, if a capnograph indicates that no exhaled CO 2 is present, then apnea may be present. However, a typical capnographic system is unable to differentiate between types of apnea. Instead, a typical capnographic system is generally only able to indicate that apnea exists. Because the specific type of apnea may not be readily determined through analysis of a capnographic signal or waveform, proper diagnosis and treatment may be hindered.
- Embodiments of the present disclosure generally relate to physiological signal processing and, more particularly, to an apnea analysis system and method, such as may be used to detect and classify types of apnea.
- a monitoring system receives a photoplethysmographic (PPG) signal from a PPG sensor, and a breath signal from a breath sensor, and analyzes the two signals to determine if the patient is breathing normally.
- PPG photoplethysmographic
- the system analyzes the PPG signal to determine whether the patient is breathing or attempting to breathe. This analysis is based on the identification of a respiratory component of the PPG signal, as discussed below.
- the system also analyzes the breath signal to determine if the patient is actually breathing.
- the system compares these two signals to determine if the patient is experiencing apnea, and to differentiate between obstructive apnea and central apnea.
- the system also identifies probe-off conditions for both the PPG sensor and the breath sensor, based on the comparison of the two signals.
- an apnea analysis system includes a photoplethysmographic (PPG) sub-system, a breath detection sub-system, and an apnea analysis module.
- the PPG sub-system is configured to be operatively connected to an individual and output a PPG signal from the individual.
- the breath detection sub-system is configured to be operatively connected to the individual and output a breath signal from the individual.
- the apnea analysis module is in communication with the PPG sub-system and the breath detection sub-system.
- the apnea analysis module analyzes the breath signal and a respiratory component of the PPG signal and, based on the analysis, identifies a presence of apnea, differentiates between obstructive apnea and central apnea, and provides an indication of the identified apnea.
- an apnea analysis method includes receiving a photoplethysmographic (PPG) signal indicative of a cardiac status of an individual, and receiving a breath signal indicative of a breathing status of the individual.
- the method identifies a respiratory component of the PPG signal indicative of a respiration effort or a respiration rate, and compares the breath signal and the respiratory component of the PPG.
- the method also includes identifying a presence of apnea, and differentiating between obstructive apnea and central apnea, based on the comparison.
- a tangible and non-transitory computer readable medium includes one or more sets of instructions configured to direct a computer to analyze a respiratory component of a PPG signal and a breath signal to detect whether or not an individual is experiencing apnea.
- the instructions also include differentiating between obstructive apnea and central apnea based on the analysis of the respiratory component of the PPG signal and the breath signal.
- a system for classifying an apnea includes a PPG sub-system, a breath detection sub-system, and an apnea analysis module.
- the PPG sub-system is configured to output a first signal indicative of a respiratory component of a PPG signal from a patient over a time period.
- the breath detection sub-system is configured to output a second signal indicative of a presence of breaths from the patient over the time period.
- the apnea analysis module is configured to identify and classify an apnea based on the first and second signals.
- a system for classifying an apnea includes at least one processor configured to receive a breath signal and a respiratory rate or effort signal, identify a reduction in one of the breath signal or the respiratory rate or effort signal over a time period, identify a corresponding status of the other of the breath signal or the respiratory rate or effort signal over at least a portion of the time period, and classify a type of apnea based on the reduction in the one of the breath signal or the respiratory rate or effort signal and the corresponding status of the other of the breath signal or the respiratory rate or effort signal.
- Certain embodiments of the present disclosure provide a tangible and non-transitory computer readable medium that includes one or more sets of instructions configured to direct a computer to analyze a PPG signal received from a PPG sub-system and a breath signal received from a breath detection sub-system to detect whether or not an individual is experiencing apnea, and differentiate between obstructive apnea, central apnea, and a combination of obstructive apnea and central apnea based on the analysis of the PPG signal and the breath signal.
- FIG. 1 illustrates a simplified block diagram of an apnea analysis system, according to an embodiment of the present disclosure.
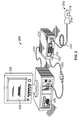
- FIG. 2 illustrates an isometric view of a PPG system, according to an embodiment of the present disclosure.
- FIG. 3 illustrates a simplified block diagram of a PPG system, according to an embodiment of the present disclosure.
- FIG. 4A illustrates a portion of a PPG waveform, according to an embodiment of the present disclosure.
- FIG. 4B illustrates a PPG waveform during normal breathing, according to an embodiment of the present disclosure.
- FIG. 4C illustrates one or more respiratory components of the PPG during normal breathing, according to an embodiment of the present disclosure.
- FIG. 5A illustrates a schematic block diagram of a capnographic sub-system, according to an embodiment of the present disclosure.
- FIG. 5B illustrates a capnograph waveform during normal breathing, according to an embodiment of the present disclosure.
- FIG. 6 illustrates a display screen showing a respiratory component of a PPG waveform and a breath waveform during normal breathing, according to an embodiment of the present disclosure.
- FIG. 7 illustrates a display screen showing a respiratory component of a PPG waveform a breath waveform during an obstructive apnea event, according to an embodiment of the present disclosure.
- FIG. 8 illustrates a display screen showing a respiratory component of a PPG waveform a breath waveform during a central apnea event, according to an embodiment of the present disclosure.
- FIG. 9 illustrates a display screen showing a respiratory component of a PPG waveform and a breath waveform during a PPG probe-off event, according to an embodiment of the present disclosure.
- FIG. 10 illustrates a logic table that may be used with an apnea analysis system and method, according to an embodiment of the present disclosure.
- FIG. 11 illustrates a logic table that may be used with an apnea analysis system and method, according to an embodiment of the present disclosure.
- FIG. 12 illustrates a logic table that may be used with an apnea analysis system and method, according to an embodiment of the present disclosure.
- FIG. 13 illustrates a flow chart of a method of operating an apnea analysis system, according to an embodiment of the present disclosure.
- Embodiments of the present disclosure generally relate to physiological signal processing and, more particularly, to an apnea analysis system and method, such as may be used to detect and classify types of apnea.
- a monitoring system receives a photoplethysmographic (PPG) signal from a PPG sensor, and a breath signal from a breath sensor, and analyzes the two signals to determine if the patient is breathing normally.
- PPG photoplethysmographic
- the system analyzes the PPG signal to determine whether the patient is breathing or attempting to breathe. This analysis is based on the identification of a respiratory component of the PPG signal, as discussed below.
- the system also analyzes the breath signal to determine if the patient is actually breathing.
- the system compares these two signals to determine if the patient is experiencing apnea, and to differentiate between obstructive apnea and central apnea.
- the system also identifies probe-off conditions for both the PPG sensor and the breath sensor, based on the comparison of the two signals.
- Apnea is the cessation or significant decrease in respiration or airflow by an individual.
- Obstructive apnea (or obstructive sleep apnea) is apnea in the presence of respiratory effort. That is, obstructive apnea is generally indicated by the existence of an effort to breathe, but with decreased or no actual breath exhalation. For example, an individual may try to breathe, as evident by chest movement, but the individual produces no actual breath. Such a situation may exist when the individual's airway is constricted or blocked.
- Central apnea or central sleep apnea, is apnea without respiratory effort. During central apnea, an individual may stop breathing, and may exhibit no effort or drive to breathe. Unlike obstructive apnea, with central apnea there is generally no chest movement or struggling. Central apnea may be characterized by an imbalance of respiratory control centers within the brain. Blood and carbon dioxide levels, and the neurological feedback mechanism that monitors them, may not react quickly enough to maintain an even respiratory rate. The basic neurological controls for breathing malfunction and fail to provide the signal to inhale, causing the individual to miss one or more cycles of breathing.
- hypoxaemia hypoxaemia
- concentration of carbon dioxide may build to a higher than normal level (hypercapnia).
- hypoxaemia and hypercapnia hypoxaemia and hypercapnia may trigger additional adverse effects on the body, such as brain damage and even death.
- An apnea analysis system is provided for monitoring a breathing status of a patient in order to identify and classify episodes of apnea.
- An apnea analysis system 100 according to an embodiment is shown in FIG. 1 .
- the apnea analysis system 100 includes a photoplethysmographic (PPG) sub-system 102 and a breath detection sub-system 104 operatively connected to and in communication with an apnea analysis module 106 , which may be operatively connected to a display 107 .
- the PPG sub-system 102 is configured to be operatively connected to an individual and used to output a PPG signal or output 108 indicative of one or more physiological characteristics of the individual.
- the PPG signal may be indicative of a blood flow status or cardiac status of the patient, and may be obtained through a pulse oximeter.
- the PPG sub-system 102 may include a PPG sensor (such as a pulse oximetry sensor) that is positioned on a finger, forehead, forearm, or the like of the individual.
- the PPG sensor is configured to detect the PPG signal or output 108 , which may be in the form of a PPG signal or a respiratory component of the PPG signal.
- the PPG signal 108 may be analyzed to determine physiological characteristics such as respiration rate, respiratory effort, pulse rate, oxygen saturation, and/or other parameters.
- the breath detection sub-system 104 is configured to be operatively connected to the individual and output a breath signal indicative of a breathing status of the individual, such as by detecting exhaled breath of an individual.
- the breath detection sub-system 104 may include a sampling device, such as nasal prongs, a breathing mask, and/or the like, configured to be positioned on the individual. The sampling device may be connected to a sidestream or mainstream gas analyzer.
- the breath detection sub-system 104 is a capnographic sub-system.
- the breath detection sub-system 104 may be or include pressure, acoustic, moisture, and/or temperature-based breath analysis sub-systems that are configured to detect the presence of inhaled and/or exhaled breath.
- the breath detection sub-system 104 is configured to output a breath signal or output 110 indicative of a breathing status of the individual.
- the breath signal or output 110 may indicate whether the individual is inhaling and/or exhaling, and may indicate characteristics of the individual's breath, such as depth, duration, CO 2 content, and frequency.
- the PPG sub-system 102 and the breath detection sub-system 104 may be connected to the apnea analysis module 106 through wired or wireless connections. As shown in FIG. 1 , the apnea analysis module 106 receives the PPG signal or output 108 from the PPG sub-system 102 , as well as the breath signal or output 110 from the breath detection sub-system 104 . The apnea analysis module 106 analyzes the outputs 108 and 110 from the PPG sub-system 102 and the breath detection sub-system 104 , respectively, and detects whether the individual is experiencing apnea.
- the apnea analysis module 106 is able to classify the apnea as central, obstructive, or mixed apnea, as described in further detail below.
- a PPG system 200 is shown in FIG. 2 .
- the PPG system 200 represents an example of the PPG sub-system 102 shown in FIG. 1 .
- the PPG system 200 is a pulse oximetry system.
- a pulse oximeter detects changes in blood volume under the skin, and thereby can indirectly, non-invasively measure the oxygen saturation of hemoglobin in an individual's arterial blood (as opposed to measuring oxygen saturation directly by analyzing a blood sample taken from the patient). Pulse oximeters may also be used to measure the pulse rate of the patient.
- the pulse oximetry system 200 includes a sensor or probe 212 that is placed at a site on a patient, typically a fingertip, toe, forehead or earlobe, or in the case of a neonate, across a foot.
- the sensor includes a light source or emitter 216 and a photodetector 218 .
- Light passes from the emitter 216 through the patient's blood perfused tissue and to the detector 218 , which photoelectrically senses the absorption of the light in the tissue.
- the oximeter may measure the intensity of light that is attenuated by the tissue and received at the detector, as a function of time.
- a signal representing light intensity versus time or a mathematical manipulation of this signal may be referred to as the photoplethysmograph (PPG) signal.
- PPG signal may also refer to an absorption signal (i.e., representing the amount of light absorbed by the tissue) or any suitable mathematical manipulation thereof.
- the PPG signal may be analyzed to identify cardiac pulses and determine the patient's pulse rate and when each cardiac pulse occurs.
- the relative light intensity or the amount of light absorbed by each may be used to calculate the amount of a particular component in the blood.
- the amount of light passed through the tissue varies in accordance with the changing amount of blood constituent in the tissue and the related light absorption.
- Red and infrared (IR) wavelengths may be used because it has been observed that highly oxygenated blood will absorb relatively less red light and more infrared light than blood with a lower oxygen saturation.
- the emitter 216 may emit two or more wavelengths into the patient's tissue, in order to calculate oxygen saturation of the patient's blood.
- the PPG sub-system 200 may include a plurality of emitters and detectors, and/or a plurality of sensors 212 forming a sensor array instead of a single sensor.
- the PPG sub-system 200 also includes a monitor 214 .
- the sensor 212 may be connected to and draw power from the monitor 214 , as shown.
- the sensor 212 may be wirelessly connected to the monitor 214 and include its own battery or similar power supply.
- the monitor 214 may be configured to calculate physiological parameters based at least in part on data received from the sensor 212 relating to light emission and detection. Alternatively, the calculations may be performed on the sensor 212 or in the sensor cable 224 , and the result of the oximetry reading may be passed to the monitor 214 .
- the monitor 214 may include a display 220 configured to display the physiological parameters or other information about the PPG sub-system 200 .
- the monitor 214 may also include a speaker 222 to provide an audible sound that may be used in various other embodiments, such as for example, sounding an audible alarm in the event that a patient's physiological parameters are not within a predefined normal range.
- the sensor 212 may be communicatively coupled to the monitor 214 via the cable 224 .
- a wireless transceiver (not shown) or the like may be used instead of or in addition to cable 224 to transmit data between the sensor and monitor.
- the PPG sub-system 200 may also include a multi-parameter patient monitor 226 .
- the monitor 226 may be a cathode ray tube type, a flat panel display (as shown) such as a liquid crystal display (LCD) or a plasma display, or any other type of monitor now known or later developed.
- the monitor 214 may be communicatively coupled to the multi-parameter patient monitor 226 via a cable 232 or 234 .
- the multi-parameter patient monitor 226 may be configured to calculate physiological parameters and to provide a display 228 for information from the monitor 214 and from other medical monitoring devices or systems, such as, for example, the apnea analysis module 106 shown in FIG. 1 .
- the multiparameter patient monitor 226 may be configured to display an estimate of an individual's blood oxygen saturation (referred to as an “SpO 2 ” measurement) generated by the monitor 214 , pulse rate information from the monitor 214 and blood pressure from a blood pressure monitor (not shown) on the display 228 .
- the monitor 226 may be used as the display 107 of FIG. 1 .
- FIG. 3 A block diagram of a PPG system 210 according to an embodiment is shown in FIG. 3 . Certain illustrative components of the sensor 212 and the monitor 214 are illustrated in FIG. 3 .
- the sensor 212 includes the emitter 216 , the detector 218 , and an encoder 242 .
- the emitter 216 includes a first light emitting light source for emitting light at a first wavelength, such as RED light emitting diode (LED) 244 , and a second light emitting light source for emitting light at a second wavelength, such as IR LED 246 .
- the emitter 216 emits light into the patient's tissue 240 at the wavelengths used to calculate the patient's physiological parameters, such as SpO 2 .
- the RED wavelength is between about 600 nm and about 700 nm
- the IR wavelength is between about 800 nm and about 1000 nm.
- each sensor may be configured to emit a single wavelength. For example, a first sensor emits only a RED light while a second only emits an IR light. In various embodiments, more than two wavelengths may be emitted by one or more emitters.
- the detector 218 is configured to detect the intensity of light at the two emitted wavelengths.
- light may enter the detector 218 after passing through the patient's tissue 240 .
- the detector 218 converts the intensity of the received light into an electrical signal.
- the light intensity is directly related to the absorbance and/or reflectance of light in the tissue 240 . That is, when more light at a certain wavelength is absorbed or reflected, less light of that wavelength is received from the tissue by the detector 218 .
- the detector 218 After converting the received light to an electrical signal, the detector 218 sends the signal to monitor 214 , where the microprocessor 248 may use algorithms and/or look-up tables to calculate physiological parameters (such as SpO 2 , respiration rate, respiratory effort, and pulse rate), based on the time-varying absorption of the light in the patient's tissue 240 .
- physiological parameters such as SpO 2 , respiration rate, respiratory effort, and pulse rate
- the encoder 242 may contain information about the sensor 212 , such as the type of sensor (for example, whether the sensor 212 is intended for placement on a forehead or digit) and the wavelengths of light emitted by the emitter 216 .
- the information may be used by the monitor 214 to select appropriate algorithms, lookup tables and/or calibration coefficients stored in the monitor 214 for calculating the patient's physiological parameters.
- the encoder 242 may contain information specific to the patient 240 , such as, for example, the patient's age, weight, and diagnosis.
- the encoder 242 may, for instance, be a coded resistor which stores values corresponding to the type of sensor 212 , and/or the wavelengths of light emitted by the emitter 216 , or the encoder 242 may include a memory on which such information is stored.
- User inputs 256 and display 220 may be used to enter information about the patient, such as age, weight, height, diagnosis, medications, treatments, and so forth.
- the monitor 214 may include a general-purpose microprocessor 248 connected to an internal bus 250 .
- the microprocessor 248 may be adapted to execute software, which may include an operating system and one or more applications, as part of performing the functions described herein.
- Also connected to the bus 250 may be a read-only memory (ROM) 252 , a random access memory (RAM) 254 , user inputs 256 , display 220 , and speaker 222 . Any suitable computer-readable media may be used in the system for data storage.
- a time processing unit (TPU) 258 may provide timing control signals to a light drive circuitry 260 , which controls when the emitter 216 is illuminated and multiplexed timing for the two LED's 244 and 246 .
- the TPU 258 may also control the gating-in of signals from detector 218 through an amplifier 262 and a switching circuit 264 . The signals are sampled at the proper time, depending upon which light source is illuminated.
- the received signal from the detector 218 may be passed through an amplifier 266 , a low pass filter 268 , and an analog-to-digital converter 270 .
- the digital data may then be stored in a queued serial module (QSM) 272 (or buffer) for later downloading to RAM 254 as QSM 272 fills up.
- QSM queued serial module
- FIG. 4A An example of a PPG signal obtained from a pulse oximeter (such as PPG system 102 , 200 , 210 ) is shown in FIG. 4A .
- the PPG signal may be output as a PPG waveform 10 which represents the absorption of light by the patient's tissue over time.
- the PPG waveform 10 includes cardiac pulses 12 , where absorption of light increases due to the increased volume of blood in the arterial blood vessel due to the cardiac pulse.
- Each cardiac pulse 12 may be identified based on a valley 14 , peak 16 , dichrotic notch 18 , and subsequent valley 14 .
- the cardiac pulse 12 includes an amplitude A measured at any suitable location along the pulse, such as along the upstroke of the pulse, from the preceding valley 14 to the peak 16 .
- the PPG waveform 10 includes a pulse period of duration D between adjacent pulses 12 .
- the duration D is shown measured from one peak 16 to an adjacent peak 16 , but may be measured between any suitable points along the pulses.
- the PPG waveform 10 also includes a baseline shift B indicating a baseline level of the light absorption, above which the waveform modulates due to arterial blood pulses.
- the baseline B may also be measured at any suitable point along the waveform 10 , such as at the valleys 14 , peaks 16 , or a median or mean value between the peaks and valleys.
- the PPG waveform 10 shown in FIG. 4A may be the output 108 of FIG. 1 .
- FIG. 4B A segment of a PPG waveform 10 during normal breathing, or attempts to breathe, is shown in FIG. 4B .
- the waveform 10 includes cardiac pulses 12 . It should be noted that the number of cardiac pulses 12 per breath is not necessarily to scale, and may vary from patient to patient. Respiration or attempted respiration (breathing in and out, or attempting to breathe) may cause one or more of three modulations in the PPG waveform 10 .
- the first modulation is a modulation of the baseline B of the PPG waveform 10 .
- the effect of the patient breathing in and out causes the baseline B of the waveform 10 to move up and down, cyclically, with the patient's respiration rate.
- the baseline shift is due in part to the shifting of venous blood at the peripheries during the respiratory cycle.
- the lowering of the thoracic pressure causes an increase in the driving pressure gradient from the peripheries to the heart. Relatively more blood is drained from the peripheries causing less light to be absorbed.
- the thoracic pressure increases, the pressure gradient reduces, and more blood begins to pool at the peripheries, causing more light to be absorbed.
- the baseline modulation waveform B may be tracked by following any component of the PPG waveform 10 , such as the peaks, valleys, dichrotic notches, median value, or other value. As shown in FIG. 4B , the baseline B 1 at one point in time is smaller than the baseline B 2 at a later time.
- the second respiration-induced modulation of the PPG is a modulation of the amplitude A.
- the amplitude A of each cardiac pulse 12 increases and decreases, with larger amplitudes (such as amplitude A 2 ) tending to coincide with the top of the baseline shift B, and smaller amplitudes (such as amplitude A 1 ) tending to coincide with the bottom of the baseline shift.
- the third modulation due to respiration is a modulation of the frequency or duration of the cardiac pulses 12 .
- This modulation may also be characterized in terms of the duration between pulses.
- D duration
- the frequency tends to decrease, with a longer duration D (such as duration D 1 in FIG. 4B ) between cardiac pulses 12 .
- the frequency tends to increase, with a shorter duration (such as duration D 2 ) between the cardiac pulses 12 .
- Each of these three modulations may be referred to as a respiratory component of the PPG signal, or a respiratory-induced modulation of the PPG signal.
- These three modulations are plotted in FIG. 4C , which shows the frequency modulation waveform D, the amplitude modulation waveform A, and the baseline modulation waveform B. These waveforms indicate the cyclical increase and decrease in these values (frequency, amplitude, and baseline) due to the patient's respiration. It should be noted that in any particular patient, one, two, or all three of these modulations may be present.
- a particular individual may exhibit only the baseline modulation, or only the amplitude modulation, or only the frequency modulation of the PPG, or a combination of two, or all three of these modulations.
- a respiratory component of the PPG includes any one of these respiratory-induced modulations of the PPG waveform 10 , or a combination of them.
- the apnea analysis module 106 and/or the PPG sub-system 102 may monitor the PPG waveform 10 for variations or modulations in one or more of the baseline modulation waveform B, the cardiac pulse amplitude modulation waveform A, and the cardiac pulse frequency waveform F (or duration D) to determine whether or not an individual is breathing properly. Additionally, the apnea analysis module 106 and/or the PPG sub-system 102 may monitor two or more of the above to determine a confidence level in the analysis. For example, if two or more of the respiratory components correlate with respect to the existence and rate of the variation or modulation (that is, the rate of modulation of the two or more components matches or closely matches), then a high degree of confidence in the analysis exists.
- the apnea analysis module may assess the degree of correlation or matching between the respiratory components in order to assess a degree of confidence, with a higher correlation indicating a higher confidence, and vice versa.
- the apnea analysis module 106 and/or the PPG sub-system 102 may output a confidence metric (such as high, moderate, or low) based on the agreement or lack of agreement between the three respiratory components.
- the respiratory component(s) of the PPG may be used to identify the patient's respiration rate (also known as pulmonary ventilation rate, respiratory rate, ventilation rate, or breathing frequency).
- respiration rate also known as pulmonary ventilation rate, respiratory rate, ventilation rate, or breathing frequency
- the period P of one or more of the waveforms A, B, and D may signify the patient's respiration rate.
- the amplitude of one or more of the waveforms A, B, and D may indicate a respiratory effort of the patient—that is, the effort exerted by the patient to breathe.
- an increase in the amplitude of one or more waveforms A, B, and D (marked “AMP-A”, “AMP-B”, and “AMP-D”, respectively) from a relative baseline may indicate that the patient has increased his or her effort to breathe, and a decrease in amplitude may indicate a decrease in the patient's effort to breathe.
- the amplitude(s) of the waveform(s) A, B, and/or D may be used to track a trend in the patient's respiratory effort.
- An increase in the respiratory rate may also indicate an increased respiratory effort by the patient.
- the PPG sub-system 102 and/or the apnea analysis module 106 outputs a respiratory rate signal and/or a respiratory effort signal that tracks these parameters over time.
- the PPG sub-system 102 may detect and determine the respiration rate of an individual, as described in United States Patent Application Publication No. 2011/0071406, entitled “Determining a Characteristic Respiration Rate,” which is hereby incorporated by reference in its entirety.
- the PPG sub-system 102 may be used to detect and determine the respiration rate and/or the respiratory effort of an individual, as described in U.S. application Ser. No. 13/867,291, entitled “System and Method for Determining Respiratory Parameters From Blood Flow Signals,” which is also hereby incorporated by reference in its entirety.
- the output 108 from the PPG sub-system 102 may include one or more of the PPG waveform 10 , the respiratory component waveforms A, B, and D, a respiratory rate signal, a respiratory effort signal, and combinations of these.
- the PPG waveform 10 may be a raw signal from the PPG sensor indicating light absorbance over time, or may be a filtered and processed waveform with filtering steps such as noise reduction, artifact removal, etc.
- the PPG sub-system 102 such as the PPG sub-system 200 , provides the PPG signal or output 108 to the apnea analysis module 106 .
- the capnographic sub-system 400 is an example of a breath detection sub-system 104 , as shown in FIG. 1 .
- the capnographic sub-system 400 is used to detect respiration of an individual and provide a breath output, such as the breath output 110 (shown in FIG. 1 ) to the apnea analysis module 106 .
- the breath detection sub-system includes a breath-sampling interface (such as nasal prongs, a gas sampling mask, or the like) configured to be connected to the individual.
- the signal or output 110 of the breath detection sub-system 104 may be a breath waveform, such as a capnographic waveform, as described below.
- the output 110 may be a pressure signal, moisture signal, temperature signal, acoustic signal, or the like, detected and sent from a corresponding breath detection sub-system 104 that is operatively connected to an individual.
- a pressure transducer may be positioned proximate to a mouth or airway of the individual and, through cyclical changes in airflow pressure, may indicate exhaled breath.
- a temperature or moisture sensor may indicate exhaled breath through cyclical temperature or moisture changes of exhaled airflow.
- an acoustic sensor such as a microphone, proximate to a mouth or an airway may detect exhaled breath through cyclical changes in acoustic signals within the mouth or airway.
- FIG. 5A An embodiment of a capnographic sub-system 400 is shown in FIG. 5A .
- Samples of the breath of a patient are drawn through a sampling tube 412 into a gas analyzer 414 .
- the gas analyzer 414 analyzes the patient's breath for CO 2 content, and an electronic output signal is generated, such as waveform 415 , corresponding to the instantaneous concentration levels of CO 2 in the individual's breath.
- the analog CO 2 waveform signals 415 generated by the gas analyzer 414 may be input into a digitizer 416 , such as an A/D converter, where the analog signals are converted into a serial digital train of data for processing.
- a digitizer 416 such as an A/D converter
- the signal processing unit 418 may be controlled by a general-purpose microprocessor 420 .
- the digital waveform signals may be input into a parameter extraction unit 422 , where the shape of each waveform is analyzed, and morphology parameters of the waveform are extracted.
- the parameters extracted in the parameter extraction unit 422 may be stored as a matrix, which is input into a parameter comparison unit 424 .
- the parameter comparison unit 424 compares the matrix to a reference matrix from a reference set stored in the parameter bank 426 .
- the reference matrix includes parameters of a typical breath waveform obtained from a normal subject.
- the waveform parameter extraction unit 422 may also output a continuous data stream corresponding to the parameters obtained from a sequence of breath waveforms.
- the serial values of the parameters may be input into a trend storage unit 432 , and on demand, into a trend analyzing unit 434 where any long term trend is detected in the value of any of the parameters selected. Any long term trend is compared in the trend analyzing unit 434 with reference trends stored in the trend bank 436 . The establishment of any abnormality in the observed trend may result in the output of an informative message to the operator on the output diagnosis display device 428 .
- the capnographic sub-system 400 may be programmed to actuate an audible or visible alarm 429 based on recognized emergency or alert conditions.
- FIG. 5B illustrates a capnograph waveform 500 obtained from a normal healthy subject, according to an embodiment of the present disclosure.
- a baseline 540 shows a close-to-zero value of the partial pressure of carbon dioxide, PCO 2 , unless partial rebreathing is present.
- PCO 2 remains close to zero as gas from the anatomical dead space leaves the airway.
- the capnograph waveform 500 then rises sharply along leg 542 as alveolar gas mixes with dead space gas, until the alveolar plateau 544 is reached.
- the alveolar plateau 544 is maintained until the end of the exhalation phase, with the value of PCO 2 rising gradually during the whole of the plateau, up to the end tidal value (EtCO 2 ) 546 .
- the end tidal value 546 occurs at the onset of the inhalation phase, during which the value of PCO 2 shows a sharp fall along leg 548 back to its virtually zero value at the baseline 540 .
- the close-to-zero value of PCO 2 at the end of the inspiration phase is known as the fractional inspired value FiCO 2 .
- the angle between the alveolar rise 542 and the alveolar plateau 544 is known as the angle ⁇ , and is normally in a range between approximately 100° and approximately 110°.
- the angle ⁇ is determined primarily by the V/Q (ventilation/perfusion) status of the lungs.
- COPD chronic obstructive pulmonary disease
- the alpha angle is thus a widely used parameter for a first hand assessment of the patient's overall pulmonary state.
- An alternative parameter that may be used for determining the general pulmonary state of the patient is the overall rate of rise of PCO 2 , which is determined by dividing the maximum value of PCO 2 achieved in the waveform, by the time taken from the start of exhalation to the achievement of the maximum value 546 of PCO 2 .
- the 10% and 90% points of the values of PCO 2 may be used for the calculation.
- the nearly 90° angle between the alveolar plateau 544 and the descending limb 548 of the capnograph waveform 500 is known as the ⁇ angle.
- the ⁇ angle increases as the degree of rebreathing increases.
- the various parts of the capnographic waveform 500 are known as the phases of the waveform, the alveolar rise phase I, the alveolar plateau phase II, and the inhalation descent, phase III, as indicated in FIG. 5B .
- the capnographic sub-system 400 and the capnographic waveform 500 are further described in U.S. Pat. No. 6,428,483, entitled “Waveform Interpreter for Respiratory Analysis,” which is hereby incorporated by reference in its entirety. Additionally, the capnographic sub-system 400 may be configured and operate as described in United States Patent Application Publication No. 2011/0066061, entitled “Wireless Capnography,” or United States Patent Application Publication No. 2011/0098592, entitled “Methods, Apparatus and Systems for Monitoring CO2,” both of which are hereby incorporated by reference in their entireties.
- one or more of the PPG sub-system 102 , the breath detection sub-system 104 , the apnea analysis module 106 , and the display 107 may be separate physical components, or one or more of them may be combined together within a workstation, computer, tablet, smartphone, handheld device, integrated housing, monitor, smart cable, adapter, or other hardware component.
- Such components may include standard computer hardware, such as processors, circuitry, and memory, and may be connected to a display, such as a liquid crystal display (LCD), light-emitting diode (LED) display, touch screen, or other known displays. Connections between the various components may be through wired cables or wireless connections.
- LCD liquid crystal display
- LED light-emitting diode
- the system 100 may include any suitable computer-readable media used for data storage.
- the apnea analysis module 106 may include computer-readable media.
- the computer-readable media are configured to store information that may be interpreted by the apnea analysis module 106 .
- the information may be data or may take the form of computer-executable instructions, such as software applications, that cause a microprocessor or other such control unit within the apnea analysis module 106 to perform certain functions and/or computer-implemented methods.
- the computer-readable media may include computer storage media and communication media.
- the computer storage media may include volatile and non-volatile media, removable and non-removable media implemented in any method or technology for storage of information such as computer-readable instructions, data structures, program modules or other data.
- the computer storage media may include, but are not limited to, RAM, ROM, EPROM, EEPROM, flash memory or other solid state memory technology, CD-ROM, DVD, or other optical storage, magnetic cassettes, magnetic tape, magnetic disk storage or other magnetic storage devices, or any other medium which may be used to store desired information and that may be accessed by components of the system.
- a display screen 600 of the apnea analysis system is shown in FIG. 6 .
- the display screen 600 displays the outputs 110 and 108 from the breath-detection and PPG sub-systems, respectively.
- the output 108 from the PPG sub-system includes a respiratory component waveform 602 from a PPG signal.
- the respiratory component waveform 602 represents one or more respiratory components of the PPG signal, as described above with respect to FIGS. 4A-C .
- the respiratory component waveform 602 may include the amplitude modulation A, baseline modulation B, or frequency (or duration) modulation F of the PPG, or a combination of these modulations.
- a combination of the modulations may include an average of one or more of the waveforms, a weighted average, or other combination.
- the waveforms may be shifted in phase so that they are in phase with each other before averaging.
- the respiratory component waveform 602 shows modulations, it may be inferred that the patient is breathing or trying to breathe, and when these modulations disappear from the waveform 602 , it may be inferred that the patient has stopped breathing or trying to breathe.
- the output 108 may be the PPG signal or waveform (such as PPG waveform 10 in FIG. 4B ), and the apnea analysis module may derive the respiratory component of the PPG from the PPG signal.
- the output 110 from the breath detection system includes a capnographic waveform 604 from a breath signal.
- the capnographic waveform 604 shows modulations, it may be inferred that the patient is actually inhaling and exhaling, and when these modulations disappear from the waveform 604 , it may be inferred that the patient has stopped breathing.
- the respiratory component waveform 602 and the breath waveform 604 may be substantially synchronized with one another and displayed over substantially the same time.
- the respiration rate signal and/or the respiration effort signal derived from the PPG signal may be displayed as waveforms on the display screen 600 , instead of or in addition to the respiratory component waveform 602 .
- the display 600 shows both the respiratory component waveform 602 and the breath waveform 604 .
- the apnea analysis module compares the two waveforms to determine whether the patient is attempting to breathe and/or breathing normally (non-apneic breathing). In the embodiment of FIG. 6 , both the waveforms 602 and 604 indicate normal breathing.
- the respiratory component waveform 602 includes a modulating segment, and does not include an attenuated segment. The presence of a modulating segment in the respiratory component waveform 602 indicates that the patient's respiration is being detected in the PPG signal, due to one or more modulations of the PPG signal caused by respiration.
- the breath waveform 604 also includes a modulating segment and no attenuated segment, which indicates that CO 2 is being detected in the patient's exhalation.
- the presence of modulating segments in both waveforms indicates that the patient is attempting to breathe and is in fact inhaling and exhaling.
- the apnea analysis module 106 analyzes the waveform to detect the presence of a modulating segment in the waveform.
- a modulating segment is a segment having portions moving up and down, optionally in a generally repeating or cyclical manner.
- a modulating segment has fluctuations with a nonzero amplitude.
- the apnea analysis module identifies the amplitude of the waveform (such as amplitude A 1 or A 2 in FIG. 6 ) and compares it to a range or threshold.
- a range or threshold of amplitudes for each waveform 602 , 604 may be defined as a normal range, indicating normal breathing. If modulations are large enough to give the waveform an amplitude within the defined range, or above the defined threshold, then the apnea analysis module determines that the waveform indicates normal breathing or effort to breathe.
- a lower threshold for the amplitude(s) AMP-A, AMP-B, AMP-F (see FIG. 4C ), or a combination of these amplitudes may be set, and the apnea analysis module 106 calculates the amplitude of the waveform 602 and compares it to the threshold. If the amplitude remains above the threshold, the system determines that the respiratory component of the PPG indicates that the patient is breathing or attempting to breathe. Similarly, a range or threshold may be defined for the breath waveform 604 .
- the apnea analysis module determines that the patient is actually breathing.
- the ranges or thresholds identifying normal breathing and/or regular respiration rate and/or effort in the various signals may be pre-defined and calibrated. As an example, clinical studies of healthy individuals during normal breathing, and/or a patient's particular history of normal breathing, may establish a range of normal breathing, respiration rate, and effort.
- a modulating segment of a waveform may be identified in other ways, such as by assessing the slope and frequency of upstroke portions of the waveform, or by using a Fourier transform method (such as a short-time Fourier transform) or a wavelet method.
- a Fourier transform method such as a short-time Fourier transform
- a flat-line or attenuated segment of a waveform refers to a portion that lacks modulations.
- An attenuated segment may be flat or substantially flat, exhibit an absence or reduction of modulations, variations, or fluctuations, or have a zero, near-zero, or non-fluctuating first derivative.
- an attenuated segment is identified when the amplitude is below the threshold, or outside of the range, that is correlated with normal breathing or a presence of effort to breathe (as discussed above).
- an attenuated segment may be identified in relation to a modulating segment.
- an attenuated segment may be identified as having a reduced amplitude compared to a segment representative of normal breathing.
- an attenuated segment may have an amplitude that is 0%-30% of the amplitude of a normal breathing segment.
- an attenuated segment may be identified as a segment with an amplitude that is below 20%, or below 30%, or below 40% of the amplitude of a normal breathing waveform.
- An attenuated segment may have an amplitude of modulation that is noticeably different than that of other segments of the waveform that are representative of normal breathing.
- a display screen 700 according to an embodiment is shown in FIG. 7 .
- the respiratory component waveform 702 includes a modulating segment 708
- the breath waveform 704 includes an attenuated segment 710 .
- the attenuated segment 710 in the breath signal 704 indicates that the breath detection sub-system is not detecting active exhalation from the subject. That is, the subject may not be breathing.
- the respiratory component waveform 702 continues to include modulations in segment 708 , induced by respiration. This comparison of the two signals indicates that the patient is attempting to breathe, but is not successfully breathing (for example, is unable to exhale breath). Based on this comparison, the apnea analysis module 106 identifies an apnea event and categorizes it as obstructive apnea.
- the apnea analysis module also checks the SpO 2 value of the patient. If the SpO 2 value remains high (above a threshold), and does not begin to drop, this indicates that the patient is still receiving oxygen. As a result, based on the absence of breaths in the breath signal (in segment 710 ), the presence of breaths in the respiratory component of the PPG signal (in segment 708 ), and the high, stable SpO 2 value, the apnea analysis module determines that the breath-sampling interface from the breath detection system is not connected to the patient, and generates a breath sensor-off message or alert.
- the apnea analysis module also monitors the amplitude of the respiratory component waveform 702 for an increase compared to a threshold or historical values (for example, a 20% increase).
- An increase in the amplitude of the waveform 702 may indicate an increased effort to breathe. If such an increased respiratory effort coincides with the attenuated portion 710 of the breath waveform 704 , the apnea analysis module may determine that obstructive apnea is present due to the patient's increased effort to breathe, and no successful breath. The apnea analysis module may then activate an alert or alarm display, message, or sound.
- a display screen 800 according to an embodiment is shown in FIG. 8 .
- the respiratory component waveform 802 and the breath waveform 804 both include attenuated segments 806 and 808 , respectively, at a corresponding time.
- the attenuated segment 806 in the respiratory component waveform 802 indicates that the PPG signal is no longer exhibiting modulations due to respiration. This indicates that the patient is no longer attempting to breathe.
- the attenuated segment 808 in the breath waveform 804 indicates that the breath detection system is no longer detecting exhaled CO 2 from the patient. This indicates that the patient is no longer breathing.
- the apnea analysis module Based on this comparison of the outputs from the two sub-systems, the apnea analysis module identifies an apnea event and categorizes it as central apnea.
- the apnea analysis module also checks the PPG signal for the presence of cardiac pulses 811 . If cardiac pulses 811 continue to be present in the PPG signal, then the system determines that the PPG sensor is still properly positioned on the patient, and thus the attenuated segment 806 is likely due to apnea rather than a sensor-off condition. While not shown in FIGS. 6 and 7 , the display screens 600 and 700 may also display the pulsatile component of the PPG waveform, such as shown in FIGS. 8 and 9 .
- a display screen 900 according to an embodiment is shown in FIG. 9 .
- the apnea analysis system determines that the PPG sensor is not properly positioned on the patient.
- the respiratory component waveform 902 includes an attenuated segment 906
- the breath waveform 904 includes a modulating segment.
- the PPG waveform 910 includes an attenuated segment 912 , devoid of cardiac pulses 911 . Because the breath waveform indicates that the patient is still successfully breathing, the lack of both cardiac and respiratory modulations in the PPG signal indicates that the sensor has fallen off the patient, rather than indicating that cardiac and respiratory activity has stopped. Accordingly, the apnea analysis module 106 displays a PPG sensor-off alert or message on the display 107 .
- the apnea analysis module 106 is able to identify and classify a type of apnea based on a comparison of the respiratory component of the PPG waveform with the breath waveform.
- the apnea analysis module may also consider the PPG waveform, SpO 2 value, respiration effort, and/or other inputs. The apnea analysis module may accomplish this comparison by referring to a logic table, as described below.
- FIG. 10 illustrates a logic table 1000 that may be used with an apnea analysis system and method, according to an embodiment of the present disclosure.
- the table 1000 includes a breath waveform column 1002 , an SPO 2 column 1004 , a respiration column 1006 , a respiratory effort column 1008 , and a condition column 1010 .
- the logic shown in the table 1000 may be used by the apnea analysis module 106 shown in FIG. 1 .
- the breath waveform column 1002 indicates a presence or absence of exhaled breath, as determined from the output 110 from the breath detection system.
- the SpO 2 column includes an SpO 2 value, as determined from the PPG signal, or an indication of whether the SpO 2 value is within a range or above or below a threshold.
- the SPO 2 value may be used as a further analytical tool for apnea analysis. If an individual is breathing, oxygen is provided to the blood, and the oxygen saturation value remains at a normal level.
- An oxygen saturation level may be chosen as a threshold for apnea detection. For example, in an embodiment, the threshold is 85%. However various other SPO 2 levels may be used. For example, the threshold may be 80%, 90%, or 95%.
- the oxygen saturation value, and in particular whether it is above or below a designated threshold may be used as one of several input factors to determine whether the patient is breathing normally.
- the respiration column 1006 includes an indication of the presence or absence of respiration from a respiratory component of the PPG signal.
- the respiratory effort column indicates a normal, high, or diminished respiratory effort, as determined from a respiratory component of the PPG signal.
- a “normal” respiratory effort may be determined by a physician, clinician, or the like. For example, the user may set a normal respiratory effort as between a particular low threshold percentage and a particular high percentage in relation to a calibrated PPG waveform. As an example, normal respiratory effort may be between 50% and 150% of a pre-calibrated normal respiratory effort signal derived from the PPG signal 108 . As another example, respiratory effort may be identified as high based on an increase in amplitude of the respiratory component of the PPG as compared to a baseline. However, the normal respiratory effort may be between percentages that are greater or less than those noted.
- the first row of the logic table indicates breaths present, SpO 2 above a specified threshold, respiration present, and respiration effort normal. Based on these inputs, the apnea analysis module determines that the individual is breathing normally, that is, regular respiration.
- the second row of the logic table indicates that breaths are absent, SpO 2 is above the threshold, respiration is not detected from the PPG waveform, and respiration effort is not detected.
- the apnea analysis module 106 determines the existence of an initial stage of central apnea.
- the initial stage of central apnea may become a long term central event or transition into a mixed apnea. In such a scenario, the apnea analysis module 106 may generate an alarm.
- the third row of the logic table indicates that breaths are absent, the SpO 2 value is below the threshold (or the SpO 2 value is dropping and the rate of change of the SpO 2 value is above a threshold, indicating a rapid drop), and respiration and respiratory effort are not detected.
- the apnea analysis module 106 determines the existence of a long term or severe central apnea. Accordingly, the apnea analysis module 106 may generate a corresponding alarm. The alarm for the long term or severe central apnea may be more urgent than that for the initial stage of central apnea.
- the alarm may be louder and/or a different color or flashing, as compared to the alarm for the initial stage of central apnea.
- the apnea analysis module 106 may differentiate alarms based on the severity of the apnea that is detected.
- the apnea analysis module 106 determines that obstructive apnea is present. As such, the apnea analysis module 106 may generate an appropriate alarm indicating obstructive apnea.
- the apnea analysis module 106 may determine that the breath sensor or probe is disconnected (e.g., a “probe off” condition), and generate an appropriate alarm or notification.
- the apnea analysis module determines the presence of apnea, and identifies the apnea as a mixed apnea. The module may provide an alarm, and may increase the severity of the alarm if the apnea event continues.
- FIG. 11 illustrates a logic table 1100 that may be used with an apnea analysis system and method, according to an embodiment of the present disclosure.
- the table 1100 includes a breath waveform column 1102 , a PPG waveform column 1104 , and a response column 1106 .
- the logic shown in the table 1100 may be used by the apnea analysis module 106 shown in FIG. 1 .
- breaths are detected in the breath waveform, but not in the PPG waveform (such as through a lack of respiration rate and respiratory effort).
- the apnea analysis module 106 may determine that the PPG sensor is disconnected from the patient.
- the apnea analysis module may display the exhaled CO 2 and the respiration rate values derived from the breath waveform, and generate an appropriate sensor-off alarm.
- breaths are absent from the breath output 110 and the PPG output 108 .
- the apnea analysis module 106 may generate a high priority apnea alarm.
- the apnea alarm may indicate central apnea and may include a message stating “no breath for ss seconds,” in which “ss” is a particular number of seconds since the last detected breath.
- breaths are absent from the breath output 110 , but the PPG sub-system 102 provides a PPG output 108 in which the SPO 2 level is above a threshold (such as 85%), and breaths are detected (such as from one or more respiratory components of the waveform). Based on these inputs, the apnea analysis module determines that the breath detection sensor is not properly positioned. No breaths are detected, but the SpO 2 level remains above a threshold, which indicates that the patient is continuing to receive oxygen.
- a threshold such as 85%
- the system generates a medium priority alarm, which may recite, for example, “check for possible obstruction or CO 2 patient interface.”
- the patient interface may be nasal prongs or a face mask of a mainstream or sidestream breath sampling device of a capnographic sub-system.
- the apnea analysis module 106 may determine an obstructive apnea event, and may generate a high priority alarm, which may recite, for example, “apnea for ss seconds.”
- FIG. 12 illustrates a logic table 1200 that may be used with an apnea analysis system and method, according to an embodiment of the present disclosure.
- the table 1200 includes a breath waveform column 1202 , a respiration rate column 1204 , a respiratory effort column 1206 , and a response column 1208 .
- the respiration rate and effort columns are derived from a respiratory component of the PPG waveform.
- the logic shown in the table 1200 may be used by the apnea analysis module 106 shown in FIG. 1 .
- the apnea analysis module 106 displays the calculated signals derived from the breath waveform, and determines that the PPG sensor is disconnected from the patient. The module may also generate an appropriate alarm.
- the apnea analysis module 106 may generate a high priority apnea alarm identifying central apnea.
- the apnea analysis module 106 identifies a possible obstructive apnea condition and generates a medium priority alarm, such as “check for possible obstruction.”
- the apnea analysis module 106 based on the same inputs but a decreasing SpO 2 , the apnea analysis module 106 identifies an obstructive apnea condition and generates a heightened priority alarm, such as “check for possible obstruction” as well as an alert regarding a low or dropping SPO 2 level.
- the respiratory effort is unchanged, instead of increased, and the SpO 2 level is above a threshold.
- the apnea analysis module 106 determines that the breath interface is no longer connected to the patient, and generates a medium priority alarm, such as “check breath interface.” That is, when the PPG sub-system 102 detects otherwise normal breathing, but the breath detection sub-system 104 does not detect breath, then the apnea analysis module 106 may determine that a breath interface, such as a sampling tube, is no longer operatively connected to an individual.
- the apnea analysis module 106 Based on the same inputs but a decreasing SpO 2 , the apnea analysis module 106 generates a medium priority alarm, such as “check breath interface.”
- the apnea analysis module 106 may generate various alarms of increasing priority depending on the nature of the breathing status of the individual. The alarms may be tiered based on the type of condition detected. For example, the apnea analysis module 106 may generate a highest urgency alarm when central apnea is detected and correlated with an SPO 2 level below a threshold. The highest urgency alarm may be associated with flashing colors and an audio signal (such as beep or buzz or other alarm) at the highest volume. Obstructive apnea may cause the apnea analysis module 106 to generate a high priority alert, which may be defined by flashing text on a screen, and/or an audio signal of increasing volume. A probe or interface off condition may cause the apnea analysis module 106 to generate a medium priority alert, which may be defined by text on a screen, and/or an audio signal.
- a probe or interface off condition may cause the apnea analysis module 106 to generate a medium priority alert, which may
- the apnea analysis module 106 may determine and classify apnea by comparing a respiratory component of the PPG signal or output 108 with the breath signal or output 110 , such as a capnograph breath waveform.
- the apnea analysis module 106 may use probability density estimates calculated, for example, using non-parametric Bayesian estimates, neural networks, or any suitable method of hetero-associative function estimation to determine the respiratory status (for example, normal breathing, central apnea, obstructive apnea, or mixed apnea) of the individual.
- the apnea analysis module 106 may employ rule based systems and adaptive rule based systems such as propositional logic, predicate calculus, and/or modal, non-monotonic or fuzzy logics, for example.
- the apnea analysis module 106 may use logic tables, as described above.
- the apnea analysis module 106 may determine that the individual is experiencing mixed apnea if episodes of obstructive and central apnea occur within a predetermined period of time. For example, if obstructive apnea and central apnea are detected within one minute of each other, the apnea analysis module 106 may determine that the individual is experiencing mixed apnea. In other embodiments, the time window for determination of mixed apnea may be greater or less than one minute, such as, for example, 30, 40, 50, 70, 80, 90, or 120 seconds.
- FIG. 13 illustrates a flow chart of a method of operating an apnea analysis system, according to an embodiment of the present disclosure.
- a PPG signal is provided to an apnea analysis module.
- a PPG sub-system such as a pulse oximeter, may provide a PPG signal in the form of a PPG waveform to the apnea analysis module.
- the PPG sub-system may provide a respiratory component of the PPG signal to the apnea analysis module.
- a breath signal is provided to the apnea analysis module.
- a capnographic sub-system may provide a breath signal in the form of a capnographic waveform to the apnea analysis module.
- a breath it is determined whether a breath is present in the breath signal. If breath is present, the process continues to 1310 , where it is determined whether a respiratory component (such as a baseline modulation, amplitude modulation, frequency modulation, or calculated parameter such as respiration rate and/or respiratory effort), is present in the PPG signal at a corresponding time. If a respiratory component is present, the process continues to 1312 , where it is determined that the individual is breathing normally. If a respiratory component is not present, the process continues to 1314 , where a PPG probe-off condition is signaled.
- a respiratory component such as a baseline modulation, amplitude modulation, frequency modulation, or calculated parameter such as respiration rate and/or respiratory effort
- the process continues to 1316 , where it is determined whether a respiratory component is present in the PPG signal at a corresponding time. If the respiratory component is present, then the process continues to 1318 , where it is determined that the individual is experiencing obstructive apnea. If, however, the respiratory component is not present, then the process continues to 1320 , where it is determined that the individual is experiencing central apnea.
- Embodiments of the present disclosure provide systems and methods of detecting and classifying apnea events as central, obstructive, or mixed, for example, based on a reduction in a breath signal or respiratory signal, and a corresponding status of the other signal. Determining the type of apnea guides appropriate and timely medical interventions.
- Various embodiments described herein provide a tangible and non-transitory (for example, not an electric signal) machine-readable medium or media having instructions recorded thereon for a processor or computer to operate a system to perform one or more embodiments of methods described herein.
- the medium or media may be any type of CD-ROM, DVD, floppy disk, hard disk, optical disk, flash RAM drive, or other type of computer-readable medium or a combination thereof.
- the various embodiments and/or components also may be implemented as part of one or more computers or processors.
- the computer or processor may include a computing device, an input device, a display unit and an interface, for example, for accessing the Internet.
- the computer or processor may include a microprocessor.
- the microprocessor may be connected to a communication bus.
- the computer or processor may also include a memory.
- the memory may include Random Access Memory (RAM) and Read Only Memory (ROM).
- the computer or processor may also include a storage device, which may be a hard disk drive or a removable storage drive such as a floppy disk drive, optical disk drive, and the like.
- the storage device may also be other similar means for loading computer programs or other instructions into the computer or processor.
- the term “computer” or “module” may include any processor-based or microprocessor-based system including systems using microcontrollers, reduced instruction set computers (RISC), application specific integrated circuits (ASICs), logic circuits, and any other circuit or processor capable of executing the functions described herein.
- RISC reduced instruction set computers
- ASICs application specific integrated circuits
- the above examples are exemplary only, and are thus not intended to limit in any way the definition and/or meaning of the term “computer” or “module.”
- the computer or processor executes a set of instructions that are stored in one or more storage elements, in order to process data.
- the set of instructions may include various commands that instruct the computer or processor as a processing machine to perform specific operations such as the methods and processes of the various embodiments of the subject matter described herein.
- the set of instructions may be in the form of a software program.
- the software may be in various forms such as system software or application software. Further, the software may be in the form of a collection of separate programs or modules, a program module within a larger program or a portion of a program module.
- the software also may include modular programming in the form of object-oriented programming.
- the processing of input data by the processing machine may be in response to user commands, or in response to results of previous processing, or in response to a request made by another processing machine.
- the block diagrams of embodiments herein illustrate one or more modules.
- the modules represent circuit modules that may be implemented as hardware with associated instructions (e.g., software stored on a tangible and non-transitory computer readable storage medium, such as a computer hard drive, ROM, RAM, or the like) that perform the operations described herein.
- the hardware may include state machine circuitry hard wired to perform the functions described herein.
- the hardware may include electronic circuits that include and/or are connected to one or more logic-based devices, such as microprocessors, processors, controllers, or the like.
- the modules may represent processing circuitry such as one or more field programmable gate array (FPGA), application specific integrated circuit (ASIC), or microprocessor.
- the circuit modules in various embodiments may be configured to execute one or more algorithms to perform functions described herein.
- the one or more algorithms may include aspects of embodiments disclosed herein, whether or not expressly identified in a flowchart or a method.
- ⁇ As used herein, the terms “software” and “firmware” are interchangeable, and include any computer program stored in memory for execution by a computer, including RAM memory, ROM memory, EPROM memory, EEPROM memory, and non-volatile RAM (NVRAM) memory.
- RAM random access memory
- ROM memory read-only memory
- EPROM memory erasable programmable read-only memory
- EEPROM memory electrically erasable programmable read-only memory
- NVRAM non-volatile RAM
Abstract
An apnea analysis system may include a photoplethysmographic (PPG) sub-system, a breath detection sub-system, and an apnea analysis module. An apnea analysis system includes a photoplethysmographic (PPG) sub-system, a breath detection sub-system, and an apnea analysis module. The PPG sub-system is configured to be operatively connected to an individual and output a PPG signal from the individual. The breath detection sub-system is configured to be operatively connected to the individual and output a breath signal from the individual. The apnea analysis module is in communication with the PPG sub-system and the breath detection sub-system. The apnea analysis module analyzes the breath signal and a respiratory component of the PPG signal and, based on the analysis, identifies a presence of apnea, differentiates between obstructive apnea and central apnea, and provides an indication of the identified apnea.
Description
Embodiments of the present disclosure generally relate to physiological signal processing and, more particularly, to an apnea analysis system and method, such as may be used to detect and classify types of apnea.
Capnography represents a system and method of monitoring and displaying carbon dioxide (CO2) level(s), CO2 waveform(s), and/or other CO2 related parameters, such as End Tidal CO2 (EtCO2), or a concentration or partial pressure of CO2, from an entire inhalation and exhalation respiratory cycle of an individual. A typical capnographic system generates waveforms and numeric values of an individual's respiratory cycle, and may be used to identify adverse ventilation events.
Apnea may be detected using a capnographic system. For example, if a capnograph indicates that no exhaled CO2 is present, then apnea may be present. However, a typical capnographic system is unable to differentiate between types of apnea. Instead, a typical capnographic system is generally only able to indicate that apnea exists. Because the specific type of apnea may not be readily determined through analysis of a capnographic signal or waveform, proper diagnosis and treatment may be hindered.
Embodiments of the present disclosure generally relate to physiological signal processing and, more particularly, to an apnea analysis system and method, such as may be used to detect and classify types of apnea. In an embodiment, a monitoring system receives a photoplethysmographic (PPG) signal from a PPG sensor, and a breath signal from a breath sensor, and analyzes the two signals to determine if the patient is breathing normally. The system analyzes the PPG signal to determine whether the patient is breathing or attempting to breathe. This analysis is based on the identification of a respiratory component of the PPG signal, as discussed below. The system also analyzes the breath signal to determine if the patient is actually breathing. The system then compares these two signals to determine if the patient is experiencing apnea, and to differentiate between obstructive apnea and central apnea. In various embodiments, the system also identifies probe-off conditions for both the PPG sensor and the breath sensor, based on the comparison of the two signals.
In an embodiment, an apnea analysis system includes a photoplethysmographic (PPG) sub-system, a breath detection sub-system, and an apnea analysis module. The PPG sub-system is configured to be operatively connected to an individual and output a PPG signal from the individual. The breath detection sub-system is configured to be operatively connected to the individual and output a breath signal from the individual. The apnea analysis module is in communication with the PPG sub-system and the breath detection sub-system. The apnea analysis module analyzes the breath signal and a respiratory component of the PPG signal and, based on the analysis, identifies a presence of apnea, differentiates between obstructive apnea and central apnea, and provides an indication of the identified apnea.
In an embodiment, an apnea analysis method includes receiving a photoplethysmographic (PPG) signal indicative of a cardiac status of an individual, and receiving a breath signal indicative of a breathing status of the individual. The method identifies a respiratory component of the PPG signal indicative of a respiration effort or a respiration rate, and compares the breath signal and the respiratory component of the PPG. The method also includes identifying a presence of apnea, and differentiating between obstructive apnea and central apnea, based on the comparison.
In an embodiment, a tangible and non-transitory computer readable medium includes one or more sets of instructions configured to direct a computer to analyze a respiratory component of a PPG signal and a breath signal to detect whether or not an individual is experiencing apnea. The instructions also include differentiating between obstructive apnea and central apnea based on the analysis of the respiratory component of the PPG signal and the breath signal.
In an embodiment, a system for classifying an apnea includes a PPG sub-system, a breath detection sub-system, and an apnea analysis module. The PPG sub-system is configured to output a first signal indicative of a respiratory component of a PPG signal from a patient over a time period. The breath detection sub-system is configured to output a second signal indicative of a presence of breaths from the patient over the time period. The apnea analysis module is configured to identify and classify an apnea based on the first and second signals.
In an embodiment, a system for classifying an apnea includes at least one processor configured to receive a breath signal and a respiratory rate or effort signal, identify a reduction in one of the breath signal or the respiratory rate or effort signal over a time period, identify a corresponding status of the other of the breath signal or the respiratory rate or effort signal over at least a portion of the time period, and classify a type of apnea based on the reduction in the one of the breath signal or the respiratory rate or effort signal and the corresponding status of the other of the breath signal or the respiratory rate or effort signal.
Certain embodiments of the present disclosure provide a tangible and non-transitory computer readable medium that includes one or more sets of instructions configured to direct a computer to analyze a PPG signal received from a PPG sub-system and a breath signal received from a breath detection sub-system to detect whether or not an individual is experiencing apnea, and differentiate between obstructive apnea, central apnea, and a combination of obstructive apnea and central apnea based on the analysis of the PPG signal and the breath signal.
Embodiments of the present disclosure generally relate to physiological signal processing and, more particularly, to an apnea analysis system and method, such as may be used to detect and classify types of apnea. In an embodiment, a monitoring system receives a photoplethysmographic (PPG) signal from a PPG sensor, and a breath signal from a breath sensor, and analyzes the two signals to determine if the patient is breathing normally. The system analyzes the PPG signal to determine whether the patient is breathing or attempting to breathe. This analysis is based on the identification of a respiratory component of the PPG signal, as discussed below. The system also analyzes the breath signal to determine if the patient is actually breathing. The system then compares these two signals to determine if the patient is experiencing apnea, and to differentiate between obstructive apnea and central apnea. In various embodiments, the system also identifies probe-off conditions for both the PPG sensor and the breath sensor, based on the comparison of the two signals.
Apnea is the cessation or significant decrease in respiration or airflow by an individual. Obstructive apnea (or obstructive sleep apnea) is apnea in the presence of respiratory effort. That is, obstructive apnea is generally indicated by the existence of an effort to breathe, but with decreased or no actual breath exhalation. For example, an individual may try to breathe, as evident by chest movement, but the individual produces no actual breath. Such a situation may exist when the individual's airway is constricted or blocked.
Central apnea, or central sleep apnea, is apnea without respiratory effort. During central apnea, an individual may stop breathing, and may exhibit no effort or drive to breathe. Unlike obstructive apnea, with central apnea there is generally no chest movement or struggling. Central apnea may be characterized by an imbalance of respiratory control centers within the brain. Blood and carbon dioxide levels, and the neurological feedback mechanism that monitors them, may not react quickly enough to maintain an even respiratory rate. The basic neurological controls for breathing malfunction and fail to provide the signal to inhale, causing the individual to miss one or more cycles of breathing. If the pause in breathing is long enough, the percentage of oxygen in the individual's circulation may drop to a lower than normal level (hypoxaemia) and the concentration of carbon dioxide may build to a higher than normal level (hypercapnia). In turn, the conditions of hypoxaemia and hypercapnia may trigger additional adverse effects on the body, such as brain damage and even death.
Further, some individuals suffer from a combination of obstructive and central apnea, namely a mixed apnea. When obstructive apnea is severe and longstanding, episodes of central apnea sometimes develop.
Accordingly, in clinical situations, it can be helpful to monitor a patient's breathing status, identify episodes of apnea, and categorize such episodes as central or obstructive apnea, in order to alert caregivers and enable them to provide the necessary attention and response to the patient.
An apnea analysis system is provided for monitoring a breathing status of a patient in order to identify and classify episodes of apnea. An apnea analysis system 100 according to an embodiment is shown in FIG. 1 . In the embodiment shown, the apnea analysis system 100 includes a photoplethysmographic (PPG) sub-system 102 and a breath detection sub-system 104 operatively connected to and in communication with an apnea analysis module 106, which may be operatively connected to a display 107. The PPG sub-system 102 is configured to be operatively connected to an individual and used to output a PPG signal or output 108 indicative of one or more physiological characteristics of the individual. For example, the PPG signal may be indicative of a blood flow status or cardiac status of the patient, and may be obtained through a pulse oximeter. The PPG sub-system 102 may include a PPG sensor (such as a pulse oximetry sensor) that is positioned on a finger, forehead, forearm, or the like of the individual. As described below, the PPG sensor is configured to detect the PPG signal or output 108, which may be in the form of a PPG signal or a respiratory component of the PPG signal. The PPG signal 108 may be analyzed to determine physiological characteristics such as respiration rate, respiratory effort, pulse rate, oxygen saturation, and/or other parameters.
The breath detection sub-system 104 is configured to be operatively connected to the individual and output a breath signal indicative of a breathing status of the individual, such as by detecting exhaled breath of an individual. For example, the breath detection sub-system 104 may include a sampling device, such as nasal prongs, a breathing mask, and/or the like, configured to be positioned on the individual. The sampling device may be connected to a sidestream or mainstream gas analyzer. In at least one embodiment, the breath detection sub-system 104 is a capnographic sub-system. Alternatively, the breath detection sub-system 104 may be or include pressure, acoustic, moisture, and/or temperature-based breath analysis sub-systems that are configured to detect the presence of inhaled and/or exhaled breath. The breath detection sub-system 104 is configured to output a breath signal or output 110 indicative of a breathing status of the individual. The breath signal or output 110 may indicate whether the individual is inhaling and/or exhaling, and may indicate characteristics of the individual's breath, such as depth, duration, CO2 content, and frequency.
The PPG sub-system 102 and the breath detection sub-system 104 may be connected to the apnea analysis module 106 through wired or wireless connections. As shown in FIG. 1 , the apnea analysis module 106 receives the PPG signal or output 108 from the PPG sub-system 102, as well as the breath signal or output 110 from the breath detection sub-system 104. The apnea analysis module 106 analyzes the outputs 108 and 110 from the PPG sub-system 102 and the breath detection sub-system 104, respectively, and detects whether the individual is experiencing apnea. Moreover, based on the analysis of the outputs 108 and 110, the apnea analysis module 106 is able to classify the apnea as central, obstructive, or mixed apnea, as described in further detail below.
A PPG system 200 according to an embodiment is shown in FIG. 2 . The PPG system 200 represents an example of the PPG sub-system 102 shown in FIG. 1 . In an embodiment, the PPG system 200 is a pulse oximetry system. A pulse oximeter detects changes in blood volume under the skin, and thereby can indirectly, non-invasively measure the oxygen saturation of hemoglobin in an individual's arterial blood (as opposed to measuring oxygen saturation directly by analyzing a blood sample taken from the patient). Pulse oximeters may also be used to measure the pulse rate of the patient.
The pulse oximetry system 200 includes a sensor or probe 212 that is placed at a site on a patient, typically a fingertip, toe, forehead or earlobe, or in the case of a neonate, across a foot. The sensor includes a light source or emitter 216 and a photodetector 218. Light passes from the emitter 216 through the patient's blood perfused tissue and to the detector 218, which photoelectrically senses the absorption of the light in the tissue. For example, the oximeter may measure the intensity of light that is attenuated by the tissue and received at the detector, as a function of time. A signal representing light intensity versus time or a mathematical manipulation of this signal (e.g., a scaled version thereof, a log taken thereof, a scaled version of a log taken thereof, etc.) may be referred to as the photoplethysmograph (PPG) signal. In addition, the term “PPG signal,” as used herein, may also refer to an absorption signal (i.e., representing the amount of light absorbed by the tissue) or any suitable mathematical manipulation thereof. The PPG signal may be analyzed to identify cardiac pulses and determine the patient's pulse rate and when each cardiac pulse occurs.
When two or more wavelengths of light are emitted, the relative light intensity or the amount of light absorbed by each may be used to calculate the amount of a particular component in the blood. The amount of light passed through the tissue varies in accordance with the changing amount of blood constituent in the tissue and the related light absorption. Red and infrared (IR) wavelengths may be used because it has been observed that highly oxygenated blood will absorb relatively less red light and more infrared light than blood with a lower oxygen saturation. By comparing the intensities of light at the two wavelengths at different points in the pulse cycle, it is possible to estimate the blood oxygen saturation of hemoglobin in arterial blood.
Referring again to FIG. 2 , the emitter 216 may emit two or more wavelengths into the patient's tissue, in order to calculate oxygen saturation of the patient's blood. Although only one emitter 216 is shown, the PPG sub-system 200 may include a plurality of emitters and detectors, and/or a plurality of sensors 212 forming a sensor array instead of a single sensor.
The PPG sub-system 200 also includes a monitor 214. The sensor 212 may be connected to and draw power from the monitor 214, as shown. Alternatively, the sensor 212 may be wirelessly connected to the monitor 214 and include its own battery or similar power supply. The monitor 214 may be configured to calculate physiological parameters based at least in part on data received from the sensor 212 relating to light emission and detection. Alternatively, the calculations may be performed on the sensor 212 or in the sensor cable 224, and the result of the oximetry reading may be passed to the monitor 214. Further, the monitor 214 may include a display 220 configured to display the physiological parameters or other information about the PPG sub-system 200. As shown, the monitor 214 may also include a speaker 222 to provide an audible sound that may be used in various other embodiments, such as for example, sounding an audible alarm in the event that a patient's physiological parameters are not within a predefined normal range.
The sensor 212, or the sensor array, may be communicatively coupled to the monitor 214 via the cable 224. In other embodiments, a wireless transceiver (not shown) or the like may be used instead of or in addition to cable 224 to transmit data between the sensor and monitor.
The PPG sub-system 200 may also include a multi-parameter patient monitor 226. The monitor 226 may be a cathode ray tube type, a flat panel display (as shown) such as a liquid crystal display (LCD) or a plasma display, or any other type of monitor now known or later developed. The monitor 214 may be communicatively coupled to the multi-parameter patient monitor 226 via a cable 232 or 234. The multi-parameter patient monitor 226 may be configured to calculate physiological parameters and to provide a display 228 for information from the monitor 214 and from other medical monitoring devices or systems, such as, for example, the apnea analysis module 106 shown in FIG. 1 . For example, the multiparameter patient monitor 226 may be configured to display an estimate of an individual's blood oxygen saturation (referred to as an “SpO2” measurement) generated by the monitor 214, pulse rate information from the monitor 214 and blood pressure from a blood pressure monitor (not shown) on the display 228. The monitor 226 may be used as the display 107 of FIG. 1 .
A block diagram of a PPG system 210 according to an embodiment is shown in FIG. 3 . Certain illustrative components of the sensor 212 and the monitor 214 are illustrated in FIG. 3 . The sensor 212 includes the emitter 216, the detector 218, and an encoder 242. The emitter 216 includes a first light emitting light source for emitting light at a first wavelength, such as RED light emitting diode (LED) 244, and a second light emitting light source for emitting light at a second wavelength, such as IR LED 246. The emitter 216 emits light into the patient's tissue 240 at the wavelengths used to calculate the patient's physiological parameters, such as SpO2. In at least one embodiment, the RED wavelength is between about 600 nm and about 700 nm, and the IR wavelength is between about 800 nm and about 1000 nm. In embodiments where a sensor array is used in place of single sensor, each sensor may be configured to emit a single wavelength. For example, a first sensor emits only a RED light while a second only emits an IR light. In various embodiments, more than two wavelengths may be emitted by one or more emitters.
In at least one embodiment, the detector 218 is configured to detect the intensity of light at the two emitted wavelengths. In operation, light may enter the detector 218 after passing through the patient's tissue 240. The detector 218 converts the intensity of the received light into an electrical signal. The light intensity is directly related to the absorbance and/or reflectance of light in the tissue 240. That is, when more light at a certain wavelength is absorbed or reflected, less light of that wavelength is received from the tissue by the detector 218. After converting the received light to an electrical signal, the detector 218 sends the signal to monitor 214, where the microprocessor 248 may use algorithms and/or look-up tables to calculate physiological parameters (such as SpO2, respiration rate, respiratory effort, and pulse rate), based on the time-varying absorption of the light in the patient's tissue 240.
The encoder 242 may contain information about the sensor 212, such as the type of sensor (for example, whether the sensor 212 is intended for placement on a forehead or digit) and the wavelengths of light emitted by the emitter 216. The information may be used by the monitor 214 to select appropriate algorithms, lookup tables and/or calibration coefficients stored in the monitor 214 for calculating the patient's physiological parameters. The encoder 242 may contain information specific to the patient 240, such as, for example, the patient's age, weight, and diagnosis. The encoder 242 may, for instance, be a coded resistor which stores values corresponding to the type of sensor 212, and/or the wavelengths of light emitted by the emitter 216, or the encoder 242 may include a memory on which such information is stored. User inputs 256 and display 220 may be used to enter information about the patient, such as age, weight, height, diagnosis, medications, treatments, and so forth.
Signals from the detector 218 and the encoder 242 are transmitted to the monitor 214, through a decoder 274. The monitor 214 may include a general-purpose microprocessor 248 connected to an internal bus 250. The microprocessor 248 may be adapted to execute software, which may include an operating system and one or more applications, as part of performing the functions described herein. Also connected to the bus 250 may be a read-only memory (ROM) 252, a random access memory (RAM) 254, user inputs 256, display 220, and speaker 222. Any suitable computer-readable media may be used in the system for data storage.
As shown, a time processing unit (TPU) 258 may provide timing control signals to a light drive circuitry 260, which controls when the emitter 216 is illuminated and multiplexed timing for the two LED's 244 and 246. The TPU 258 may also control the gating-in of signals from detector 218 through an amplifier 262 and a switching circuit 264. The signals are sampled at the proper time, depending upon which light source is illuminated. The received signal from the detector 218 may be passed through an amplifier 266, a low pass filter 268, and an analog-to-digital converter 270. The digital data may then be stored in a queued serial module (QSM) 272 (or buffer) for later downloading to RAM 254 as QSM 272 fills up.
An example of a PPG signal obtained from a pulse oximeter (such as PPG system 102, 200, 210) is shown in FIG. 4A . The PPG signal may be output as a PPG waveform 10 which represents the absorption of light by the patient's tissue over time. The PPG waveform 10 includes cardiac pulses 12, where absorption of light increases due to the increased volume of blood in the arterial blood vessel due to the cardiac pulse. Each cardiac pulse 12 may be identified based on a valley 14, peak 16, dichrotic notch 18, and subsequent valley 14. The cardiac pulse 12 includes an amplitude A measured at any suitable location along the pulse, such as along the upstroke of the pulse, from the preceding valley 14 to the peak 16. The PPG waveform 10 includes a pulse period of duration D between adjacent pulses 12. The duration D is shown measured from one peak 16 to an adjacent peak 16, but may be measured between any suitable points along the pulses. The PPG waveform 10 also includes a baseline shift B indicating a baseline level of the light absorption, above which the waveform modulates due to arterial blood pulses. The baseline B may also be measured at any suitable point along the waveform 10, such as at the valleys 14, peaks 16, or a median or mean value between the peaks and valleys. The PPG waveform 10 shown in FIG. 4A may be the output 108 of FIG. 1 .
A segment of a PPG waveform 10 during normal breathing, or attempts to breathe, is shown in FIG. 4B . The waveform 10 includes cardiac pulses 12. It should be noted that the number of cardiac pulses 12 per breath is not necessarily to scale, and may vary from patient to patient. Respiration or attempted respiration (breathing in and out, or attempting to breathe) may cause one or more of three modulations in the PPG waveform 10.
The first modulation is a modulation of the baseline B of the PPG waveform 10. The effect of the patient breathing in and out causes the baseline B of the waveform 10 to move up and down, cyclically, with the patient's respiration rate. The baseline shift is due in part to the shifting of venous blood at the peripheries during the respiratory cycle. As the patient inhales, the lowering of the thoracic pressure causes an increase in the driving pressure gradient from the peripheries to the heart. Relatively more blood is drained from the peripheries causing less light to be absorbed. During exhalation, the thoracic pressure increases, the pressure gradient reduces, and more blood begins to pool at the peripheries, causing more light to be absorbed. This process is repeated with each breath. The baseline modulation waveform B may be tracked by following any component of the PPG waveform 10, such as the peaks, valleys, dichrotic notches, median value, or other value. As shown in FIG. 4B , the baseline B1 at one point in time is smaller than the baseline B2 at a later time.
The second respiration-induced modulation of the PPG is a modulation of the amplitude A. As the patient breathes in and out, the amplitude A of each cardiac pulse 12 increases and decreases, with larger amplitudes (such as amplitude A2) tending to coincide with the top of the baseline shift B, and smaller amplitudes (such as amplitude A1) tending to coincide with the bottom of the baseline shift.
The third modulation due to respiration is a modulation of the frequency or duration of the cardiac pulses 12. This modulation may also be characterized in terms of the duration between pulses. On the upstroke of the baseline of the waveform 10, which tends to coincide with inhalation, the frequency tends to decrease, with a longer duration D (such as duration D1 in FIG. 4B ) between cardiac pulses 12. On the downstroke of the baseline of the waveform 10, which tends to coincide with exhalation, the frequency tends to increase, with a shorter duration (such as duration D2) between the cardiac pulses 12.
Each of these three modulations—modulations of baseline B, cardiac pulse amplitude A, and duration D between cardiac pulses (or frequency of pulses)—may be referred to as a respiratory component of the PPG signal, or a respiratory-induced modulation of the PPG signal. These three modulations are plotted in FIG. 4C , which shows the frequency modulation waveform D, the amplitude modulation waveform A, and the baseline modulation waveform B. These waveforms indicate the cyclical increase and decrease in these values (frequency, amplitude, and baseline) due to the patient's respiration. It should be noted that in any particular patient, one, two, or all three of these modulations may be present. That is, a particular individual may exhibit only the baseline modulation, or only the amplitude modulation, or only the frequency modulation of the PPG, or a combination of two, or all three of these modulations. As referred to herein, a respiratory component of the PPG includes any one of these respiratory-induced modulations of the PPG waveform 10, or a combination of them.
The apnea analysis module 106 and/or the PPG sub-system 102 may monitor the PPG waveform 10 for variations or modulations in one or more of the baseline modulation waveform B, the cardiac pulse amplitude modulation waveform A, and the cardiac pulse frequency waveform F (or duration D) to determine whether or not an individual is breathing properly. Additionally, the apnea analysis module 106 and/or the PPG sub-system 102 may monitor two or more of the above to determine a confidence level in the analysis. For example, if two or more of the respiratory components correlate with respect to the existence and rate of the variation or modulation (that is, the rate of modulation of the two or more components matches or closely matches), then a high degree of confidence in the analysis exists. If one of the respiratory components does not correlate with the other one or two components, then a moderate to low degree of confidence in the analysis exists. The apnea analysis module may assess the degree of correlation or matching between the respiratory components in order to assess a degree of confidence, with a higher correlation indicating a higher confidence, and vice versa. The apnea analysis module 106 and/or the PPG sub-system 102 may output a confidence metric (such as high, moderate, or low) based on the agreement or lack of agreement between the three respiratory components.
The respiratory component(s) of the PPG may be used to identify the patient's respiration rate (also known as pulmonary ventilation rate, respiratory rate, ventilation rate, or breathing frequency). For example, referring to FIG. 4C , the period P of one or more of the waveforms A, B, and D may signify the patient's respiration rate. Further, the amplitude of one or more of the waveforms A, B, and D may indicate a respiratory effort of the patient—that is, the effort exerted by the patient to breathe. For example, an increase in the amplitude of one or more waveforms A, B, and D (marked “AMP-A”, “AMP-B”, and “AMP-D”, respectively) from a relative baseline may indicate that the patient has increased his or her effort to breathe, and a decrease in amplitude may indicate a decrease in the patient's effort to breathe. The amplitude(s) of the waveform(s) A, B, and/or D may be used to track a trend in the patient's respiratory effort. An increase in the respiratory rate may also indicate an increased respiratory effort by the patient. In an embodiment, the PPG sub-system 102 and/or the apnea analysis module 106 outputs a respiratory rate signal and/or a respiratory effort signal that tracks these parameters over time.
The PPG sub-system 102 may detect and determine the respiration rate of an individual, as described in United States Patent Application Publication No. 2011/0071406, entitled “Determining a Characteristic Respiration Rate,” which is hereby incorporated by reference in its entirety. The PPG sub-system 102 may be used to detect and determine the respiration rate and/or the respiratory effort of an individual, as described in U.S. application Ser. No. 13/867,291, entitled “System and Method for Determining Respiratory Parameters From Blood Flow Signals,” which is also hereby incorporated by reference in its entirety.
The output 108 from the PPG sub-system 102 may include one or more of the PPG waveform 10, the respiratory component waveforms A, B, and D, a respiratory rate signal, a respiratory effort signal, and combinations of these. The PPG waveform 10 may be a raw signal from the PPG sensor indicating light absorbance over time, or may be a filtered and processed waveform with filtering steps such as noise reduction, artifact removal, etc. The PPG sub-system 102, such as the PPG sub-system 200, provides the PPG signal or output 108 to the apnea analysis module 106.
Turning now to the breath-detection sub-system, a schematic block diagram of a capnographic sub-system 400, according to an embodiment of the present disclosure, is shown in FIG. 5A . The capnographic sub-system 400 is an example of a breath detection sub-system 104, as shown in FIG. 1 . The capnographic sub-system 400 is used to detect respiration of an individual and provide a breath output, such as the breath output 110 (shown in FIG. 1 ) to the apnea analysis module 106. The breath detection sub-system includes a breath-sampling interface (such as nasal prongs, a gas sampling mask, or the like) configured to be connected to the individual. The signal or output 110 of the breath detection sub-system 104 may be a breath waveform, such as a capnographic waveform, as described below.
Alternatively, various other breath detection sub-systems other than capnographic sub-systems may be used. For example, the output 110 may be a pressure signal, moisture signal, temperature signal, acoustic signal, or the like, detected and sent from a corresponding breath detection sub-system 104 that is operatively connected to an individual. For example, a pressure transducer may be positioned proximate to a mouth or airway of the individual and, through cyclical changes in airflow pressure, may indicate exhaled breath. Similarly, a temperature or moisture sensor may indicate exhaled breath through cyclical temperature or moisture changes of exhaled airflow. Further, an acoustic sensor, such as a microphone, proximate to a mouth or an airway may detect exhaled breath through cyclical changes in acoustic signals within the mouth or airway.
An embodiment of a capnographic sub-system 400 is shown in FIG. 5A . Samples of the breath of a patient are drawn through a sampling tube 412 into a gas analyzer 414. The gas analyzer 414 analyzes the patient's breath for CO2 content, and an electronic output signal is generated, such as waveform 415, corresponding to the instantaneous concentration levels of CO2 in the individual's breath. The analog CO2 waveform signals 415 generated by the gas analyzer 414 may be input into a digitizer 416, such as an A/D converter, where the analog signals are converted into a serial digital train of data for processing.
Analysis of the waveform data is performed in a signal processing unit 418. The signal processing unit 418 may be controlled by a general-purpose microprocessor 420. The digital waveform signals may be input into a parameter extraction unit 422, where the shape of each waveform is analyzed, and morphology parameters of the waveform are extracted. The parameters extracted in the parameter extraction unit 422 may be stored as a matrix, which is input into a parameter comparison unit 424. The parameter comparison unit 424 compares the matrix to a reference matrix from a reference set stored in the parameter bank 426. The reference matrix includes parameters of a typical breath waveform obtained from a normal subject.
In addition to outputting a matrix of all of the extracted waveform parameters of a single waveform, the waveform parameter extraction unit 422 may also output a continuous data stream corresponding to the parameters obtained from a sequence of breath waveforms. The serial values of the parameters may be input into a trend storage unit 432, and on demand, into a trend analyzing unit 434 where any long term trend is detected in the value of any of the parameters selected. Any long term trend is compared in the trend analyzing unit 434 with reference trends stored in the trend bank 436. The establishment of any abnormality in the observed trend may result in the output of an informative message to the operator on the output diagnosis display device 428. The capnographic sub-system 400 may be programmed to actuate an audible or visible alarm 429 based on recognized emergency or alert conditions.
The angle between the alveolar rise 542 and the alveolar plateau 544 is known as the angle α, and is normally in a range between approximately 100° and approximately 110°. The angle α is determined primarily by the V/Q (ventilation/perfusion) status of the lungs. Individuals with obstructions of the airway, such as in the case of chronic obstructive pulmonary disease (COPD) or asthma, have an increased alpha angle. The alpha angle is thus a widely used parameter for a first hand assessment of the patient's overall pulmonary state.
An alternative parameter that may be used for determining the general pulmonary state of the patient is the overall rate of rise of PCO2, which is determined by dividing the maximum value of PCO2 achieved in the waveform, by the time taken from the start of exhalation to the achievement of the maximum value 546 of PCO2. In order to avoid end effects, the 10% and 90% points of the values of PCO2 may be used for the calculation.
The nearly 90° angle between the alveolar plateau 544 and the descending limb 548 of the capnograph waveform 500 is known as the β angle. The β angle increases as the degree of rebreathing increases. The various parts of the capnographic waveform 500 are known as the phases of the waveform, the alveolar rise phase I, the alveolar plateau phase II, and the inhalation descent, phase III, as indicated in FIG. 5B .
The capnographic sub-system 400 and the capnographic waveform 500 are further described in U.S. Pat. No. 6,428,483, entitled “Waveform Interpreter for Respiratory Analysis,” which is hereby incorporated by reference in its entirety. Additionally, the capnographic sub-system 400 may be configured and operate as described in United States Patent Application Publication No. 2011/0066061, entitled “Wireless Capnography,” or United States Patent Application Publication No. 2011/0098592, entitled “Methods, Apparatus and Systems for Monitoring CO2,” both of which are hereby incorporated by reference in their entireties.
Referring again to FIG. 1 , one or more of the PPG sub-system 102, the breath detection sub-system 104, the apnea analysis module 106, and the display 107 may be separate physical components, or one or more of them may be combined together within a workstation, computer, tablet, smartphone, handheld device, integrated housing, monitor, smart cable, adapter, or other hardware component. Such components may include standard computer hardware, such as processors, circuitry, and memory, and may be connected to a display, such as a liquid crystal display (LCD), light-emitting diode (LED) display, touch screen, or other known displays. Connections between the various components may be through wired cables or wireless connections.
The system 100 may include any suitable computer-readable media used for data storage. For example, the apnea analysis module 106 may include computer-readable media. The computer-readable media are configured to store information that may be interpreted by the apnea analysis module 106. The information may be data or may take the form of computer-executable instructions, such as software applications, that cause a microprocessor or other such control unit within the apnea analysis module 106 to perform certain functions and/or computer-implemented methods. The computer-readable media may include computer storage media and communication media. The computer storage media may include volatile and non-volatile media, removable and non-removable media implemented in any method or technology for storage of information such as computer-readable instructions, data structures, program modules or other data. The computer storage media may include, but are not limited to, RAM, ROM, EPROM, EEPROM, flash memory or other solid state memory technology, CD-ROM, DVD, or other optical storage, magnetic cassettes, magnetic tape, magnetic disk storage or other magnetic storage devices, or any other medium which may be used to store desired information and that may be accessed by components of the system.
A display screen 600 of the apnea analysis system according to an embodiment is shown in FIG. 6 . The display screen 600 displays the outputs 110 and 108 from the breath-detection and PPG sub-systems, respectively. In an embodiment, the output 108 from the PPG sub-system includes a respiratory component waveform 602 from a PPG signal. The respiratory component waveform 602 represents one or more respiratory components of the PPG signal, as described above with respect to FIGS. 4A-C . In particular, the respiratory component waveform 602 may include the amplitude modulation A, baseline modulation B, or frequency (or duration) modulation F of the PPG, or a combination of these modulations. A combination of the modulations may include an average of one or more of the waveforms, a weighted average, or other combination. The waveforms may be shifted in phase so that they are in phase with each other before averaging. When the respiratory component waveform 602 shows modulations, it may be inferred that the patient is breathing or trying to breathe, and when these modulations disappear from the waveform 602, it may be inferred that the patient has stopped breathing or trying to breathe. Alternatively, the output 108 may be the PPG signal or waveform (such as PPG waveform 10 in FIG. 4B ), and the apnea analysis module may derive the respiratory component of the PPG from the PPG signal. In an embodiment, the output 110 from the breath detection system includes a capnographic waveform 604 from a breath signal. When the capnographic waveform 604 shows modulations, it may be inferred that the patient is actually inhaling and exhaling, and when these modulations disappear from the waveform 604, it may be inferred that the patient has stopped breathing. The respiratory component waveform 602 and the breath waveform 604 may be substantially synchronized with one another and displayed over substantially the same time. In another embodiment, the respiration rate signal and/or the respiration effort signal derived from the PPG signal may be displayed as waveforms on the display screen 600, instead of or in addition to the respiratory component waveform 602.
The display 600 shows both the respiratory component waveform 602 and the breath waveform 604. The apnea analysis module compares the two waveforms to determine whether the patient is attempting to breathe and/or breathing normally (non-apneic breathing). In the embodiment of FIG. 6 , both the waveforms 602 and 604 indicate normal breathing. The respiratory component waveform 602 includes a modulating segment, and does not include an attenuated segment. The presence of a modulating segment in the respiratory component waveform 602 indicates that the patient's respiration is being detected in the PPG signal, due to one or more modulations of the PPG signal caused by respiration. At a corresponding time, the breath waveform 604 also includes a modulating segment and no attenuated segment, which indicates that CO2 is being detected in the patient's exhalation. The presence of modulating segments in both waveforms indicates that the patient is attempting to breathe and is in fact inhaling and exhaling.
To determine whether the waveforms indicate breathing or attempts to breathe, the apnea analysis module 106 analyzes the waveform to detect the presence of a modulating segment in the waveform. A modulating segment is a segment having portions moving up and down, optionally in a generally repeating or cyclical manner. A modulating segment has fluctuations with a nonzero amplitude. In an embodiment, in order to identify a modulating segment, the apnea analysis module identifies the amplitude of the waveform (such as amplitude A1 or A2 in FIG. 6 ) and compares it to a range or threshold. A range or threshold of amplitudes for each waveform 602, 604 may be defined as a normal range, indicating normal breathing. If modulations are large enough to give the waveform an amplitude within the defined range, or above the defined threshold, then the apnea analysis module determines that the waveform indicates normal breathing or effort to breathe.
For example, when the respiratory component waveform 602 includes the amplitude, baseline, or frequency modulation waveform, or a combination of these, a lower threshold for the amplitude(s) AMP-A, AMP-B, AMP-F (see FIG. 4C ), or a combination of these amplitudes, may be set, and the apnea analysis module 106 calculates the amplitude of the waveform 602 and compares it to the threshold. If the amplitude remains above the threshold, the system determines that the respiratory component of the PPG indicates that the patient is breathing or attempting to breathe. Similarly, a range or threshold may be defined for the breath waveform 604. If the amplitude A2 of the modulations in the breath waveform 604 remain above the threshold, or within a defined normal range, the apnea analysis module determines that the patient is actually breathing. The ranges or thresholds identifying normal breathing and/or regular respiration rate and/or effort in the various signals may be pre-defined and calibrated. As an example, clinical studies of healthy individuals during normal breathing, and/or a patient's particular history of normal breathing, may establish a range of normal breathing, respiration rate, and effort.
In other embodiments, a modulating segment of a waveform may be identified in other ways, such as by assessing the slope and frequency of upstroke portions of the waveform, or by using a Fourier transform method (such as a short-time Fourier transform) or a wavelet method.
As used herein, a flat-line or attenuated segment of a waveform refers to a portion that lacks modulations. An attenuated segment may be flat or substantially flat, exhibit an absence or reduction of modulations, variations, or fluctuations, or have a zero, near-zero, or non-fluctuating first derivative. In an embodiment, an attenuated segment is identified when the amplitude is below the threshold, or outside of the range, that is correlated with normal breathing or a presence of effort to breathe (as discussed above). In another embodiment, an attenuated segment may be identified in relation to a modulating segment. As one example, an attenuated segment may be identified as having a reduced amplitude compared to a segment representative of normal breathing. For example, an attenuated segment may have an amplitude that is 0%-30% of the amplitude of a normal breathing segment. For example, an attenuated segment may be identified as a segment with an amplitude that is below 20%, or below 30%, or below 40% of the amplitude of a normal breathing waveform. An attenuated segment may have an amplitude of modulation that is noticeably different than that of other segments of the waveform that are representative of normal breathing.
A display screen 700 according to an embodiment is shown in FIG. 7 . In this example, the respiratory component waveform 702 includes a modulating segment 708, and at a corresponding time, the breath waveform 704 includes an attenuated segment 710. The attenuated segment 710 in the breath signal 704 indicates that the breath detection sub-system is not detecting active exhalation from the subject. That is, the subject may not be breathing. However, the respiratory component waveform 702 continues to include modulations in segment 708, induced by respiration. This comparison of the two signals indicates that the patient is attempting to breathe, but is not successfully breathing (for example, is unable to exhale breath). Based on this comparison, the apnea analysis module 106 identifies an apnea event and categorizes it as obstructive apnea.
Still referring to FIG. 7 , in an embodiment, the apnea analysis module also checks the SpO2 value of the patient. If the SpO2 value remains high (above a threshold), and does not begin to drop, this indicates that the patient is still receiving oxygen. As a result, based on the absence of breaths in the breath signal (in segment 710), the presence of breaths in the respiratory component of the PPG signal (in segment 708), and the high, stable SpO2 value, the apnea analysis module determines that the breath-sampling interface from the breath detection system is not connected to the patient, and generates a breath sensor-off message or alert.
Still referring to FIG. 7 , in an embodiment, the apnea analysis module also monitors the amplitude of the respiratory component waveform 702 for an increase compared to a threshold or historical values (for example, a 20% increase). An increase in the amplitude of the waveform 702 may indicate an increased effort to breathe. If such an increased respiratory effort coincides with the attenuated portion 710 of the breath waveform 704, the apnea analysis module may determine that obstructive apnea is present due to the patient's increased effort to breathe, and no successful breath. The apnea analysis module may then activate an alert or alarm display, message, or sound.
A display screen 800 according to an embodiment is shown in FIG. 8 . In this example, the respiratory component waveform 802 and the breath waveform 804 both include attenuated segments 806 and 808, respectively, at a corresponding time. The attenuated segment 806 in the respiratory component waveform 802 indicates that the PPG signal is no longer exhibiting modulations due to respiration. This indicates that the patient is no longer attempting to breathe. The attenuated segment 808 in the breath waveform 804 indicates that the breath detection system is no longer detecting exhaled CO2 from the patient. This indicates that the patient is no longer breathing. Based on this comparison of the outputs from the two sub-systems, the apnea analysis module identifies an apnea event and categorizes it as central apnea.
In an embodiment, the apnea analysis module also checks the PPG signal for the presence of cardiac pulses 811. If cardiac pulses 811 continue to be present in the PPG signal, then the system determines that the PPG sensor is still properly positioned on the patient, and thus the attenuated segment 806 is likely due to apnea rather than a sensor-off condition. While not shown in FIGS. 6 and 7 , the display screens 600 and 700 may also display the pulsatile component of the PPG waveform, such as shown in FIGS. 8 and 9 .
A display screen 900 according to an embodiment is shown in FIG. 9 . In this example, the apnea analysis system determines that the PPG sensor is not properly positioned on the patient. The respiratory component waveform 902 includes an attenuated segment 906, while at a corresponding time, the breath waveform 904 includes a modulating segment. Additionally, the PPG waveform 910 includes an attenuated segment 912, devoid of cardiac pulses 911. Because the breath waveform indicates that the patient is still successfully breathing, the lack of both cardiac and respiratory modulations in the PPG signal indicates that the sensor has fallen off the patient, rather than indicating that cardiac and respiratory activity has stopped. Accordingly, the apnea analysis module 106 displays a PPG sensor-off alert or message on the display 107.
In an embodiment, the apnea analysis module 106 is able to identify and classify a type of apnea based on a comparison of the respiratory component of the PPG waveform with the breath waveform. In various embodiments, the apnea analysis module may also consider the PPG waveform, SpO2 value, respiration effort, and/or other inputs. The apnea analysis module may accomplish this comparison by referring to a logic table, as described below.
The breath waveform column 1002 indicates a presence or absence of exhaled breath, as determined from the output 110 from the breath detection system.
The SpO2 column includes an SpO2 value, as determined from the PPG signal, or an indication of whether the SpO2 value is within a range or above or below a threshold. The SPO2 value may be used as a further analytical tool for apnea analysis. If an individual is breathing, oxygen is provided to the blood, and the oxygen saturation value remains at a normal level. An oxygen saturation level may be chosen as a threshold for apnea detection. For example, in an embodiment, the threshold is 85%. However various other SPO2 levels may be used. For example, the threshold may be 80%, 90%, or 95%. As discussed further below, the oxygen saturation value, and in particular whether it is above or below a designated threshold, may be used as one of several input factors to determine whether the patient is breathing normally.
The respiration column 1006 includes an indication of the presence or absence of respiration from a respiratory component of the PPG signal.
The respiratory effort column indicates a normal, high, or diminished respiratory effort, as determined from a respiratory component of the PPG signal. A “normal” respiratory effort may be determined by a physician, clinician, or the like. For example, the user may set a normal respiratory effort as between a particular low threshold percentage and a particular high percentage in relation to a calibrated PPG waveform. As an example, normal respiratory effort may be between 50% and 150% of a pre-calibrated normal respiratory effort signal derived from the PPG signal 108. As another example, respiratory effort may be identified as high based on an increase in amplitude of the respiratory component of the PPG as compared to a baseline. However, the normal respiratory effort may be between percentages that are greater or less than those noted.
Referring to FIG. 10 , the first row of the logic table indicates breaths present, SpO2 above a specified threshold, respiration present, and respiration effort normal. Based on these inputs, the apnea analysis module determines that the individual is breathing normally, that is, regular respiration.
The second row of the logic table indicates that breaths are absent, SpO2 is above the threshold, respiration is not detected from the PPG waveform, and respiration effort is not detected. Based on these inputs, the apnea analysis module 106 determines the existence of an initial stage of central apnea. The initial stage of central apnea may become a long term central event or transition into a mixed apnea. In such a scenario, the apnea analysis module 106 may generate an alarm.
The third row of the logic table indicates that breaths are absent, the SpO2 value is below the threshold (or the SpO2 value is dropping and the rate of change of the SpO2 value is above a threshold, indicating a rapid drop), and respiration and respiratory effort are not detected. Based on these inputs, the apnea analysis module 106 determines the existence of a long term or severe central apnea. Accordingly, the apnea analysis module 106 may generate a corresponding alarm. The alarm for the long term or severe central apnea may be more urgent than that for the initial stage of central apnea. For example, the alarm may be louder and/or a different color or flashing, as compared to the alarm for the initial stage of central apnea. As such, the apnea analysis module 106 may differentiate alarms based on the severity of the apnea that is detected.
Still referring to FIG. 10 , in the fourth row, breaths are absent, SpO2 is above the threshold, and respiration is present, but a respiratory effort is high. Based on these inputs, the apnea analysis module 106 determines that obstructive apnea is present. As such, the apnea analysis module 106 may generate an appropriate alarm indicating obstructive apnea.
In the fifth row of the logic table 1000, breaths are absent, the SpO2 level is above a threshold, respiration is present, and respiratory effort is normal. Based on these inputs, the apnea analysis module 106 may determine that the breath sensor or probe is disconnected (e.g., a “probe off” condition), and generate an appropriate alarm or notification.
Finally, in the last row of the logic table 1000, breaths are intermittent or cycling between being present and absent, the SpO2 value is under a threshold or fluctuating markedly, and respiration and respiratory effort are intermittent or cycling. Based on these inputs, the apnea analysis module determines the presence of apnea, and identifies the apnea as a mixed apnea. The module may provide an alarm, and may increase the severity of the alarm if the apnea event continues.
In the first row of the logic table 1100, breaths are detected in the breath waveform, but not in the PPG waveform (such as through a lack of respiration rate and respiratory effort). Based on these inputs, the apnea analysis module 106 may determine that the PPG sensor is disconnected from the patient. The apnea analysis module may display the exhaled CO2 and the respiration rate values derived from the breath waveform, and generate an appropriate sensor-off alarm.
In the second row of the logic table 1100, breaths are absent from the breath output 110 and the PPG output 108. Based on these inputs, the apnea analysis module 106 may generate a high priority apnea alarm. The apnea alarm may indicate central apnea and may include a message stating “no breath for ss seconds,” in which “ss” is a particular number of seconds since the last detected breath.
In the third row, breaths are absent from the breath output 110, but the PPG sub-system 102 provides a PPG output 108 in which the SPO2 level is above a threshold (such as 85%), and breaths are detected (such as from one or more respiratory components of the waveform). Based on these inputs, the apnea analysis module determines that the breath detection sensor is not properly positioned. No breaths are detected, but the SpO2 level remains above a threshold, which indicates that the patient is continuing to receive oxygen. As a result, the system generates a medium priority alarm, which may recite, for example, “check for possible obstruction or CO2 patient interface.” As an example, the patient interface may be nasal prongs or a face mask of a mainstream or sidestream breath sampling device of a capnographic sub-system.
Still referring to FIG. 11 , in the fourth row, breaths are absent from the breath output 110, and the PPG sub-system 102 generates a signal indicating that the SPO2 level is below a threshold (such as 85%) and breathing effort is present. Based on these inputs, the apnea analysis module 106 may determine an obstructive apnea event, and may generate a high priority alarm, which may recite, for example, “apnea for ss seconds.”
In the first row of the table 1200, breaths are present in the breath waveform, but respiratory rate and effort are absent from the PPG waveform. Based on these inputs, the apnea analysis module 106 displays the calculated signals derived from the breath waveform, and determines that the PPG sensor is disconnected from the patient. The module may also generate an appropriate alarm.
In the second row of table 1200, no breaths are detected by the breath detection sub-system, and the PPG sub-system 102 is not detecting a respiration rate or respiratory effort. Based on these inputs, the apnea analysis module 106 may generate a high priority apnea alarm identifying central apnea.
In the third row of table 1200, no breaths are detected by the breath detection sub-system, and the PPG sub-system 102 detects a respiration rate, an SPO2 level above a threshold (such as 85%), and an increased respiratory effort. Based on these inputs, the apnea analysis module 106 identifies a possible obstructive apnea condition and generates a medium priority alarm, such as “check for possible obstruction.” In the fifth row, based on the same inputs but a decreasing SpO2, the apnea analysis module 106 identifies an obstructive apnea condition and generates a heightened priority alarm, such as “check for possible obstruction” as well as an alert regarding a low or dropping SPO2 level.
In the fourth row, the respiratory effort is unchanged, instead of increased, and the SpO2 level is above a threshold. Based on these inputs, the apnea analysis module 106 determines that the breath interface is no longer connected to the patient, and generates a medium priority alarm, such as “check breath interface.” That is, when the PPG sub-system 102 detects otherwise normal breathing, but the breath detection sub-system 104 does not detect breath, then the apnea analysis module 106 may determine that a breath interface, such as a sampling tube, is no longer operatively connected to an individual. In the sixth row, based on the same inputs but a decreasing SpO2, the apnea analysis module 106 generates a medium priority alarm, such as “check breath interface.”
As shown in FIGS. 10-12 , for example, the apnea analysis module 106 may generate various alarms of increasing priority depending on the nature of the breathing status of the individual. The alarms may be tiered based on the type of condition detected. For example, the apnea analysis module 106 may generate a highest urgency alarm when central apnea is detected and correlated with an SPO2 level below a threshold. The highest urgency alarm may be associated with flashing colors and an audio signal (such as beep or buzz or other alarm) at the highest volume. Obstructive apnea may cause the apnea analysis module 106 to generate a high priority alert, which may be defined by flashing text on a screen, and/or an audio signal of increasing volume. A probe or interface off condition may cause the apnea analysis module 106 to generate a medium priority alert, which may be defined by text on a screen, and/or an audio signal.
Referring again to FIG. 1 , the apnea analysis module 106 may determine and classify apnea by comparing a respiratory component of the PPG signal or output 108 with the breath signal or output 110, such as a capnograph breath waveform. The apnea analysis module 106 may use probability density estimates calculated, for example, using non-parametric Bayesian estimates, neural networks, or any suitable method of hetero-associative function estimation to determine the respiratory status (for example, normal breathing, central apnea, obstructive apnea, or mixed apnea) of the individual. Alternatively, the apnea analysis module 106 may employ rule based systems and adaptive rule based systems such as propositional logic, predicate calculus, and/or modal, non-monotonic or fuzzy logics, for example. Alternatively, the apnea analysis module 106 may use logic tables, as described above.
The apnea analysis module 106 may determine that the individual is experiencing mixed apnea if episodes of obstructive and central apnea occur within a predetermined period of time. For example, if obstructive apnea and central apnea are detected within one minute of each other, the apnea analysis module 106 may determine that the individual is experiencing mixed apnea. In other embodiments, the time window for determination of mixed apnea may be greater or less than one minute, such as, for example, 30, 40, 50, 70, 80, 90, or 120 seconds.
At 1308, it is determined whether a breath is present in the breath signal. If breath is present, the process continues to 1310, where it is determined whether a respiratory component (such as a baseline modulation, amplitude modulation, frequency modulation, or calculated parameter such as respiration rate and/or respiratory effort), is present in the PPG signal at a corresponding time. If a respiratory component is present, the process continues to 1312, where it is determined that the individual is breathing normally. If a respiratory component is not present, the process continues to 1314, where a PPG probe-off condition is signaled.
If, however, breath is not present at 1308, the process continues to 1316, where it is determined whether a respiratory component is present in the PPG signal at a corresponding time. If the respiratory component is present, then the process continues to 1318, where it is determined that the individual is experiencing obstructive apnea. If, however, the respiratory component is not present, then the process continues to 1320, where it is determined that the individual is experiencing central apnea.
Embodiments of the present disclosure provide systems and methods of detecting and classifying apnea events as central, obstructive, or mixed, for example, based on a reduction in a breath signal or respiratory signal, and a corresponding status of the other signal. Determining the type of apnea guides appropriate and timely medical interventions.
Various embodiments described herein provide a tangible and non-transitory (for example, not an electric signal) machine-readable medium or media having instructions recorded thereon for a processor or computer to operate a system to perform one or more embodiments of methods described herein. The medium or media may be any type of CD-ROM, DVD, floppy disk, hard disk, optical disk, flash RAM drive, or other type of computer-readable medium or a combination thereof.
The various embodiments and/or components, for example, the control units, modules, or components and controllers therein, also may be implemented as part of one or more computers or processors. The computer or processor may include a computing device, an input device, a display unit and an interface, for example, for accessing the Internet. The computer or processor may include a microprocessor. The microprocessor may be connected to a communication bus. The computer or processor may also include a memory. The memory may include Random Access Memory (RAM) and Read Only Memory (ROM). The computer or processor may also include a storage device, which may be a hard disk drive or a removable storage drive such as a floppy disk drive, optical disk drive, and the like. The storage device may also be other similar means for loading computer programs or other instructions into the computer or processor.
As used herein, the term “computer” or “module” may include any processor-based or microprocessor-based system including systems using microcontrollers, reduced instruction set computers (RISC), application specific integrated circuits (ASICs), logic circuits, and any other circuit or processor capable of executing the functions described herein. The above examples are exemplary only, and are thus not intended to limit in any way the definition and/or meaning of the term “computer” or “module.”
The computer or processor executes a set of instructions that are stored in one or more storage elements, in order to process data. The set of instructions may include various commands that instruct the computer or processor as a processing machine to perform specific operations such as the methods and processes of the various embodiments of the subject matter described herein. The set of instructions may be in the form of a software program. The software may be in various forms such as system software or application software. Further, the software may be in the form of a collection of separate programs or modules, a program module within a larger program or a portion of a program module. The software also may include modular programming in the form of object-oriented programming. The processing of input data by the processing machine may be in response to user commands, or in response to results of previous processing, or in response to a request made by another processing machine.
The block diagrams of embodiments herein illustrate one or more modules. It is to be understood that the modules represent circuit modules that may be implemented as hardware with associated instructions (e.g., software stored on a tangible and non-transitory computer readable storage medium, such as a computer hard drive, ROM, RAM, or the like) that perform the operations described herein. The hardware may include state machine circuitry hard wired to perform the functions described herein. Optionally, the hardware may include electronic circuits that include and/or are connected to one or more logic-based devices, such as microprocessors, processors, controllers, or the like. Optionally, the modules may represent processing circuitry such as one or more field programmable gate array (FPGA), application specific integrated circuit (ASIC), or microprocessor. The circuit modules in various embodiments may be configured to execute one or more algorithms to perform functions described herein. The one or more algorithms may include aspects of embodiments disclosed herein, whether or not expressly identified in a flowchart or a method.
As used herein, the terms “software” and “firmware” are interchangeable, and include any computer program stored in memory for execution by a computer, including RAM memory, ROM memory, EPROM memory, EEPROM memory, and non-volatile RAM (NVRAM) memory.
It is to be understood that the above description is intended to be illustrative, and not restrictive. For example, the above-described embodiments (and/or aspects thereof) may be used in combination with each other. In addition, many modifications may be made to adapt a particular situation or material to the teachings without departing from its scope. Further, the limitations of the following claims are not written in means—plus-function format and are not intended to be interpreted based on 35 U.S.C. §112, sixth paragraph, unless and until such claim limitations expressly use the phrase “means for” followed by a statement of function void of further structure.
Claims (12)
1. An apnea analysis method comprising:
receiving, using an apnea analysis system, a photoplethysmographic (PPG) signal indicative of a cardiac status of an individual from a PPG sensor;
receiving, using the apnea analysis system, a breath signal indicative of a breathing status of the individual from a breath sensor;
identifying, using the apnea analysis system, a respiratory component of the PPG signal indicative of a respiration effort or a respiration rate;
calculating, using the apnea analysis system, an oxygen saturation value indicative of oxygen saturation of the individual based on the PPG signal;
identifying, using the apnea analysis system, a presence of apnea based on at least one of the breath signal, the respiratory component of the PPG signal, and the oxygen saturation value;
differentiating, using the apnea analysis system, between obstructive apnea and central apnea, based on the breath signal, the respiratory component of the PPG signal, and the oxygen saturation value; and
providing, using the apnea analysis system, an indication based on the differentiating.
2. The method of claim 1 , further comprising outputting a confidence metric with respect to the respiratory component of the PPG signal based on detected modulations of a baseline, a cardiac pulse amplitude, or a cardiac pulse frequency.
3. The method of claim 1 , further comprising identifying a presence of normal breathing when the breath signal and the respiratory component of the PPG signal each include a modulating segment.
4. The method of claim 1 , wherein identifying the presence of apnea comprises identifying an attenuation of the breath signal, or identifying an attenuation of the respiratory component of the PPG signal, or identifying attenuations of both.
5. The method of claim 4 , wherein differentiating comprises identifying obstructive apnea when the respiratory component of the PPG includes a modulating segment and the breath signal includes the attenuation.
6. The method of claim 4 , wherein differentiating comprises identifying central apnea when attenuations are identified in both the breath signal and the respiratory component of the PPG signal.
7. The method of claim 4 , wherein the respiratory component of the PPG signal comprises a modulation of a baseline of the PPG signal.
8. The method of claim 4 , wherein the respiratory component of the PPG signal comprises a modulation of an amplitude of cardiac pulses in the PPG signal.
9. The method of claim 4 , wherein the respiratory component of the PPG signal comprises a modulation of a frequency of cardiac pulses in the PPG signal.
10. The method of claim 1 , wherein the breath sensor is a gas analyzer configured to analyze CO2 content of the individual's breath.
11. The method of claim 1 , further comprising:
differentiating, using the apnea analysis system, between initial stages of central apnea and longer term or more severe central apnea based on the oxygen saturation value.
12. The method of claim 1 , further comprising:
determining, using the apnea analysis system, a respiration value indicative of presence or absence of the individual's respiration based on the PPG signal; and
wherein differentiating between obstructive apnea and central apnea is based on the respiration value.
Priority Applications (1)
| Application Number | Priority Date | Filing Date | Title |
|---|---|---|---|
| US14/590,609 US9848820B2 (en) | 2014-01-07 | 2015-01-06 | Apnea analysis system and method |
Applications Claiming Priority (2)
| Application Number | Priority Date | Filing Date | Title |
|---|---|---|---|
| US201461924440P | 2014-01-07 | 2014-01-07 | |
| US14/590,609 US9848820B2 (en) | 2014-01-07 | 2015-01-06 | Apnea analysis system and method |
Publications (2)
| Publication Number | Publication Date |
|---|---|
| US20150190088A1 US20150190088A1 (en) | 2015-07-09 |
| US9848820B2 true US9848820B2 (en) | 2017-12-26 |
Family
ID=52424120
Family Applications (1)
| Application Number | Title | Priority Date | Filing Date |
|---|---|---|---|
| US14/590,609 Active 2035-02-07 US9848820B2 (en) | 2014-01-07 | 2015-01-06 | Apnea analysis system and method |
Country Status (2)
| Country | Link |
|---|---|
| US (1) | US9848820B2 (en) |
| WO (1) | WO2015105787A1 (en) |
Cited By (1)
| Publication number | Priority date | Publication date | Assignee | Title |
|---|---|---|---|---|
| US11844605B2 (en) | 2016-11-10 | 2023-12-19 | The Research Foundation For Suny | System, method and biomarkers for airway obstruction |
Families Citing this family (16)
| Publication number | Priority date | Publication date | Assignee | Title |
|---|---|---|---|---|
| TWI542325B (en) * | 2015-05-14 | 2016-07-21 | 國立中央大學 | Obstructed area determination method and system for sleep apnea syndrome |
| US20180177963A1 (en) * | 2015-06-02 | 2018-06-28 | Koninklijke Philips N.V. | Non-invasive method for monitoring patient respiratory status via successive parameter estimation |
| US10542961B2 (en) | 2015-06-15 | 2020-01-28 | The Research Foundation For The State University Of New York | System and method for infrasonic cardiac monitoring |
| WO2017024293A1 (en) * | 2015-08-06 | 2017-02-09 | Xhale Assurance, Inc. | Methods and devices for monitoring respiration using photoplethysmography sensors |
| WO2017106500A1 (en) * | 2015-12-15 | 2017-06-22 | Respiratory Motion, Inc. | Evaluation of respiratory volume monitoring to detect respiratory compromise before pulse oximetry and eliminate false desaturation alarms |
| WO2017187391A1 (en) * | 2016-04-29 | 2017-11-02 | Fisher & Paykel Healthcare Limited | System for determining airway patency |
| WO2018006121A1 (en) * | 2016-07-07 | 2018-01-11 | Resmed Limited | Diagnosis and monitoring of cardio-respiratory disorders |
| US10898141B2 (en) * | 2016-09-16 | 2021-01-26 | Intelomed, Inc. | System and method for characterizing respiratory stress |
| KR102087583B1 (en) * | 2016-10-18 | 2020-03-11 | 한국전자통신연구원 | Apparatus and method for detecting abnormal respiration |
| KR102013815B1 (en) * | 2016-10-18 | 2019-08-23 | 한국전자통신연구원 | Apparatus and method for analyzing respiration |
| CN106901740B (en) * | 2017-03-07 | 2020-01-10 | 中山大学 | Evaluation device for respiratory airflow stimulation factors during reopening of airway |
| KR102524710B1 (en) * | 2017-03-31 | 2023-04-24 | 데이진 화-마 가부시키가이샤 | Respiratory information acquisition device and respiration information acquisition method |
| US11510591B2 (en) * | 2018-07-11 | 2022-11-29 | Oridion Medical 1987 Ltd. | Capnography systems with indicator lights |
| US11382563B2 (en) * | 2019-03-01 | 2022-07-12 | Respiration AI, LLC | System and method for detecting ventilatory depression and for prompting a patient to breathe |
| CN114027822B (en) * | 2021-04-19 | 2022-11-25 | 北京超思电子技术有限责任公司 | Respiration rate measuring method and device based on PPG signal |
| CN113205022B (en) * | 2021-04-23 | 2022-10-11 | 湖南万脉医疗科技有限公司 | Respiratory anomaly monitoring method and system based on wavelet analysis |
Citations (128)
| Publication number | Priority date | Publication date | Assignee | Title |
|---|---|---|---|---|
| EP0072601A1 (en) | 1978-11-24 | 1983-02-23 | Kenneth Layne Kearns | Respiration monitor |
| US5188108A (en) | 1990-02-15 | 1993-02-23 | Hewlett-Packard Company | Sensor, apparatus and method for non-invasive measurement of oxygen saturation |
| US5368026A (en) | 1993-03-26 | 1994-11-29 | Nellcor Incorporated | Oximeter with motion detection for alarm modification |
| US5398682A (en) | 1992-08-19 | 1995-03-21 | Lynn; Lawrence A. | Method and apparatus for the diagnosis of sleep apnea utilizing a single interface with a human body part |
| US5558096A (en) | 1995-07-21 | 1996-09-24 | Biochem International, Inc. | Blood pulse detection method using autocorrelation |
| US5584295A (en) | 1995-09-01 | 1996-12-17 | Analogic Corporation | System for measuring the period of a quasi-periodic signal |
| US5588425A (en) | 1993-05-21 | 1996-12-31 | Nims, Incorporated | Method and apparatus for discriminating between valid and artifactual pulse waveforms in pulse oximetry |
| US5862805A (en) | 1995-11-16 | 1999-01-26 | Optelmed Ltd. | Apparatus and method for measuring the variability of cardiovascular parameters |
| US5865736A (en) | 1997-09-30 | 1999-02-02 | Nellcor Puritan Bennett, Inc. | Method and apparatus for nuisance alarm reductions |
| US6002952A (en) | 1997-04-14 | 1999-12-14 | Masimo Corporation | Signal processing apparatus and method |
| US6035223A (en) | 1997-11-19 | 2000-03-07 | Nellcor Puritan Bennett Inc. | Method and apparatus for determining the state of an oximetry sensor |
| WO2000021438A1 (en) | 1998-10-15 | 2000-04-20 | University Of Florida Research Foundation | Device for determining respiratory rate from optoplethysmogram |
| US6081742A (en) | 1996-09-10 | 2000-06-27 | Seiko Epson Corporation | Organism state measuring device and relaxation instructing device |
| US6095984A (en) | 1996-04-17 | 2000-08-01 | Seiko Epson Corporation | Arrhythmia detecting apparatus |
| US6129675A (en) | 1998-09-11 | 2000-10-10 | Jay; Gregory D. | Device and method for measuring pulsus paradoxus |
| US6135966A (en) | 1998-05-01 | 2000-10-24 | Ko; Gary Kam-Yuen | Method and apparatus for non-invasive diagnosis of cardiovascular and related disorders |
| US6178261B1 (en) | 1997-08-05 | 2001-01-23 | The Regents Of The University Of Michigan | Method and system for extracting features in a pattern recognition system |
| US6223064B1 (en) | 1992-08-19 | 2001-04-24 | Lawrence A. Lynn | Microprocessor system for the simplified diagnosis of sleep apnea |
| US6229856B1 (en) | 1997-04-14 | 2001-05-08 | Masimo Corporation | Method and apparatus for demodulating signals in a pulse oximetry system |
| US6238351B1 (en) | 1998-09-09 | 2001-05-29 | Ntc Technology Inc. | Method for compensating for non-metabolic changes in respiratory or blood gas profile parameters |
| US6334065B1 (en) | 1998-06-03 | 2001-12-25 | Masimo Corporation | Stereo pulse oximeter |
| US6342039B1 (en) | 1992-08-19 | 2002-01-29 | Lawrence A. Lynn | Microprocessor system for the simplified diagnosis of sleep apnea |
| US6350242B1 (en) | 1995-09-28 | 2002-02-26 | Data Sciences International, Inc. | Respiration monitoring system based on sensed physiological parameters |
| US6405076B1 (en) | 1995-09-20 | 2002-06-11 | Protocol Systems, Inc. | Artifact rejector for repetitive physiologic-event-signal data |
| US20020117173A1 (en) | 2001-02-23 | 2002-08-29 | Lawrence A. Lynn | Asthma resuscitation system and method |
| US6463311B1 (en) | 1998-12-30 | 2002-10-08 | Masimo Corporation | Plethysmograph pulse recognition processor |
| WO2003000125A1 (en) | 2001-06-22 | 2003-01-03 | Cardiodigital Limited | Wavelet-based analysis of pulse oximetry signals |
| US6506153B1 (en) | 1998-09-02 | 2003-01-14 | Med-Dev Limited | Method and apparatus for subject monitoring |
| US20030036685A1 (en) | 2000-04-27 | 2003-02-20 | Vitalsines International, Inc. | Physiological signal monitoring system |
| US6561986B2 (en) | 2001-01-17 | 2003-05-13 | Cardiodynamics International Corporation | Method and apparatus for hemodynamic assessment including fiducial point detection |
| US6564077B2 (en) | 2001-10-10 | 2003-05-13 | Mortara Instrument, Inc. | Method and apparatus for pulse oximetry |
| WO2003055395A1 (en) | 2001-12-28 | 2003-07-10 | Cardiodigital Limited | Analysis of acoustic medical signals |
| US6606511B1 (en) | 1999-01-07 | 2003-08-12 | Masimo Corporation | Pulse oximetry pulse indicator |
| US6609016B1 (en) | 1997-07-14 | 2003-08-19 | Lawrence A. Lynn | Medical microprocessor system and method for providing a ventilation indexed oximetry value |
| US20030158466A1 (en) | 1997-01-27 | 2003-08-21 | Lynn Lawrence A. | Microprocessor system for the analysis of physiologic and financial datasets |
| US20030163054A1 (en) | 2002-02-22 | 2003-08-28 | Dekker Andreas Lubbertus Aloysius Johannes | Monitoring respiration based on plethysmographic heart rate signal |
| EP1344488A2 (en) | 2002-03-16 | 2003-09-17 | Samsung Electronics Co., Ltd. | Diagnostic method and apparatus using light |
| WO2003084396A1 (en) | 2002-04-01 | 2003-10-16 | Aspect Medical Systems, Inc. | System and method of assessment of arousal, pain and stress during anesthesia and sedation |
| US6684090B2 (en) | 1999-01-07 | 2004-01-27 | Masimo Corporation | Pulse oximetry data confidence indicator |
| US6694178B1 (en) | 1998-01-12 | 2004-02-17 | Energy-Lab Technologies Gmbh | Method and device for representing and monitoring functional parameters of a physiological system |
| US6709402B2 (en) | 2002-02-22 | 2004-03-23 | Datex-Ohmeda, Inc. | Apparatus and method for monitoring respiration with a pulse oximeter |
| US6754516B2 (en) | 2001-07-19 | 2004-06-22 | Nellcor Puritan Bennett Incorporated | Nuisance alarm reductions in a physiological monitor |
| US6783498B2 (en) | 2002-03-26 | 2004-08-31 | Vivometrics, Inc. | Method and system for extracting cardiac parameters from plethysmographic signals |
| WO2004075746A2 (en) | 2003-02-27 | 2004-09-10 | Cardiodigital Limited | Method and system for analysing and processing ph0t0plethysmogram signals using wavelet transform |
| US6839581B1 (en) | 2000-04-10 | 2005-01-04 | The Research Foundation Of State University Of New York | Method for detecting Cheyne-Stokes respiration in patients with congestive heart failure |
| US20050004479A1 (en) | 2001-09-28 | 2005-01-06 | Townsend Neil William | Locating features in a photoplethysmograph signal |
| US20050022606A1 (en) | 2003-07-31 | 2005-02-03 | Partin Dale L. | Method for monitoring respiration and heart rate using a fluid-filled bladder |
| US20050027205A1 (en) | 2001-12-14 | 2005-02-03 | Lionel Tarassenko | Combining measurements from breathing rate sensors |
| US20050049470A1 (en) | 2003-08-27 | 2005-03-03 | Terry Alvin Mark | Multi-domain motion estimation and plethysmographic recognition using fuzzy neural-nets |
| US6896661B2 (en) | 2002-02-22 | 2005-05-24 | Datex-Ohmeda, Inc. | Monitoring physiological parameters based on variations in a photoplethysmographic baseline signal |
| US6905470B2 (en) | 2002-04-15 | 2005-06-14 | Samsung Electronics Co., Ltd. | Apparatus and method for detecting heartbeat using PPG |
| US6925324B2 (en) | 2000-05-30 | 2005-08-02 | Vladimir Shusterman | System and device for multi-scale analysis and representation of physiological data |
| US20050222503A1 (en) | 2004-04-06 | 2005-10-06 | Dunlop David A | Apparatus and method for the treatment of sleep apnea, arrhythmia, and partial epilepsy |
| US20050222502A1 (en) | 2004-03-30 | 2005-10-06 | Cooper Philip G | Methods and apparatus for patient monitoring |
| US6966878B2 (en) | 2003-08-28 | 2005-11-22 | Ge Medical Systems Global Technology Company, Llc | Method and apparatus for obtaining a volumetric scan of a periodically moving object |
| US6970792B1 (en) | 2002-12-04 | 2005-11-29 | Masimo Laboratories, Inc. | Systems and methods for determining blood oxygen saturation values using complex number encoding |
| US6980679B2 (en) | 1998-10-23 | 2005-12-27 | Varian Medical System Technologies, Inc. | Method and system for monitoring breathing activity of a subject |
| US7020507B2 (en) | 2002-01-31 | 2006-03-28 | Dolphin Medical, Inc. | Separating motion from cardiac signals using second order derivative of the photo-plethysmogram and fast fourier transforms |
| US7043293B1 (en) | 2002-12-24 | 2006-05-09 | Cardiodynamics International Corporation | Method and apparatus for waveform assessment |
| US20060122476A1 (en) | 2004-06-28 | 2006-06-08 | Van Slyke Braddon M | Relative phase estimation of harmonic frequency component of a plethysmographic waveform |
| US7070566B2 (en) | 2003-03-13 | 2006-07-04 | Ge Medical Systems Information Technologies, Inc. | Artifact rejection using pulse quality values |
| US7079888B2 (en) | 2002-04-11 | 2006-07-18 | Ansar, Inc. | Method and apparatus for monitoring the autonomic nervous system using non-stationary spectral analysis of heart rate and respiratory activity |
| US20060192667A1 (en) | 2002-01-24 | 2006-08-31 | Ammar Al-Ali | Arrhythmia alarm processor |
| US20060217614A1 (en) | 2005-03-24 | 2006-09-28 | Panu Takala | Determination of the clinical state of a subject |
| US7147601B2 (en) | 2003-09-30 | 2006-12-12 | Smithmarks, Inc. | Signal averaging using gating signal obtained from autocorrelation of input signals |
| US20070004977A1 (en) | 2005-06-29 | 2007-01-04 | Norris Mark A | Wavelet transform of a plethysmographic signal |
| US20070010723A1 (en) | 2005-07-05 | 2007-01-11 | Kimmo Uutela | Determination of the clinical state of a subject |
| US20070032639A1 (en) | 2001-02-01 | 2007-02-08 | Susan Gottesman | Identification of new small RNAs and ORFs of E. coli as mediators of cell and intercell regulation |
| US7177682B2 (en) | 2000-04-14 | 2007-02-13 | Cardiac Pacemakers, Inc. | Highly specific technique for discriminating atrial fibrillation from atrial flutter |
| US20070073120A1 (en) | 2005-09-29 | 2007-03-29 | Li Li | System and method for pre-processing waveforms |
| US20070073124A1 (en) | 2005-09-29 | 2007-03-29 | Li Li | System and method for removing artifacts from waveforms |
| US7215986B2 (en) | 1991-03-07 | 2007-05-08 | Masimo Corporation | Signal processing apparatus |
| US7218966B2 (en) | 2003-04-11 | 2007-05-15 | Cardiac Pacemakers, Inc. | Multi-parameter arrhythmia discrimination |
| US20070129636A1 (en) | 2005-12-01 | 2007-06-07 | Friedman Bruce A | Vital sign monitor utilizing historic patient data |
| US20070149890A1 (en) | 2005-12-22 | 2007-06-28 | Dan Li | Method and apparatus for morphology-based arrhythmia classification using cardiac and other physiological signals |
| US7254425B2 (en) | 2004-01-23 | 2007-08-07 | Abbott Laboratories | Method for detecting artifacts in data |
| US20070213621A1 (en) | 2004-11-22 | 2007-09-13 | Widemed Ltd. | Detection of heart failure using a photoplethysmograph |
| US20070213619A1 (en) | 2006-01-17 | 2007-09-13 | The Trustees Of Dartmouth College | Systems And Methods For Noninvasively Monitoring Baroreflex Response And Nominal Blood Volume |
| US7283870B2 (en) | 2005-07-21 | 2007-10-16 | The General Electric Company | Apparatus and method for obtaining cardiac data |
| US20070255146A1 (en) | 2006-04-26 | 2007-11-01 | Angela Andrews | Atrial fibrillation detection using SPO2 |
| US7336982B2 (en) | 2003-07-07 | 2008-02-26 | Sun Kook Yoo | Photoplethysmography (PPG) device and the method thereof |
| US20080066753A1 (en) * | 2004-10-06 | 2008-03-20 | Resmed Limited | Method And Apparatus For Non-Invasive Monitoring Of Respiratory Parameters In Sleep Disordered Breathing |
| US20080077022A1 (en) | 2006-09-27 | 2008-03-27 | Nellcor Puritan Bennett Incorporated | Method and apparatus for detection of venous pulsation |
| US7355512B1 (en) | 2002-01-24 | 2008-04-08 | Masimo Corporation | Parallel alarm processor |
| US7367949B2 (en) | 2003-07-07 | 2008-05-06 | Instrumentarium Corp. | Method and apparatus based on combination of physiological parameters for assessment of analgesia during anesthesia or sedation |
| US7367339B2 (en) | 2002-10-03 | 2008-05-06 | Scott Laboratories, Inc. | Neural networks in sedation and analgesia systems |
| US7398115B2 (en) | 1992-08-19 | 2008-07-08 | Lynn Lawrence A | Pulse oximetry relational alarm system for early recognition of instability and catastrophic occurrences |
| US7403806B2 (en) | 2005-06-28 | 2008-07-22 | General Electric Company | System for prefiltering a plethysmographic signal |
| US7407486B2 (en) | 2002-10-14 | 2008-08-05 | Ge Healthcare Finland Oy | Method and an apparatus for pulse plethysmograph based detection of nociception during anesthesia or sedation |
| US7415297B2 (en) | 2004-03-08 | 2008-08-19 | Masimo Corporation | Physiological parameter system |
| US20080200775A1 (en) | 2007-02-20 | 2008-08-21 | Lynn Lawrence A | Maneuver-based plethysmographic pulse variation detection system and method |
| US7438683B2 (en) | 2004-03-04 | 2008-10-21 | Masimo Corporation | Application identification sensor |
| US7470235B2 (en) | 2005-03-30 | 2008-12-30 | Kabushiki Kaisha Toshiba | Pulse wave detecting device and method therefor |
| US7485095B2 (en) | 2000-05-30 | 2009-02-03 | Vladimir Shusterman | Measurement and analysis of trends in physiological and/or health data |
| EP1507474B1 (en) | 2002-05-29 | 2009-02-11 | Firstbeat Technologies OY | Procedure for deriving reliable information on respiratory activity from heart period measurement |
| US7499835B2 (en) | 2000-06-05 | 2009-03-03 | Masimo Corporation | Variable indication estimator |
| US7523011B2 (en) | 2005-09-27 | 2009-04-21 | Meidensha Corporation | Method for analyzing signal waveform and analyzing vehicle dynamic characteristic |
| US7561912B2 (en) | 2005-09-19 | 2009-07-14 | Cardiac Pacemakers, Inc. | Use of periodicity in medical data analysis |
| US20090247837A1 (en) | 2008-03-27 | 2009-10-01 | Nellcor Puritan Bennett Llc | System And Method For Diagnosing Sleep Apnea |
| US7610324B2 (en) | 2003-07-10 | 2009-10-27 | Lidror Troyansky | System for detection and estimation of periodic patterns in a noisy signal |
| US20090326831A1 (en) | 2008-06-30 | 2009-12-31 | Nellcor Puritan Bennett Ireland | Concatenated Scalograms |
| US20090326395A1 (en) | 2008-06-30 | 2009-12-31 | Nellcor Puritan Bennett Ireland | Systems and methods for detecting pulses |
| US20090326349A1 (en) | 2008-06-30 | 2009-12-31 | Nellcor Puritan Bennett Ireland | Consistent Signal Selection By Signal Segment Selection Techniques |
| US20100063366A1 (en) | 2008-09-10 | 2010-03-11 | James Ochs | System And Method For Detecting Ventilatory Instability |
| WO2010030238A1 (en) | 2008-09-15 | 2010-03-18 | Nanyang Technological University | A method for detecting heartbeat and/or respiration |
| US7691067B2 (en) | 2006-06-14 | 2010-04-06 | Advanced Brain Monitoring, Inc. | Method for measuring central venous pressure or respiratory effort |
| US7690378B1 (en) | 2004-07-21 | 2010-04-06 | Pacesetter, Inc. | Methods, systems and devices for monitoring respiratory disorders |
| US7706852B2 (en) | 2006-01-30 | 2010-04-27 | Nellcor Puritan Bennett Llc | System and method for detection of unstable oxygen saturation |
| US20100113909A1 (en) | 2008-10-31 | 2010-05-06 | Nellcor Puritan Bennett Llc | System And Method For Facilitating Observation Of Monitored Physiologic Data |
| US20100113908A1 (en) | 2008-10-31 | 2010-05-06 | Nellcor Puritan Bennett Llc | System And Method For Facilitating Observation Of Monitored Physiologic Data |
| US20100113904A1 (en) | 2008-11-05 | 2010-05-06 | Nellcor Puritan Bennett Llc | System And Method For Facilitating Observation Of Monitored Physiologic Data |
| US7801591B1 (en) | 2000-05-30 | 2010-09-21 | Vladimir Shusterman | Digital healthcare information management |
| US20100286495A1 (en) | 2009-05-07 | 2010-11-11 | Nellcor Puritan Bennett Ireland | Selection Of Signal Regions For Parameter Extraction |
| US7869980B2 (en) | 2005-11-03 | 2011-01-11 | International Business Machines Corporation | Using statistics to locate signals in noise |
| US20110066062A1 (en) | 2009-09-14 | 2011-03-17 | Matt Banet | Body-worn monitor for measuring respiration rate |
| US20110071406A1 (en) | 2009-09-21 | 2011-03-24 | Nellcor Puritan Bennett Ireland | Determining A Characteristic Respiration Rate |
| US7976472B2 (en) | 2004-09-07 | 2011-07-12 | Masimo Corporation | Noninvasive hypovolemia monitor |
| US20110190599A1 (en) | 2010-02-02 | 2011-08-04 | Nellcor Puritan Bennett Llc | System And Method For Diagnosing Sleep Apnea Based On Results Of Multiple Approaches To Sleep Apnea Identification |
| US8019400B2 (en) | 1994-10-07 | 2011-09-13 | Masimo Corporation | Signal processing apparatus |
| US8130105B2 (en) | 2005-03-01 | 2012-03-06 | Masimo Laboratories, Inc. | Noninvasive multi-parameter patient monitor |
| US8203438B2 (en) | 2008-07-29 | 2012-06-19 | Masimo Corporation | Alarm suspend system |
| US8275553B2 (en) | 2008-02-19 | 2012-09-25 | Nellcor Puritan Bennett Llc | System and method for evaluating physiological parameter data |
| US8364225B2 (en) | 2009-05-20 | 2013-01-29 | Nellcor Puritan Bennett Ireland | Estimating transform values using signal estimates |
| US20130172759A1 (en) | 2011-08-08 | 2013-07-04 | Richard J. Melker | Systems And Methods For Using Photoplethysmography In The Administration Of Narcotic Reversal Agents |
| US8750953B2 (en) | 2008-02-19 | 2014-06-10 | Covidien Lp | Methods and systems for alerting practitioners to physiological conditions |
| US20140171769A1 (en) * | 2012-12-18 | 2014-06-19 | Covidien Lp | Systems and methods for distinguishing between central apnea and obstructive apnea |
| US20140275938A1 (en) | 2013-03-14 | 2014-09-18 | Covidien Lp | System and method for determining repetitive airflow reductions |
| US20140275887A1 (en) | 2013-03-15 | 2014-09-18 | Nellcor Puritan Bennett Ireland | Systems And Methods For Monitoring Respiratory Depression |
Family Cites Families (3)
| Publication number | Priority date | Publication date | Assignee | Title |
|---|---|---|---|---|
| IL130371A (en) | 1999-06-08 | 2004-06-01 | Oridion Medical Ltd | Capnography waveform interpreter |
| WO2009133561A1 (en) | 2008-04-29 | 2009-11-05 | Oridion Medical 1987 Ltd. | Wireless capnography |
| EP2374493A3 (en) | 2008-05-28 | 2012-12-12 | Oridion Medical 1987 Ltd. | Methods, apparatus and systems for monitoring CO2 |
-
2015
- 2015-01-06 WO PCT/US2015/010292 patent/WO2015105787A1/en active Application Filing
- 2015-01-06 US US14/590,609 patent/US9848820B2/en active Active
Patent Citations (156)
| Publication number | Priority date | Publication date | Assignee | Title |
|---|---|---|---|---|
| EP0072601A1 (en) | 1978-11-24 | 1983-02-23 | Kenneth Layne Kearns | Respiration monitor |
| US5188108A (en) | 1990-02-15 | 1993-02-23 | Hewlett-Packard Company | Sensor, apparatus and method for non-invasive measurement of oxygen saturation |
| US5285784A (en) | 1990-02-15 | 1994-02-15 | Hewlett-Packard Company | Sensor, apparatus and method for non-invasive measurement of oxygen saturation |
| US5285783A (en) | 1990-02-15 | 1994-02-15 | Hewlett-Packard Company | Sensor, apparatus and method for non-invasive measurement of oxygen saturation |
| US7215986B2 (en) | 1991-03-07 | 2007-05-08 | Masimo Corporation | Signal processing apparatus |
| US7496393B2 (en) | 1991-03-07 | 2009-02-24 | Masimo Corporation | Signal processing apparatus |
| US5891023A (en) | 1992-08-19 | 1999-04-06 | Lynn; Lawrence A. | Apparatus for the diagnosis of sleep apnea |
| US5398682A (en) | 1992-08-19 | 1995-03-21 | Lynn; Lawrence A. | Method and apparatus for the diagnosis of sleep apnea utilizing a single interface with a human body part |
| US5605151A (en) | 1992-08-19 | 1997-02-25 | Lynn; Lawrence A. | Method for the diagnosis of sleep apnea |
| US6748252B2 (en) | 1992-08-19 | 2004-06-08 | Lawrence A. Lynn | System and method for automatic detection and indication of airway instability |
| US6223064B1 (en) | 1992-08-19 | 2001-04-24 | Lawrence A. Lynn | Microprocessor system for the simplified diagnosis of sleep apnea |
| US6342039B1 (en) | 1992-08-19 | 2002-01-29 | Lawrence A. Lynn | Microprocessor system for the simplified diagnosis of sleep apnea |
| US6760608B2 (en) | 1992-08-19 | 2004-07-06 | Lawrence A. Lynn | Oximetry system for detecting ventilation instability |
| US7398115B2 (en) | 1992-08-19 | 2008-07-08 | Lynn Lawrence A | Pulse oximetry relational alarm system for early recognition of instability and catastrophic occurrences |
| US5368026A (en) | 1993-03-26 | 1994-11-29 | Nellcor Incorporated | Oximeter with motion detection for alarm modification |
| US5588425A (en) | 1993-05-21 | 1996-12-31 | Nims, Incorporated | Method and apparatus for discriminating between valid and artifactual pulse waveforms in pulse oximetry |
| US8019400B2 (en) | 1994-10-07 | 2011-09-13 | Masimo Corporation | Signal processing apparatus |
| US5558096A (en) | 1995-07-21 | 1996-09-24 | Biochem International, Inc. | Blood pulse detection method using autocorrelation |
| US5584295A (en) | 1995-09-01 | 1996-12-17 | Analogic Corporation | System for measuring the period of a quasi-periodic signal |
| US6405076B1 (en) | 1995-09-20 | 2002-06-11 | Protocol Systems, Inc. | Artifact rejector for repetitive physiologic-event-signal data |
| US6350242B1 (en) | 1995-09-28 | 2002-02-26 | Data Sciences International, Inc. | Respiration monitoring system based on sensed physiological parameters |
| US5862805A (en) | 1995-11-16 | 1999-01-26 | Optelmed Ltd. | Apparatus and method for measuring the variability of cardiovascular parameters |
| US6095984A (en) | 1996-04-17 | 2000-08-01 | Seiko Epson Corporation | Arrhythmia detecting apparatus |
| US6081742A (en) | 1996-09-10 | 2000-06-27 | Seiko Epson Corporation | Organism state measuring device and relaxation instructing device |
| US20030158466A1 (en) | 1997-01-27 | 2003-08-21 | Lynn Lawrence A. | Microprocessor system for the analysis of physiologic and financial datasets |
| US6229856B1 (en) | 1997-04-14 | 2001-05-08 | Masimo Corporation | Method and apparatus for demodulating signals in a pulse oximetry system |
| US6002952A (en) | 1997-04-14 | 1999-12-14 | Masimo Corporation | Signal processing apparatus and method |
| US6609016B1 (en) | 1997-07-14 | 2003-08-19 | Lawrence A. Lynn | Medical microprocessor system and method for providing a ventilation indexed oximetry value |
| US6178261B1 (en) | 1997-08-05 | 2001-01-23 | The Regents Of The University Of Michigan | Method and system for extracting features in a pattern recognition system |
| US5865736A (en) | 1997-09-30 | 1999-02-02 | Nellcor Puritan Bennett, Inc. | Method and apparatus for nuisance alarm reductions |
| US6035223A (en) | 1997-11-19 | 2000-03-07 | Nellcor Puritan Bennett Inc. | Method and apparatus for determining the state of an oximetry sensor |
| US6694178B1 (en) | 1998-01-12 | 2004-02-17 | Energy-Lab Technologies Gmbh | Method and device for representing and monitoring functional parameters of a physiological system |
| US6135966A (en) | 1998-05-01 | 2000-10-24 | Ko; Gary Kam-Yuen | Method and apparatus for non-invasive diagnosis of cardiovascular and related disorders |
| US6334065B1 (en) | 1998-06-03 | 2001-12-25 | Masimo Corporation | Stereo pulse oximeter |
| US7894868B2 (en) | 1998-06-03 | 2011-02-22 | Masimo Corporation | Physiological monitor |
| US7899507B2 (en) | 1998-06-03 | 2011-03-01 | Masimo Corporation | Physiological monitor |
| US6506153B1 (en) | 1998-09-02 | 2003-01-14 | Med-Dev Limited | Method and apparatus for subject monitoring |
| US6238351B1 (en) | 1998-09-09 | 2001-05-29 | Ntc Technology Inc. | Method for compensating for non-metabolic changes in respiratory or blood gas profile parameters |
| US6325761B1 (en) | 1998-09-11 | 2001-12-04 | Gregory D. Jay | Device and method for measuring pulsus paradoxus |
| US6129675A (en) | 1998-09-11 | 2000-10-10 | Jay; Gregory D. | Device and method for measuring pulsus paradoxus |
| WO2000021438A1 (en) | 1998-10-15 | 2000-04-20 | University Of Florida Research Foundation | Device for determining respiratory rate from optoplethysmogram |
| US6980679B2 (en) | 1998-10-23 | 2005-12-27 | Varian Medical System Technologies, Inc. | Method and system for monitoring breathing activity of a subject |
| US7988637B2 (en) | 1998-12-30 | 2011-08-02 | Masimo Corporation | Plethysmograph pulse recognition processor |
| US6816741B2 (en) | 1998-12-30 | 2004-11-09 | Masimo Corporation | Plethysmograph pulse recognition processor |
| US6463311B1 (en) | 1998-12-30 | 2002-10-08 | Masimo Corporation | Plethysmograph pulse recognition processor |
| US7044918B2 (en) | 1998-12-30 | 2006-05-16 | Masimo Corporation | Plethysmograph pulse recognition processor |
| US6684090B2 (en) | 1999-01-07 | 2004-01-27 | Masimo Corporation | Pulse oximetry data confidence indicator |
| US8046040B2 (en) | 1999-01-07 | 2011-10-25 | Masimo Corporation | Pulse oximetry data confidence indicator |
| US6606511B1 (en) | 1999-01-07 | 2003-08-12 | Masimo Corporation | Pulse oximetry pulse indicator |
| US6839581B1 (en) | 2000-04-10 | 2005-01-04 | The Research Foundation Of State University Of New York | Method for detecting Cheyne-Stokes respiration in patients with congestive heart failure |
| US7177682B2 (en) | 2000-04-14 | 2007-02-13 | Cardiac Pacemakers, Inc. | Highly specific technique for discriminating atrial fibrillation from atrial flutter |
| US20030036685A1 (en) | 2000-04-27 | 2003-02-20 | Vitalsines International, Inc. | Physiological signal monitoring system |
| US6925324B2 (en) | 2000-05-30 | 2005-08-02 | Vladimir Shusterman | System and device for multi-scale analysis and representation of physiological data |
| US7801591B1 (en) | 2000-05-30 | 2010-09-21 | Vladimir Shusterman | Digital healthcare information management |
| US7485095B2 (en) | 2000-05-30 | 2009-02-03 | Vladimir Shusterman | Measurement and analysis of trends in physiological and/or health data |
| US7499835B2 (en) | 2000-06-05 | 2009-03-03 | Masimo Corporation | Variable indication estimator |
| US6561986B2 (en) | 2001-01-17 | 2003-05-13 | Cardiodynamics International Corporation | Method and apparatus for hemodynamic assessment including fiducial point detection |
| US20070032639A1 (en) | 2001-02-01 | 2007-02-08 | Susan Gottesman | Identification of new small RNAs and ORFs of E. coli as mediators of cell and intercell regulation |
| US20020117173A1 (en) | 2001-02-23 | 2002-08-29 | Lawrence A. Lynn | Asthma resuscitation system and method |
| WO2003000125A1 (en) | 2001-06-22 | 2003-01-03 | Cardiodigital Limited | Wavelet-based analysis of pulse oximetry signals |
| US20050070774A1 (en) | 2001-06-22 | 2005-03-31 | Addison Paul Stanley | Wavelet-based analysis of pulse oximetry signals |
| US7035679B2 (en) | 2001-06-22 | 2006-04-25 | Cardiodigital Limited | Wavelet-based analysis of pulse oximetry signals |
| US6754516B2 (en) | 2001-07-19 | 2004-06-22 | Nellcor Puritan Bennett Incorporated | Nuisance alarm reductions in a physiological monitor |
| US20050004479A1 (en) | 2001-09-28 | 2005-01-06 | Townsend Neil William | Locating features in a photoplethysmograph signal |
| US6564077B2 (en) | 2001-10-10 | 2003-05-13 | Mortara Instrument, Inc. | Method and apparatus for pulse oximetry |
| US20050027205A1 (en) | 2001-12-14 | 2005-02-03 | Lionel Tarassenko | Combining measurements from breathing rate sensors |
| WO2003055395A1 (en) | 2001-12-28 | 2003-07-10 | Cardiodigital Limited | Analysis of acoustic medical signals |
| US7355512B1 (en) | 2002-01-24 | 2008-04-08 | Masimo Corporation | Parallel alarm processor |
| US20060192667A1 (en) | 2002-01-24 | 2006-08-31 | Ammar Al-Ali | Arrhythmia alarm processor |
| US7190261B2 (en) | 2002-01-24 | 2007-03-13 | Masimo Corporation | Arrhythmia alarm processor |
| US20060211930A1 (en) | 2002-01-31 | 2006-09-21 | Scharf John E | Separating motion from cardiac signals using second order derivative of the photo-plethysmogram and fast fourier transforms |
| US7020507B2 (en) | 2002-01-31 | 2006-03-28 | Dolphin Medical, Inc. | Separating motion from cardiac signals using second order derivative of the photo-plethysmogram and fast fourier transforms |
| US6896661B2 (en) | 2002-02-22 | 2005-05-24 | Datex-Ohmeda, Inc. | Monitoring physiological parameters based on variations in a photoplethysmographic baseline signal |
| US6702752B2 (en) | 2002-02-22 | 2004-03-09 | Datex-Ohmeda, Inc. | Monitoring respiration based on plethysmographic heart rate signal |
| US20030163054A1 (en) | 2002-02-22 | 2003-08-28 | Dekker Andreas Lubbertus Aloysius Johannes | Monitoring respiration based on plethysmographic heart rate signal |
| US6709402B2 (en) | 2002-02-22 | 2004-03-23 | Datex-Ohmeda, Inc. | Apparatus and method for monitoring respiration with a pulse oximeter |
| EP1344488A2 (en) | 2002-03-16 | 2003-09-17 | Samsung Electronics Co., Ltd. | Diagnostic method and apparatus using light |
| US6783498B2 (en) | 2002-03-26 | 2004-08-31 | Vivometrics, Inc. | Method and system for extracting cardiac parameters from plethysmographic signals |
| WO2003084396A1 (en) | 2002-04-01 | 2003-10-16 | Aspect Medical Systems, Inc. | System and method of assessment of arousal, pain and stress during anesthesia and sedation |
| US20040015091A1 (en) | 2002-04-01 | 2004-01-22 | Aspect Medical Systems | System and method of assessment of arousal, pain and stress during anesthesia and sedation |
| US7079888B2 (en) | 2002-04-11 | 2006-07-18 | Ansar, Inc. | Method and apparatus for monitoring the autonomic nervous system using non-stationary spectral analysis of heart rate and respiratory activity |
| US6905470B2 (en) | 2002-04-15 | 2005-06-14 | Samsung Electronics Co., Ltd. | Apparatus and method for detecting heartbeat using PPG |
| EP1507474B1 (en) | 2002-05-29 | 2009-02-11 | Firstbeat Technologies OY | Procedure for deriving reliable information on respiratory activity from heart period measurement |
| US7367339B2 (en) | 2002-10-03 | 2008-05-06 | Scott Laboratories, Inc. | Neural networks in sedation and analgesia systems |
| US7407486B2 (en) | 2002-10-14 | 2008-08-05 | Ge Healthcare Finland Oy | Method and an apparatus for pulse plethysmograph based detection of nociception during anesthesia or sedation |
| US7440787B2 (en) | 2002-12-04 | 2008-10-21 | Masimo Laboratories, Inc. | Systems and methods for determining blood oxygen saturation values using complex number encoding |
| US6970792B1 (en) | 2002-12-04 | 2005-11-29 | Masimo Laboratories, Inc. | Systems and methods for determining blood oxygen saturation values using complex number encoding |
| US7043293B1 (en) | 2002-12-24 | 2006-05-09 | Cardiodynamics International Corporation | Method and apparatus for waveform assessment |
| US20060258921A1 (en) | 2003-02-27 | 2006-11-16 | Cardiodigital Limited | Method of analyzing and processing signals |
| WO2004075746A2 (en) | 2003-02-27 | 2004-09-10 | Cardiodigital Limited | Method and system for analysing and processing ph0t0plethysmogram signals using wavelet transform |
| US7070566B2 (en) | 2003-03-13 | 2006-07-04 | Ge Medical Systems Information Technologies, Inc. | Artifact rejection using pulse quality values |
| US7218966B2 (en) | 2003-04-11 | 2007-05-15 | Cardiac Pacemakers, Inc. | Multi-parameter arrhythmia discrimination |
| US20070293896A1 (en) | 2003-04-11 | 2007-12-20 | Paul Haefner | Multi-parameter arrhythmia discrimination |
| US20080167540A1 (en) | 2003-07-07 | 2008-07-10 | Instrumentarium Corp. | Method and Apparatus Based on Combination of Physiological Parameters for Assessment of Analgesia During Anesthesia or Sedation |
| US7367949B2 (en) | 2003-07-07 | 2008-05-06 | Instrumentarium Corp. | Method and apparatus based on combination of physiological parameters for assessment of analgesia during anesthesia or sedation |
| US7336982B2 (en) | 2003-07-07 | 2008-02-26 | Sun Kook Yoo | Photoplethysmography (PPG) device and the method thereof |
| US7610324B2 (en) | 2003-07-10 | 2009-10-27 | Lidror Troyansky | System for detection and estimation of periodic patterns in a noisy signal |
| US20050022606A1 (en) | 2003-07-31 | 2005-02-03 | Partin Dale L. | Method for monitoring respiration and heart rate using a fluid-filled bladder |
| US6931269B2 (en) | 2003-08-27 | 2005-08-16 | Datex-Ohmeda, Inc. | Multi-domain motion estimation and plethysmographic recognition using fuzzy neural-nets |
| US20050049470A1 (en) | 2003-08-27 | 2005-03-03 | Terry Alvin Mark | Multi-domain motion estimation and plethysmographic recognition using fuzzy neural-nets |
| US6966878B2 (en) | 2003-08-28 | 2005-11-22 | Ge Medical Systems Global Technology Company, Llc | Method and apparatus for obtaining a volumetric scan of a periodically moving object |
| US7147601B2 (en) | 2003-09-30 | 2006-12-12 | Smithmarks, Inc. | Signal averaging using gating signal obtained from autocorrelation of input signals |
| US7254425B2 (en) | 2004-01-23 | 2007-08-07 | Abbott Laboratories | Method for detecting artifacts in data |
| US7438683B2 (en) | 2004-03-04 | 2008-10-21 | Masimo Corporation | Application identification sensor |
| US7415297B2 (en) | 2004-03-08 | 2008-08-19 | Masimo Corporation | Physiological parameter system |
| US20050222502A1 (en) | 2004-03-30 | 2005-10-06 | Cooper Philip G | Methods and apparatus for patient monitoring |
| US20050222503A1 (en) | 2004-04-06 | 2005-10-06 | Dunlop David A | Apparatus and method for the treatment of sleep apnea, arrhythmia, and partial epilepsy |
| US20060122476A1 (en) | 2004-06-28 | 2006-06-08 | Van Slyke Braddon M | Relative phase estimation of harmonic frequency component of a plethysmographic waveform |
| US7690378B1 (en) | 2004-07-21 | 2010-04-06 | Pacesetter, Inc. | Methods, systems and devices for monitoring respiratory disorders |
| US7976472B2 (en) | 2004-09-07 | 2011-07-12 | Masimo Corporation | Noninvasive hypovolemia monitor |
| US20080066753A1 (en) * | 2004-10-06 | 2008-03-20 | Resmed Limited | Method And Apparatus For Non-Invasive Monitoring Of Respiratory Parameters In Sleep Disordered Breathing |
| US20070213621A1 (en) | 2004-11-22 | 2007-09-13 | Widemed Ltd. | Detection of heart failure using a photoplethysmograph |
| US8130105B2 (en) | 2005-03-01 | 2012-03-06 | Masimo Laboratories, Inc. | Noninvasive multi-parameter patient monitor |
| US20060217614A1 (en) | 2005-03-24 | 2006-09-28 | Panu Takala | Determination of the clinical state of a subject |
| US7470235B2 (en) | 2005-03-30 | 2008-12-30 | Kabushiki Kaisha Toshiba | Pulse wave detecting device and method therefor |
| US7403806B2 (en) | 2005-06-28 | 2008-07-22 | General Electric Company | System for prefiltering a plethysmographic signal |
| US20070004977A1 (en) | 2005-06-29 | 2007-01-04 | Norris Mark A | Wavelet transform of a plethysmographic signal |
| US20070010723A1 (en) | 2005-07-05 | 2007-01-11 | Kimmo Uutela | Determination of the clinical state of a subject |
| US7283870B2 (en) | 2005-07-21 | 2007-10-16 | The General Electric Company | Apparatus and method for obtaining cardiac data |
| US7561912B2 (en) | 2005-09-19 | 2009-07-14 | Cardiac Pacemakers, Inc. | Use of periodicity in medical data analysis |
| US7523011B2 (en) | 2005-09-27 | 2009-04-21 | Meidensha Corporation | Method for analyzing signal waveform and analyzing vehicle dynamic characteristic |
| US20070073120A1 (en) | 2005-09-29 | 2007-03-29 | Li Li | System and method for pre-processing waveforms |
| US20070073124A1 (en) | 2005-09-29 | 2007-03-29 | Li Li | System and method for removing artifacts from waveforms |
| US7869980B2 (en) | 2005-11-03 | 2011-01-11 | International Business Machines Corporation | Using statistics to locate signals in noise |
| US20070129636A1 (en) | 2005-12-01 | 2007-06-07 | Friedman Bruce A | Vital sign monitor utilizing historic patient data |
| US20070149890A1 (en) | 2005-12-22 | 2007-06-28 | Dan Li | Method and apparatus for morphology-based arrhythmia classification using cardiac and other physiological signals |
| US20070213619A1 (en) | 2006-01-17 | 2007-09-13 | The Trustees Of Dartmouth College | Systems And Methods For Noninvasively Monitoring Baroreflex Response And Nominal Blood Volume |
| US7706852B2 (en) | 2006-01-30 | 2010-04-27 | Nellcor Puritan Bennett Llc | System and method for detection of unstable oxygen saturation |
| US20070255146A1 (en) | 2006-04-26 | 2007-11-01 | Angela Andrews | Atrial fibrillation detection using SPO2 |
| US7691067B2 (en) | 2006-06-14 | 2010-04-06 | Advanced Brain Monitoring, Inc. | Method for measuring central venous pressure or respiratory effort |
| US20080077022A1 (en) | 2006-09-27 | 2008-03-27 | Nellcor Puritan Bennett Incorporated | Method and apparatus for detection of venous pulsation |
| US20080200775A1 (en) | 2007-02-20 | 2008-08-21 | Lynn Lawrence A | Maneuver-based plethysmographic pulse variation detection system and method |
| US8275553B2 (en) | 2008-02-19 | 2012-09-25 | Nellcor Puritan Bennett Llc | System and method for evaluating physiological parameter data |
| US8750953B2 (en) | 2008-02-19 | 2014-06-10 | Covidien Lp | Methods and systems for alerting practitioners to physiological conditions |
| US20090247837A1 (en) | 2008-03-27 | 2009-10-01 | Nellcor Puritan Bennett Llc | System And Method For Diagnosing Sleep Apnea |
| US20090326831A1 (en) | 2008-06-30 | 2009-12-31 | Nellcor Puritan Bennett Ireland | Concatenated Scalograms |
| US20090326395A1 (en) | 2008-06-30 | 2009-12-31 | Nellcor Puritan Bennett Ireland | Systems and methods for detecting pulses |
| US20090326349A1 (en) | 2008-06-30 | 2009-12-31 | Nellcor Puritan Bennett Ireland | Consistent Signal Selection By Signal Segment Selection Techniques |
| US8203438B2 (en) | 2008-07-29 | 2012-06-19 | Masimo Corporation | Alarm suspend system |
| US20100063366A1 (en) | 2008-09-10 | 2010-03-11 | James Ochs | System And Method For Detecting Ventilatory Instability |
| US8398555B2 (en) | 2008-09-10 | 2013-03-19 | Covidien Lp | System and method for detecting ventilatory instability |
| WO2010030238A1 (en) | 2008-09-15 | 2010-03-18 | Nanyang Technological University | A method for detecting heartbeat and/or respiration |
| US20100113908A1 (en) | 2008-10-31 | 2010-05-06 | Nellcor Puritan Bennett Llc | System And Method For Facilitating Observation Of Monitored Physiologic Data |
| US20100113909A1 (en) | 2008-10-31 | 2010-05-06 | Nellcor Puritan Bennett Llc | System And Method For Facilitating Observation Of Monitored Physiologic Data |
| US8515513B2 (en) | 2008-11-05 | 2013-08-20 | Covidien Lp | System and method for facilitating observation of monitored physiologic data |
| US20100113904A1 (en) | 2008-11-05 | 2010-05-06 | Nellcor Puritan Bennett Llc | System And Method For Facilitating Observation Of Monitored Physiologic Data |
| US20100286495A1 (en) | 2009-05-07 | 2010-11-11 | Nellcor Puritan Bennett Ireland | Selection Of Signal Regions For Parameter Extraction |
| US8364225B2 (en) | 2009-05-20 | 2013-01-29 | Nellcor Puritan Bennett Ireland | Estimating transform values using signal estimates |
| US20110066062A1 (en) | 2009-09-14 | 2011-03-17 | Matt Banet | Body-worn monitor for measuring respiration rate |
| US20110071406A1 (en) | 2009-09-21 | 2011-03-24 | Nellcor Puritan Bennett Ireland | Determining A Characteristic Respiration Rate |
| US20110190599A1 (en) | 2010-02-02 | 2011-08-04 | Nellcor Puritan Bennett Llc | System And Method For Diagnosing Sleep Apnea Based On Results Of Multiple Approaches To Sleep Apnea Identification |
| US8758243B2 (en) | 2010-02-02 | 2014-06-24 | Covidien Lp | System and method for diagnosing sleep apnea based on results of multiple approaches to sleep apnea identification |
| US20130172759A1 (en) | 2011-08-08 | 2013-07-04 | Richard J. Melker | Systems And Methods For Using Photoplethysmography In The Administration Of Narcotic Reversal Agents |
| US20140171769A1 (en) * | 2012-12-18 | 2014-06-19 | Covidien Lp | Systems and methods for distinguishing between central apnea and obstructive apnea |
| US20140275938A1 (en) | 2013-03-14 | 2014-09-18 | Covidien Lp | System and method for determining repetitive airflow reductions |
| US20140275887A1 (en) | 2013-03-15 | 2014-09-18 | Nellcor Puritan Bennett Ireland | Systems And Methods For Monitoring Respiratory Depression |
Non-Patent Citations (9)
| Title |
|---|
| International Search Report and Written Opinion of the International Searching Authority for application No. PCT/US2013/075944, dated Apr. 3, 2014. |
| Lindberg, L.G., Ughall, H., Oberg, P.A., "Monitoring of respiratory and heart rates using a fibre-optic sensor," Medical & Biological Engineering & Computing, Sep. 1992, pp. 533-537. |
| PCT Notification of Transmittal of the International Search Report and the Written Opinion of the International Searching Authority, or the Declaration (PCT Rule 441), dated Apr. 3, 2014, Covidien LP et al., International Filing Date Dec. 18, 2013. |
| PCT Notification of Transmittal of the International Search Report and the Written Opinion of the International Searching Authority, or the Declaration, dated Mar. 20, 2015, International application No. PCT/US2015/010292, International filing date Jan. 6, 2015. |
| Rapaport and Cousin, "New phase-lock tracking instrument for foetal breathing monitoring," Med. & Bioi. Eng. & Camp. 1982, vol. 20, pp. 1-6. |
| Risk, Lofsky, Ann MD, Sleep Apnea and Narcotic Postoperative Pain Medication: A Morbidity and Mortality; http://www.apsf.org/newsletters/html/2002/summer/04sleepapnea.htm. |
| Stagg and Gennser, "Electronic analysis of foetal breathing movements: A practical application of phase-locked-loop principles," Journal of Med. Eng. and Tech., Sep. 1978, vol. 2, No. 5, pp. 246-249. |
| Thomas, R. J, Mietus, J. E., Peng, Chung-Kang; Gilmartin, Geoffrey, Daly, R> W., Goldberger, A. L., Gottlieb, D.J., "Differentiating Obstructive from Central and Complex Sleep Apnea Using an Automated Electrocardiogram-Based Method", Sleep, vol. 30, No. 12, 2007. |
| Waugh et al, Comparison of Apnea Detection by Pulse Oximetry Versus Capnography, AARC Congress, Orlando FL, Poster, 2007. |
Cited By (1)
| Publication number | Priority date | Publication date | Assignee | Title |
|---|---|---|---|---|
| US11844605B2 (en) | 2016-11-10 | 2023-12-19 | The Research Foundation For Suny | System, method and biomarkers for airway obstruction |
Also Published As
| Publication number | Publication date |
|---|---|
| US20150190088A1 (en) | 2015-07-09 |
| WO2015105787A1 (en) | 2015-07-16 |
Similar Documents
| Publication | Publication Date | Title |
|---|---|---|
| US9848820B2 (en) | Apnea analysis system and method | |
| CA2947910C (en) | Systems and methods for analyzing a respiratory parameter | |
| US11478155B2 (en) | Hypovolemia diagnosis technique | |
| US10532170B2 (en) | Method and system for classification of photo-plethysmographically detected respiratory effort | |
| CA2766879C (en) | Systems and methods for detecting effort events | |
| US8801619B2 (en) | Photoplethysmography for determining ventilation weaning readiness | |
| JP5441707B2 (en) | Plethysmograph variation processor | |
| JP6422653B2 (en) | Monitoring device | |
| US9357937B2 (en) | System and method for determining stroke volume of an individual | |
| US7922666B2 (en) | Pulse oximeter based techniques for controlling anesthesia levels and ventilation levels in subjects | |
| US20190365281A1 (en) | Physiologic monitoring decision support system combining capnometry and oxygen saturation | |
| US20140073890A1 (en) | Systems and methods for determining fluid responsiveness | |
| US20140066782A1 (en) | System and method for determining a resting heart rate of an individual | |
| Clarke | Signal quality analysis in pulse oximetry: Modelling and detection of motion artifact | |
| US20140275938A1 (en) | System and method for determining repetitive airflow reductions | |
| EP2988660B1 (en) | Devices for monitoring respiration with photoplethymography | |
| US20150190060A1 (en) | Method, device and system for calculating integrated capnograph-oximetry values |
Legal Events
| Date | Code | Title | Description |
|---|---|---|---|
| AS | Assignment |
Owner name: COVIDIEN LP, MASSACHUSETTS Free format text: ASSIGNMENT OF ASSIGNORS INTEREST;ASSIGNORS:CHEN, BO;MESTEK, MICHAEL L.;KADLEC, RON J.;AND OTHERS;SIGNING DATES FROM 20150909 TO 20160115;REEL/FRAME:037561/0735 |
|
| STCF | Information on status: patent grant |
Free format text: PATENTED CASE |
|
| MAFP | Maintenance fee payment |
Free format text: PAYMENT OF MAINTENANCE FEE, 4TH YEAR, LARGE ENTITY (ORIGINAL EVENT CODE: M1551); ENTITY STATUS OF PATENT OWNER: LARGE ENTITY Year of fee payment: 4 |