WO1994008237A1 - Method and apparatus for direct spectrophotometric measurements in unaltered whole blood - Google Patents

Method and apparatus for direct spectrophotometric measurements in unaltered whole blood Download PDF

Info

Publication number
WO1994008237A1
WO1994008237A1 PCT/US1993/009154 US9309154W WO9408237A1 WO 1994008237 A1 WO1994008237 A1 WO 1994008237A1 US 9309154 W US9309154 W US 9309154W WO 9408237 A1 WO9408237 A1 WO 9408237A1
Authority
WO
WIPO (PCT)
Prior art keywords
vector
radiation
sample
concentrations
scattering
Prior art date
Application number
PCT/US1993/009154
Other languages
French (fr)
Inventor
Albert P. Shepherd
John M. Steinke
Original Assignee
Board Of Regents, The University Of Texas System
Priority date (The priority date is an assumption and is not a legal conclusion. Google has not performed a legal analysis and makes no representation as to the accuracy of the date listed.)
Filing date
Publication date
Application filed by Board Of Regents, The University Of Texas System filed Critical Board Of Regents, The University Of Texas System
Priority to DE69328783T priority Critical patent/DE69328783T2/en
Priority to AU51410/93A priority patent/AU5141093A/en
Priority to EP93922402A priority patent/EP0663070B1/en
Priority to DK93922402T priority patent/DK0663070T3/en
Publication of WO1994008237A1 publication Critical patent/WO1994008237A1/en

Links

Classifications

    • GPHYSICS
    • G01MEASURING; TESTING
    • G01NINVESTIGATING OR ANALYSING MATERIALS BY DETERMINING THEIR CHEMICAL OR PHYSICAL PROPERTIES
    • G01N21/00Investigating or analysing materials by the use of optical means, i.e. using sub-millimetre waves, infrared, visible or ultraviolet light
    • G01N21/17Systems in which incident light is modified in accordance with the properties of the material investigated
    • G01N21/25Colour; Spectral properties, i.e. comparison of effect of material on the light at two or more different wavelengths or wavelength bands
    • G01N21/31Investigating relative effect of material at wavelengths characteristic of specific elements or molecules, e.g. atomic absorption spectrometry
    • GPHYSICS
    • G01MEASURING; TESTING
    • G01NINVESTIGATING OR ANALYSING MATERIALS BY DETERMINING THEIR CHEMICAL OR PHYSICAL PROPERTIES
    • G01N33/00Investigating or analysing materials by specific methods not covered by groups G01N1/00 - G01N31/00
    • G01N33/48Biological material, e.g. blood, urine; Haemocytometers
    • G01N33/50Chemical analysis of biological material, e.g. blood, urine; Testing involving biospecific ligand binding methods; Immunological testing
    • G01N33/72Chemical analysis of biological material, e.g. blood, urine; Testing involving biospecific ligand binding methods; Immunological testing involving blood pigments, e.g. haemoglobin, bilirubin or other porphyrins; involving occult blood
    • GPHYSICS
    • G01MEASURING; TESTING
    • G01NINVESTIGATING OR ANALYSING MATERIALS BY DETERMINING THEIR CHEMICAL OR PHYSICAL PROPERTIES
    • G01N21/00Investigating or analysing materials by the use of optical means, i.e. using sub-millimetre waves, infrared, visible or ultraviolet light
    • G01N21/17Systems in which incident light is modified in accordance with the properties of the material investigated
    • G01N21/25Colour; Spectral properties, i.e. comparison of effect of material on the light at two or more different wavelengths or wavelength bands
    • G01N21/31Investigating relative effect of material at wavelengths characteristic of specific elements or molecules, e.g. atomic absorption spectrometry
    • G01N21/314Investigating relative effect of material at wavelengths characteristic of specific elements or molecules, e.g. atomic absorption spectrometry with comparison of measurements at specific and non-specific wavelengths
    • G01N2021/3148Investigating relative effect of material at wavelengths characteristic of specific elements or molecules, e.g. atomic absorption spectrometry with comparison of measurements at specific and non-specific wavelengths using three or more wavelengths

Definitions

  • This invention relates to a method and apparatus to assess the optical transmittance of a sample of unaltered whole blood at multiple wavelengths to attain an accurate measurement of its total hemoglobin concentration, the concentration of bilirubin, and the concentrations of oxy-, deoxy-, carboxy-, met-, and sulfhemoglobin.
  • characteristics include 1) the complex chemical mixture of as many as five individual hemoglobin species that are present in varying concentrations in a typical blood sample, and 2) the complex optical properties of whole blood that result from a combination of true optical absorbance by multiple light-absorbing compounds
  • Loretz U.S. Patent 4,357,105 teaches a method whereby the hemoglobin is released from the red blood cells by the process of hemolysis, i.e. by disrupting the red blood cell membrane. Simultaneously, the various hemoglobin species are diluted by reagent solutions that convert them into a single chemical form, cyanmethemoglobin, the concentration of which is then measured spectrophotometrically by conventional
  • Figure 1 presents a graph of the extinction
  • Patent 3,972,614 Lundsgaard, U.S. Patent 4,997,769 to eliminate the light scattering by the red blood cells.
  • the hemolyzed sample is then irradiated with at least one distinct wavelength for each of the three, four, or five hemoglobin species presumed to be present in the sample.
  • the major obstacle to making optical measurements is the intense light scattering caused by the highly concentrated red blood cells, e.g. 5.4 X 10 6
  • red blood cells in the sample aggregation and sedimentation of red blood cells in the sample, 3) the different hemoglobin concentrations inside the red blood cells that alter their refractive index, and 4) the size and shape of the red blood cells.
  • the size and shape of the red blood cells differ from one animal species to another; they are also altered by disease states (e.g. sickle-cell anemia and
  • Patent 4,997,769 teaches a method for dealing with the residual turbidity that remains after the hemolysis process, it would be advantageous to eliminate hemolysis completely and make spectrophotometric measurements directly in unaltered whole blood.
  • the Applicants have found that the scattering of light by unaltered (unhemolyzed) whole blood differs in five crucial ways from the turbidity of hemolyzed blood.
  • hemolyzed blood is insignificant in magnitude in
  • red blood cells are not only a function of wavelength, but it also depends on the composition of the hemoglobin contained in the red blood cells, i.e. the light
  • unpredictable light scattering include 1) the different plasma protein concentrations that determine the
  • refractive index of plasma in one sample versus another 2) the aggregation of red blood cells in the sample, 3) the different hemoglobin concentrations inside the red blood cells that alter their refractive index, 4) the size and shape of the red blood cells, 5) chylomicrons or other light-scattering lipid particles, 6) cell
  • Patent 4,134,678; Raffaele, U.S. Patent 4,013,417; and Johansen et al., U.S. Patent 3,972,614 would also fail to yield valid results on unhemolyzed whole blood because these methods also fail to capture the light scattered at large angles by the sample, and because their
  • the present invention eliminates the need to hemolyze the blood sample and the need to chemically convert the various hemoglobin derivatives to a single species.
  • the present invention makes appropriate measurements of the light scattering by red blood cells and of other light losses in unaltered, whole blood and then uses its assessment of these light losses to correct mathematically the measurements of total hemoglobin concentration and the concentrations of the individual hemoglobin species.
  • the present invention avoids the problems caused by hemolysis such as the
  • the present invention includes the following
  • sulfhemoglobin 1.
  • a spectrophotometric apparatus including an optical cuvette in which all optical parameters (for example, sample thickness, detector size and shape, sample-to-detector distance, wavelengths, monochromicity, and maximum angle of light capture by detector) are optimal values so as to minimize the contribution of light scattering to the total optical attenuation of unaltered whole blood and so as to maximize the optical parameters (for example, sample thickness, detector size and shape, sample-to-detector distance, wavelengths, monochromicity, and maximum angle of light capture by detector) are optimal values so as to minimize the contribution of light scattering to the total optical attenuation of unaltered whole blood and so as to maximize the
  • a set of seven measuring wavelengths including the four selected by the aforementioned method; wherein the fifth wavelength is chosen specifically from the range of the visible spectrum in which absorption by bilirubin is especially large (475 to 500 nm); wherein the sixth wavelength is chosen specifically from the range of the visible spectrum in which absorption by sulfhemoglobin is especially large (615 to 625 nm); and wherein the seventh wavelength is chosen from that part of the spectrum where absorbance by bilirubin and each of the five hemoglobin species is as small as possible in comparison with the effects of light scattering, and small compared with the absorption by at least one of the pigments of interest at each of the other six
  • the seventh wavelength the longest
  • wavelength is preferably shorter than 675 nm to avoid errors due to the possible presence of indocyanine green dye in the sample and longer than 660 nm to avoid the relatively large absorbance of methemoglobin.
  • concentration measurements for the effects of finite bandwidth of the substantially monochromatic measuring wavelengths wherein the errors due to finite bandwidth of the substantially monochromatic measuring wavelengths are treated as functions of the concentrations of oxy-, carboxy-, met-, deoxy-, and sulfhemoglobin present in each analyzed sample.
  • Figure 1 is a graph of absorbance spectra for the five primary hemoglobin species.
  • Figure 2 is a graph comparing the light scattering of unaltered whole blood with that of hemolyzed blood.
  • Figure 3 is a graph of the theoretical wavelength dependence of the scattering of light by red blood cells.
  • Figure 4 is a graph of the wavelength dependence of the light scattering by red blood cells in unaltered whole blood in the present invention for varying
  • hemoglobin compositions of whole blood are hemoglobin compositions of whole blood.
  • Figure 5 is a graph of the wavelength dependence of the nonspecific light-scattering losses in unaltered whole blood for varying hemoglobin compositions of whole blood.
  • Figure 6 is a block diagram of the present invention including the optical geometry of the present invention.
  • Figure 7 is a graph of the errors in the
  • Figure 8 is a flow chart of the method in accordance with the present invention to select four principal measuring wavelengths.
  • Figure 9 is a flow chart of a first method of operating the apparatus of Figure 6, in accordance with the present invention, to correct for light scattering.
  • Figure 10 is a flow chart of a second method of operating the apparatus of Figure 6, in accordance with the present invention, to correct for light scattering.
  • Figure 11a-e includes a graphical computer program listing of an embodiment of the method of Figure 8.
  • Specific Scattering Factor Known factor causing light scattering, and thus light losses, in unaltered whole blood, the predominant example of which is light scattering due to red blood cells (RBCs). Other specific scattering factors include lipid particles, cell fragments, microscopic clots, and light-sieving effects of sedimented RBCs.
  • Nonspecific Scattering Factor Unknown factor causing light scattering, and thus light losses in unaltered whole blood 3.
  • Total Light-scattering Losses The sum of light losses due to light scattering by red blood cells, other known causes, and unknown causes. In other words, the sum of light losses due to Specific and Nonspecific
  • Total Hemoglobin Concentration Sum of the amounts of the various hemoglobin species divided by the volume of blood, i.e., the total amount of hemoglobin in a mixture of oxy-, carboxy-, met-, deoxy-, and
  • Error Index The sum of the absolute values of the errors that are induced in the measurement of the relative concentration of the given hemoglobin species (either oxy-, carboxy-, or methemoglobin) due to a 1% (relative) change in each of OD 1 ,...,OD 4 .
  • Unaltered Whole Blood Whole blood that has been neither hemolyzed nor diluted.
  • Figure 6 shows the presently preferred embodiment of the present invention which includes a digital computer 13; a computer-controlled light source 10 capable of sequentially emitting at least seven different
  • the normal measurement cycle comprises 1) recording the dark current from the photodetector when the light source 10 is turned off, 2) recording the incident light intensity at each of the selected wavelengths, 3) placing a sample of
  • all measurements are made at a substantially constant temperature.
  • light source 10 may be a
  • light source 10 may be a bank of light-emitting diodes (LED) arranged so that the emissions of each LED pass through a narrow-band optical interference filter before falling on the sample.
  • light source 10 may be a white light source such as a halogen lamp optically coupled to a computer-controlled monochromator. In the first two embodiments, light source 10 may be pulsed at a frequency of
  • Disposable cuvette 11 has a short optical path chosen to minimize total radiation scattering relative to absorbance by minimizing the number of scattering
  • Cuvette 11 may have an optical pathlength of 80 to 150 ⁇ m. In one embodiment, the optical pathlength is 90 ⁇ 10 ⁇ m.
  • Large-area radiation detector 12 is sensitive to the selected measuring radiation frequencies and may be placed within a distance d of from 0 to 10 mm, from cuvette 11.
  • Detector 12 has a large active area and is placed close to cuvette 11 in order to capture radiation scattered at wide angles by the whole blood sample contained within cuvette 11.
  • the distance d from cuvette 11 to detector 12 is no more than 1.0 mm
  • the active area of detector 12 is at least 150 mm 2 , and preferably at least 600 mm 2
  • the receiving half angle ⁇ of the detector 12, with respect to the point where the incident radiation impinges on the sample is at least 30° and preferably at least 70°.
  • Digital computer 13 may be any type of programmable computer, for example, an Apple Macintosh computer. In order to render the apparatus as portable as possible, digital computer 13 may be a programmed microprocessor, such as one of the family of Motorola 68000
  • configuration of the present invention is to maximize the true optical absorbance of unaltered whole blood and to minimize the effects of light scattering so that the apparent optical density of the sample measured by the detector is due primarily to absorbance with as small a contribution by light scattering as possible.
  • the optical geometry presented above when used alone, does not attain commercially acceptable accuracy, i.e. it does not measure the
  • the optical apparatus of the present invention achieves commercially acceptable accuracy when used in combination with the corrections (described below) that correct the hemoglobin concentration measurements for the effects of light scattering by the red blood cells, for nonspecific light-scattering losses, and for the effects of the finite spectral bandwidth of the plurality of substantially monochromatic wavelengths.
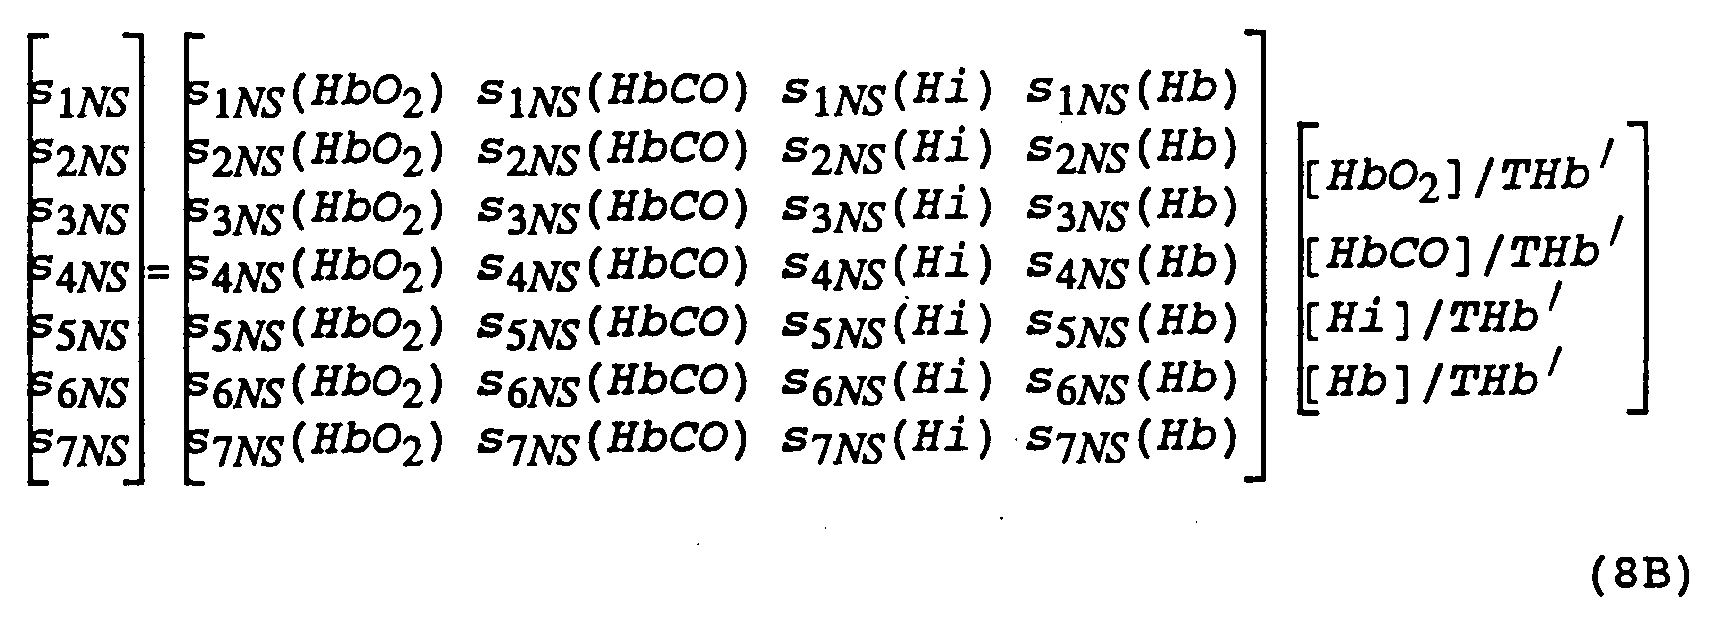
  • wavelengths for HbO 2 , HbCO, Hi, Hb, SHb, and bilirubin Four principal wavelengths among the first six are chosen to measure HbO 2 , HbCO, Hi and Hb and are chosen to minimize the conversion factors by which errors in the optical density measurements (OD 1 ,...,OD 4 ) convert to errors in the measurements of %HbO 2 , %HbCO, and %Hi. The method for selecting these four wavelengths is described as follows.
  • OD 1 ,...,OD 4 are defined as the absorbances of the hypothetical sample at the four wavelengths ⁇ 1 ,..., ⁇ 4 , thus
  • %HbO 2 , %HbCO, %Hi, and %Hb are mathematical functions of OD 1 ,...,OD 4 as shown in the following equations:
  • THb' indicates that SHb is left out of the sum.
  • the derivatives e.g. d(%HbCO)/d(OD 3 ), are taken at the fixed values of OD 1 ,...,OD 4 determined for the fixed hypothetical sample whose hemoglobin is comprised of 85% HbO 2 and 15% Hb.
  • An error criterion for the quadruple of wavelengths ⁇ 1 ,..., ⁇ 4 is then defined as the maximum of these three error indices.
  • the mathematical criterion of the present invention consists in selecting the unique quadruple of wavelengths in the 510-630 nm range which minimizes the error criterion. The wavelengths are searched by 2 nm increments. When the extinction
  • the final four wavelengths selected by this criteria are 518, 562, 580, and 590 nm.
  • the Best Error Criterion is set to 10 10 , and the first quadruple of wavelengths is selected.
  • the first quadruple may be 510, 512, 514, and 516 nm.
  • Control then passes to block 82 where the Error Index for each of HbO 2 , HbCO, and Hi are computed. Then, control passes to block 83 where the Error Criterion is set to the absolute value of the Error Indices calculated in block 82.
  • decision block 84 the Error Criterion calculated in block 83 is compared with the Best Error Criterion. If the Error Criterion is less than the Best Error Criterion, control passes to block 85 where the Best Error Criterion is set equal to the Error Criterion and the best quadruple of wavelengths is set equal to the present quadruple of wavelengths. Control then passes to block 86. If, on the other hand, decision block 84 determines that the Error Criterion is not less than the Best Error Criterion, control passes directly to decision block 86.
  • decision block 86 it is determined whether the present quadruple of wavelengths is equal to the last quadruple of wavelengths, for example, 624, 626, 628 and 630 nm. If so, control passes to block 88 where the Best Error Criterion and best quadruple of wavelengths is reported. If, on the other hand, block 86 determines that the last quadruple has not been processed, control passes to block 87 where the next quadruple of wavelengths is formed, and control returns to block 82 for continued processing. To form the next quadruple, only one of the wavelengths at a time is changed by 2 nm. This procedure results in the analysis of all possible combinations of four wavelengths between 510 and 630 nm. Any set having duplicate wavelengths is discarded.
  • Figures 11a-e hereto includes a source code listing in LabView graphical language which embodies the method of the flow chart of Figure 8.
  • the method of Figure 8 either in the form of the source code of Figures 11a-e, or in an equivalent form, is used to program a computer to perform the wavelength quadruple selecting method of the present invention.
  • a Scattering Factor is any specific or nonspecific cause of light scattering, i.e. any factor, known or unknown, that causes light scattering and hence light losses in unaltered whole blood. Examples are red blood cells, lipid particles, red blood cell aggregation, clotting, sedimentation, etc.
  • n measuring wavelengths are employed to measure k constituent
  • n - k extra equations provide a means by which errors due to n - k scattering factors can be compensated.
  • Each specific scattering factor in the above definition is assumed to contribute in a well-defined way to the apparent
  • OD 1 OD 1abs + OD 1y1 + . . . + OD 1yp
  • OD 2 OD 2abs + OD 2y1 + . . . + OD 2yp
  • OD n OD nabs + OD ny1 + . . . + OD nyp
  • 1, ..., n wavelength indices
  • the scattering vectors s yj vary with the hemoglobin species present in the sample under test.
  • the scattering vectors s yj are different in completely oxygenated blood and blood completely saturated with carbon monoxide. Therefore, in the present invention, the scattering vectors s yj are described as functions of the concentrations of the hemoglobin species present in the sample under test.
  • each scattering vector s yj depends on the hemoglobin species composition of the sample under test, one further distinguishes such scattering vectors as s yj (HbO 2 ), s yj (HbCO), etc.
  • s yj HbO 2
  • s yj HbCO
  • h is the number of hemoglobin species present among the total number k of light-absorbing compounds
  • X 1 , ..., x h denote the h hemoglobin species being measured.
  • scattering factors have been identified: 1) light
  • Embodiments A and B Disclosed are two embodiments of the corrections for light scattering: Embodiments A and B.
  • Embodiment A the following rules hold: only light scattering by the red blood cells is considered (so the nonspecific
  • Embodiment B the following rules hold: both light scattering by red blood cells and nonspecific light scattering are considered, and the concentrations of five compounds are measured, namely HbO 2 , HbCO, Hi, Hb and br.
  • Both embodiments use the same set of seven wavelengths. As explained above, one wavelength (488 nm) is chosen at which absorbance by bilirubin is relatively large, another wavelength (622 nm) is chosen at which absorbance by sulfhemoglobin is relatively large, and another wavelength (672 nm) is used because light
  • the mathematical criterion selected an optimal set of four wavelengths (522,562,584, and 600 nm) for measuring HbO 2 , HbCO, Hi with maximum accuracy. If the light source is either a battery of light-emitting diodes combined with optical interference filters or a white light source with a monochromator, these seven
  • wavelengths can be used in either Embodiment A or B of the light-scattering corrections. However, if the samarium-neon hollow-cathode lamp is used, the most appropriate wavelengths among its emission lines are 488.4, 520.1, 562.4, 585.2, 597.5, 621.7, 671.7 nm.
  • this set of wavelengths can be used in both Embodiments A and B of the light-scattering corrections.
  • values for the extinction coefficients for bilirubin and the hemoglobin species can be determined. Therefore, the following equations obtain in Embodiments A and B of the light-scattering corrections.
  • THB' [HBO 2 ] + [HbCO] + [Hi] + [Hb]
  • THb [HbO 2 ] + [HbCO] + [Hi] + [Hb] + [SHb]
  • THb' [HbO 2 ] + [HbCO] + [Hi] + [Hb].
  • OD 1 , ..., OD 7 are the apparent optical densities of a sample of unaltered whole blood measured at each of the seven wavelengths, 488.4, 520.1, 562.4, 585.2, 597.5, 621.7, 671.7 nm, respectively.
  • the method of finding the correct values for the scattering vectors SRBC and S NS when the relative concentrations (e.g., [HbO2]/THb) are initially unknown proceeds as follows.
  • Default values for the scattering vectors S RBC and S NS are chosen to be the scattering vectors S RBc (HbO 2 ) and S NS (HbO 2 ), i.e. those values that are valid in case the sample is comprised purely of oxyhemoglobin.
  • Embodiment A or m NSscat (Embodiment B) are computed.
  • the initial hemoglobin and bilirubin concentrations are not yet accurate enough to report as final results, but they are sufficiently close to the true values to compute more accurate S RBC and S NS vectors for the given blood sample according to equation 7A or equations 7B and 8B.
  • concentrations to compute more accurate S RBC or both S RBC and S NS vectors and in turn using the most recently computed S RBC or both S RBC and S NS vectors to compute more accurate hemoglobin and bilirubin concentrations provides an iterative scheme whereby the hemoglobin and bilirubin concentrations quickly converge to their final values.
  • the fourth iteration of the computation of these concentrations is sufficiently accurate to report.
  • Table I shows the values for the scattering vectors S RBC (HbO 2 ), S NS (HbO 2 ), S RBC (HbCO), S NS (HbCO), S RBC (Hb), and S NS (Hb), which the Applicants have measured and have found to be valid for both present Embodiments A and B of the light-scattering corrections.
  • Figures 4 and 5 show the same data graphically at each of the measuring wavelengths (488.4, 520.1, 562.4, 585.2, 597.5, 621.7, and 671.7 nm).
  • the present embodiment of the invention does not include measured values for the scattering vectors S RBC (Hi), S NS (Hi) or S RBC (SHb) because these less common hemoglobin species usually occur in low
  • indices 1, ..., 7 refer to the seven wavelengths 488.4, 520.1, 562.4, 585.2, 597.5, 621.7, and 671.7 nm, respectively.
  • the nonspecific scattering factor (NS) discovered by the Applicants provides a refinement of the more coarse correction for scattering by the red blood cells (RBC).
  • RBC red blood cells
  • a method is used to correct the measurements of the concentrations of HbO 2 , HbCO, Hi, Hb, SHb, and br for the effects of the finite bandwidth of the substantially monochromatic measuring wavelengths.
  • This method is not necessary when the measuring wavelengths provided by light source B are sufficiently monochromatic, as is the case when the substantially monochromatic wavelengths are provided by isolated emission lines of a hollow cathode lamp.
  • substantially monochromatic light is used, a range of (wavelength-dependent) extinction coefficients is
  • the extinction coefficients of the hemoglobin species are linear functions of the concentrations of HbO 2 , HbCO, Hi, Hb, SHb, and bilirubin present in the sample under test, and the corrections in concentrations (given below) are linear functions of [HbO 2 ], [HbCO], [Hi], [Hb], [SHb], and Tbr.
  • the order of operation of the invention should be first to measure the optical densities at each of the seven wavelengths, then to apply the corrections for light scattering by the red blood cells and for nonspecific light scattering losses, and finally to make the corrections for the finite spectral bandwidth of the light source.
  • the method for the compensation of errors due the effects of the finite bandwidths of the substantially monochromatic wavelengths emitted by light source B proceeds as follows. After values for the concentrations have been corrected for the effects of light scattering by the red blood cells and for nonspecific light-scattering losses, the corrected concentration values, [HbO2], [HbCO], [Hi], [Hb], [SHb], and Tbr, are then used to compute spectral bandwidth corrections according to the following matrix equations:
  • Control then returns to block 93. If, on the other hand, decision block 95 determines that counter n is greater than four, control passes to decision block 97 where it is determined whether the spectral width is greater than 1 nm. If so, control passes to block 98 where the finite bandwidth correction of equation 9A is performed. Then, in block 99, the latest values for the concentrations of the six constituent components are reported. If, on the other hand, decision block 97 determines that the
  • Appendix A includes a source code listing in the C programming language which embodies the method of the flow chart of Figure 9.
  • the method of the flow chart of Figure 9 embodied in the source code program of Appendix A or an equivalent program is used to program computer 13 of Figure 6, to cause the
  • the counter n is initialized to zero. Then, in block 92, scattering vector s RBC is set equal to s RBC (HbO 2 ) and s NS is set equal to s NS (HbO 2 ). Then, in block 103 equation 6B is used to solve for
  • control then returns to block 103. If, on the other hand, decision block 105 determines that counter n is greater than four, control passes to decision block 107 where it is determined whether the spectral width is greater than 1 nm. If so, control passes to block 108 where the finite bandwidth correction of equation 9B is performed. Then, in block 109, the latest values for the concentrations of the six constituent components are reported. If, on the other hand, decision block 107 determines that the spectral width is not greater than 1 nm, control passes directly to block 109 for report of the concentrations.
  • Appendix B includes a source code listing in the C programming language which embodies the method of the flow chart of Figure 10.
  • the method of the flow chart of Figure 10 embodied either in the source code program of Appendix B or an equivalent program, is used to program computer 13 of Figure 6, to cause the apparatus of Figure 6 to perform the method of Embodiment B to correct for light scattering.
  • Embodiment C which utilizes one more
  • Embodiment C uses the same first seven wavelengths as do Embodiments A and B. In Embodiment C, the following rules hold: both light scattering by red blood cells and nonspecific light scattering are
  • the eighth wavelength is chosen so that the differences e 6HbO2 - e 8HbO2 , e 6HbCO - e 8HbCO , e 6Hi - e 8Hi , e 6Hb - e 8Hb , e 6br - e 8br , e 6RBC - e 8RBC , and e 6NS - e 8NS , are simultaneously small while e 6SHb - e 8SHb is quite large, i.e., in the 635 to 645 nm range.
  • the choice of the eighth wavelength in view of the mathematical relationship between a matrix and its inverse, assures that the computation of sulfhemoglobin concentration is primarily dependent on the 6th and 8th wavelengths and is affected very little by the other six wavelengths.
  • Embodiment C preferably uses 638 nm as its eighth
  • the preferred eighth wavelength among its emission lines is 638.3 nm.
  • OD 1 , ..., OD 8 are the apparent optical densities of a sample of unaltered whole blood measured at each of the eight wavelengths, 488.4, 520.1, 562.4, 585.2, 597.5, 621.7, 671.7, and 638.3 nm, respectively.
  • the Radiometer OSM3 employs an ultrasonic hemolyzer, and is believed to embody the optical geometry of Johansen et al. (U.S. Patent
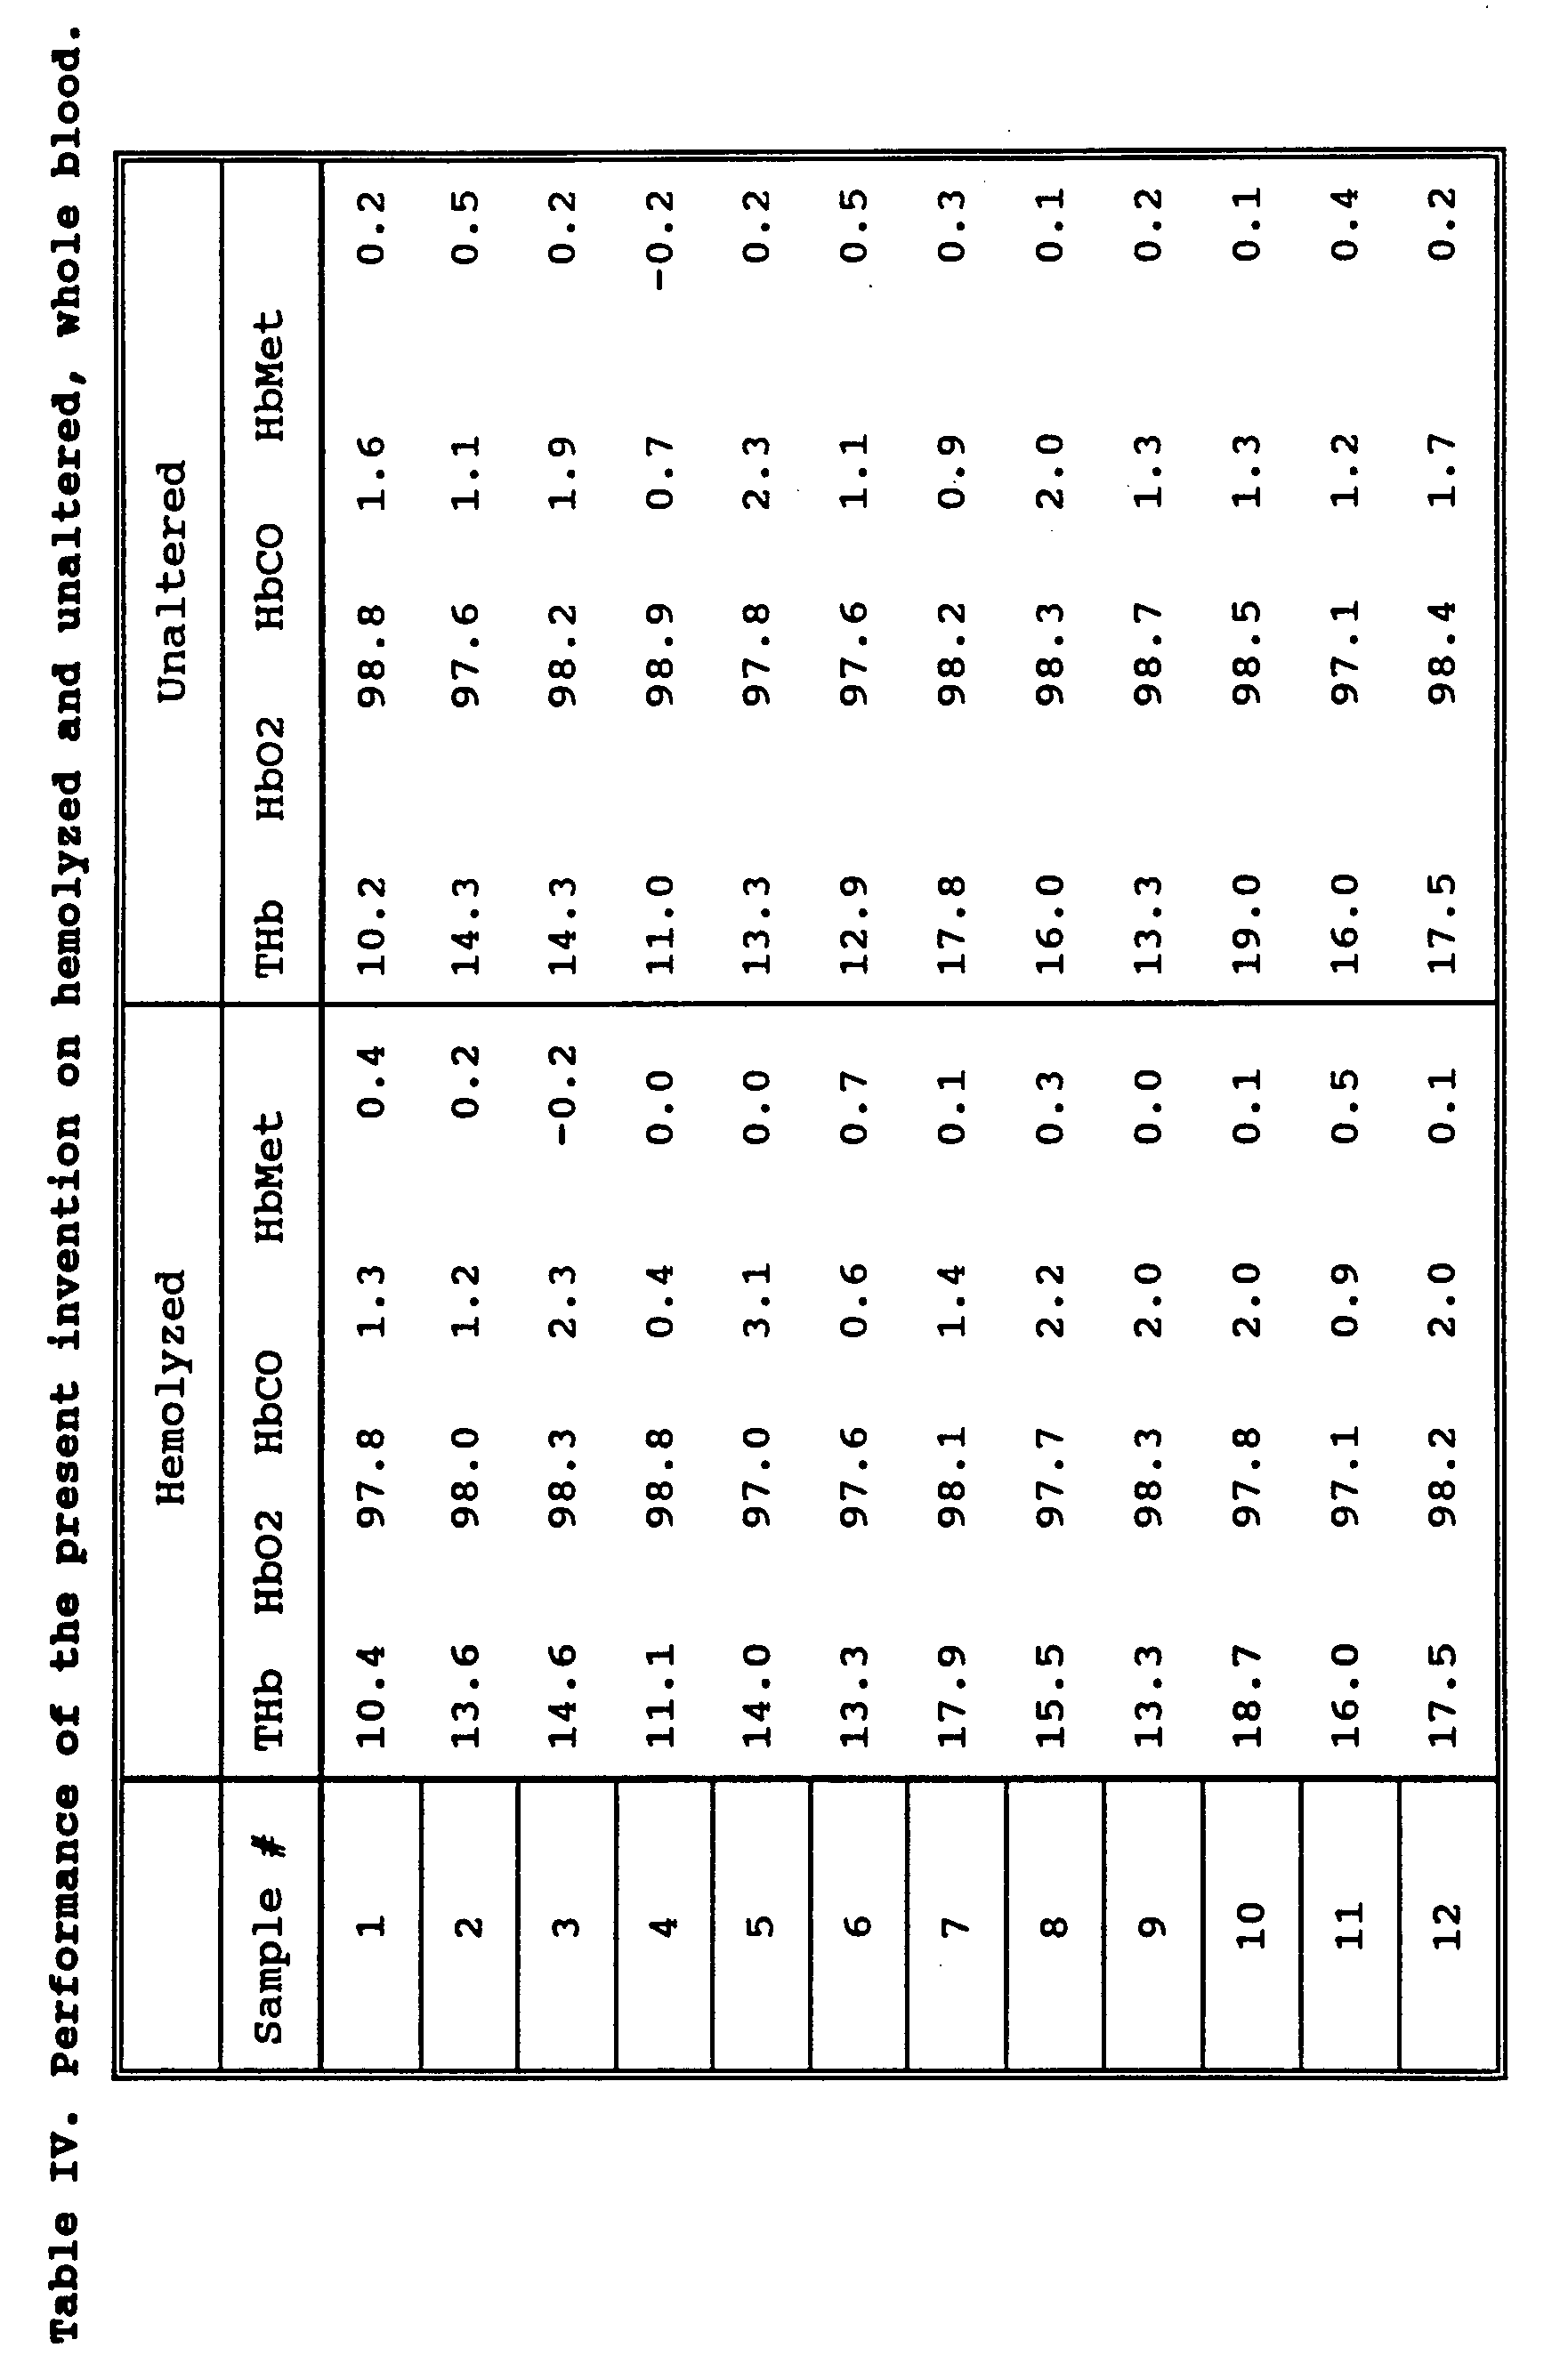
  • the OSM3 In normal operation, the OSM3 first ultrasonically hemolyses each sample, then makes measurements of the sample's optical absorbance at multiple wavelengths, and finally uses the method of Lundsgaard to correct for the residual turbidity of the hemolyzed sample. To determine whether the method and apparatus of Lundsgaard could accurately measure hemoglobin concentrations in unaltered whole blood, the Applicants analyzed blood samples with the OSM3 operating normally and then analyzed the same blood samples with the OSM3's ultrasonic hemolyzer disabled.
  • Table III shows that the Radiometer OSM3, believed to use the method and apparatus of Lundsgaard (U.S.).
  • Patent 4,997,769 gives completely erroneous results when the blood sample is not hemolyzed. For example, measurements of the total hemoglobin concentrations with and without hemolysis differ by as much as 7.4 grams/dl. Similarly, it is physically impossible for the relative concentration of oxyhemoglobin to be 400% or for the concentration of carboxyhemoglobin to be negative (-99%). Thus, it is readily apparent that the method and apparatus of Lundsgaard fail to yield even plausible results on unaltered, whole blood.
  • Table IV shows that the measured total hemoglobin concentrations with and without hemolysis typically differ by only a few tenths of a gram/dl. Similarly, the measurements of the relative concentrations of oxy-, carboxy-, and methemoglobin are consistently in close agreement in all of the samples. In summary, the results shown in Tables III and IV demonstrate conclusively that the present invention enables one skilled in the art to make accurate measurements of the hemoglobin
  • xtmp1 getXvalue((vector *)XODs,0);
  • xtmp2 x_abs(xtmp1)
  • xtmp3 xtmp1 /xtmp2;
  • AtimesX((matrix *)Atmp3,(vector *)Xtmp1,(vector *)Xtmp2); /* may discard Atmp3 now */
  • xsum Xsum(( vector *)Xtmp3)
  • EnTHb enable_thb_slp */
  • EnTHb enable_thb_slp */
  • EnTHb enable_thb_slp */
  • EnTHb enable_thb_slp */
  • xtmp4 XY_inproduct((vector *)Xtmp3,(vector *)Xtmp6);
  • xtmp7 xtmp1 * xtmp4;
  • xtmp9 xtmp7 + xtmp 8;
  • xtmp4 xtmp9 / xsum; /* xtmp4 gets compared to -1.0 */
  • xtmp5 XY_inproduct((vector *)Xtmp3, (vector *)Xtmp7);
  • xtmp6 XY_inproduct((vector *)Xtmp3, (vector *)Xtmp8);
  • xtmp4 xtmp5 * xtmp9
  • xtmp2 xtmp6 * xtmp1;
  • xtmp3 xtmp4 + xtmp2;
  • xtmp4 xsum + xtmp3;
  • xsum Xsum((vector *)Xtmp3)
  • xtmp1 xTHbc * xsum
  • xtmp2 xtmp1 - (l_real) 13.5;
  • xtmp2 getXvalue( (vector *)Xconc,6);
  • xtmp3 getXvalue((vector *)Xtmp1,4)
  • xtmp2 xtmp3 / xsum
  • xtmp3 Xsum((vector *)Xtmp1)
  • xtmp2 xTHbc * xtmp1;
  • AtimesB ((matrix *)Atmp1, (matrix *)ACsats,(matrix *)Atmp2);
  • xtmp1 getXvalue((vector *)XODs,0);
  • xtmp2 x_abs(xtmp1)
  • xtmp3 xtmp1 / xtmp2;
  • AtimesX((matrix *)Atmp3,(vector *)Xtmp1,( vector *)Xtmp2); /* may discard Atmp3 now */
  • xsum Xsum((vector *)Xtmp3)
  • EnTHb enable_thb_slp */
  • EnTHb enable_thb_slp */
  • EnTHb enable_thb_slp */
  • xtmp4 XY_inproduct((vector *)Xtmp3, (vector *)Xtmp6);
  • xtmp7 xtmp1 * xtmp4;
  • xtmp9 xtmp7 + xtmp 8;
  • xtmp4 xtmp9 / xsum; /* xtmp4 gets compared to 1.25 */
  • xtmp5 XY_inproduct((vector *)Xtmp3,(vector *)Xtmp7);
  • xtmp6 XY_inproduct((vector *)Xtmp3, (vector *)Xtmp8);
  • xtmp4 xtmp5 * xtmp9
  • xtmp2 xtmp6 * xtmp1;
  • xtmp3 xtmp4 + xtmp2;
  • xtmp4 xsum + xtmp3;
  • xsum Xsum((vector *)Xtmp3)
  • xtmp1 xTHbc * xsum
  • xtmp2 xtmp1 - (l_real)13.5;
  • xtmp2 getXvalue((vector *)Xconc,6);
  • xtmp3 getXvalue((vector *)Xtmp1,4)
  • xtmp2 xtmp3 / xsum
  • xtmp3 Xsum((vector *)Xtmp1)
  • xtmp2 xTHbc * xtmp1;

Abstract

A method and apparatus which allow accurate spectrophotometric determinations of the concentrations of various hemoglobin species in whole blood without hemolysis or dilution. To overcome complex optical properties of whole blood, the invention employs 1) an optical apparatus (10, 11, 12, 13 and 14), designed to maximize the true optical absorbance of whole blood and to minimize the effects of light scattering on the spectrophotometric measurements of concentrations of various constituent components, and 2) methods to correct the hemoglobin concentration measurements for light scattering and for the effects of the finite bandwidth of the substantially monochromatic light. In the optical apparatus, (10-14), (including an optical cuvette (11)) all optical parameters, such as sample thickness, detector size and shape, sample to detector distance, wavelengths, monochromicity, maximum angle of light capture by detector, are optimal values to minimize the contribution of light scattering to the total optical attenuation of unaltered whole blood and maximize contribution of true optical absorbance.

Description

DESCRIPTION
METHOD AND APPARATUS FOR DIRECT SPECTROPHOTOMETRIC
MEASUREMENTS IN UNALTERED WHOLE BLOOD
A portion of the disclosure of this patent document contains material which is subject to copyright
protection. The copyright owner has no objection to the facsimile reproduction by anyone of the patent document or the patent disclosure, as it appears in the Patent and Trademark Office patent file or records, but otherwise reserves all copyright rights whatsoever.
FIELD OF THE INVENTION This invention relates to a method and apparatus to assess the optical transmittance of a sample of unaltered whole blood at multiple wavelengths to attain an accurate measurement of its total hemoglobin concentration, the concentration of bilirubin, and the concentrations of oxy-, deoxy-, carboxy-, met-, and sulfhemoglobin.
BACKGROUND
To the best of the Applicants' knowledge, no prior art whether patented or not has ever successfully
exploited the optical transmittance of unaltered whole blood to achieve an accurate measurement of the total hemoglobin concentration (THb) in a blood sample that could possibly contain as many as five different species of hemoglobin. Several different properties of whole blood have precluded such measurements. These
characteristics include 1) the complex chemical mixture of as many as five individual hemoglobin species that are present in varying concentrations in a typical blood sample, and 2) the complex optical properties of whole blood that result from a combination of true optical absorbance by multiple light-absorbing compounds
(including the hemoglobins, bilirubin, and other
pigments), and the pronounced light-scattering ability of the red blood cells that are present in high
concentrations.
Many prior methods have been devised to measure the total hemoglobin concentration in the complex chemical mixture of oxy-, carboxy-, met-, deoxy-, and
sulfhemoglobin that comprise the total hemoglobin
composition. For example, Loretz (U.S. Patent 4,357,105) teaches a method whereby the hemoglobin is released from the red blood cells by the process of hemolysis, i.e. by disrupting the red blood cell membrane. Simultaneously, the various hemoglobin species are diluted by reagent solutions that convert them into a single chemical form, cyanmethemoglobin, the concentration of which is then measured spectrophotometrically by conventional
apparatus.
Figure 1 presents a graph of the extinction
coefficients (indicative of optical absorbance) as a function of radiation wavelength for five individual hemoglobin species. Because the individual hemoglobin species differ significantly from each other in their optical absorbance spectra, no method that employs a single wavelength can measure the total hemoglobin concentration spectrophotometrically. Therefore, the chief advantage of the many prior methods that convert the sundry species into a single known species is that only one wavelength is needed for the subsequent
spectrophotometric measurement of the resulting single species. The disadvantages of the above-mentioned chemical conversion methods are that 1) hemolysis and accurate dilutions are needed, 2) the reagents are often toxic, 3) chemical conversion is slow, 4) the red blood cells and the chemical nature of the whole blood sample are so drastically altered that the same sample cannot be used for further subsequent analyses of other blood constituents, and 5) the chemical conversion of the various hemoglobin derivatives into a single species makes it impossible to measure the original
concentrations of the several individual species. The latter disadvantage is a serious limitation because the concentrations of oxy-, carboxy-, met-, deoxy-, and sulfhemoglobin provide valuable diagnostic information in many different medical applications.
In several patented methods (U.S. Patents 4,134,678; 4,013,417; 3,972,614; and 4,997,769), the need for chemical conversion of the various hemoglobin derivatives into a single hemoglobin species has been eliminated by using multiple appropriate wavelengths to measure the concentration of each species. In such methods, the blood sample is either hemolyzed and diluted (Brown et al., U.S. Patent 4,134,678; Raffaele, U.S. Patent
4,013,417) or just hemolyzed (Johansen et al., U.S.
Patent 3,972,614; Lundsgaard, U.S. Patent 4,997,769) to eliminate the light scattering by the red blood cells. The hemolyzed sample is then irradiated with at least one distinct wavelength for each of the three, four, or five hemoglobin species presumed to be present in the sample. By measuring the optical density of the hemolyzed sample with at least as many different wavelengths as there are unknown individual hemoglobin species, such methods yield a set of simultaneous equations that can subsequently be solved for the relative concentration of each of the various hemoglobin derivatives. These prior methods eliminate the need for chemically converting the various hemoglobin derivatives into a single species, but they suffer from the disadvantage of requiring a complex, bulky, and expensive apparatus comprised of pumps, plumbing, associated control circuitry, and in some cases, ultrasonic hemolyzers to dilute and hemolyze the blood sample. Finally, the techniques that employ hemolysis have two additional disadvantages: 1) their complicated plumbing systems are prone to clogging by blood residue, and 2) they aspirate and destroy the blood sample so that it cannot be retrieved and subjected to further analysis of other constituents.
In whole blood, the major obstacle to making optical measurements is the intense light scattering caused by the highly concentrated red blood cells, e.g. 5.4 X 10⁶
RBCs/μl for human males. Consequently, all prior art has relied exclusively on hemolysis or on both hemolysis and dilution to reduce or eliminate the light scattering caused by red blood cells. This light scattering arises because the blood plasma and the red blood cells have different indices of refraction (B. Barer and S. Joseph, Quart. J. Microsc. Sci. 95:399,1954). Many
uncontrollable factors make such light scattering
unpredictable from one blood sample to another, including 1) the different plasma protein concentrations that determine the refractive index of plasma, 2) the
aggregation and sedimentation of red blood cells in the sample, 3) the different hemoglobin concentrations inside the red blood cells that alter their refractive index, and 4) the size and shape of the red blood cells. The size and shape of the red blood cells differ from one animal species to another; they are also altered by disease states (e.g. sickle-cell anemia and
spherocytosis); and they are altered by the osmotic pressure of the blood. Thus all prior methods which measure the total hemoglobin concentration and the relative concentrations of individual hemoglobin species have employed hemolysis to eliminate this intense, unpredictable light scattering caused by the red blood cells. Prior art that relies on hemolysis to eliminate the intense light scattering by the red blood cells has the further disadvantage that even after thorough hemolysis the sample can be relatively turbid (L.R. Sehgal et al., Critical Care Medicine, 12:907-909, 1984). This residual turbidity in hemolyzed blood is small compared with the intense light scattering of red blood cells in unaltered whole blood (J.M. Steinke and A.P. Shepherd, IEEE Trans. Biomed. Eng. BME-33:294-301, 1986). Nevertheless, the residual turbidity in hemolyzed blood causes troublesome errors in the hemoglobin measurements. Thus, an
additional disadvantage of prior apparatus that rely on hemolysis is the residual turbidity that results from a small number of unlysed red blood cells, lipid particles such as chylomicrons (a normal constituent of plasma that persists after hemolysis), light- scattering cell
fragments produced by the hemolysis process, and other causes that are unknown. Although Lundsgaard (U.S.
Patent 4,997,769) teaches a method for dealing with the residual turbidity that remains after the hemolysis process, it would be advantageous to eliminate hemolysis completely and make spectrophotometric measurements directly in unaltered whole blood. The Applicants have found that the scattering of light by unaltered (unhemolyzed) whole blood differs in five crucial ways from the turbidity of hemolyzed blood. First, as mentioned previously, the turbidity of
hemolyzed blood is insignificant in magnitude in
comparison with the light scattering of unhemolyzed whole blood. This conclusion is reinforced by Figure 2 which shows a measure of light scattering in whole blood before and after hemolysis. For these data, the light
scattering in unaltered, whole blood is approximately 20 times greater than after hemolysis. In fact, light scattering by red blood cells in unaltered whole blood is so intense that scattered light predominates over unscattered light after it has passed through as few as 10 layers of red blood cells (C.C. Johnson. J. Assoc.
Adv. Med. Instrument. 4:22-27,1970). Prior art was not designed to accommodate the greater magnitude of the scattering effects of unaltered whole blood.
Second, a fundamental observation is that red blood cells scatter light at relatively large angles (J.M.
Steinke and A.P. Shepherd, Applied Optics 27:4027-4033,1988). The Applicants have discovered that, even though most of the light is scattered at small angles, the magnitude of large-angle light scattering is
sufficient to cause serious errors in spectrophotometric measurements on whole blood. Prior art does not address the problem of designing practical instruments by
capturing the large-angle light scattering of unhemolyzed blood.
Third, the light scattering by red blood cells varies with wavelength in a complicated manner due to physical factors such as the relative size of red blood cells with respect to the wavelength, and the shape of the red blood cells. Figure 3 shows the wavelength dependence of light scattering by RBCs as predicted by optical theory (R.N. Pittman and B.R. Duling, J. Appl.
Physiol. 38:315-320,1975; R.N. Pittman, Ann. Biomed. Eng. 14:119-137,1986). Prior art does not address the complex wavelength dependence of the scattering effects of unaltered whole blood.
Fourth, as Figure 4 shows, the light scattering by red blood cells is not only a function of wavelength, but it also depends on the composition of the hemoglobin contained in the red blood cells, i.e. the light
scattering depends on the relative concentrations of oxy-, deoxy-, carboxy-, met-, and sulfhemoglobin in the red blood cells. Prior art does not address the complex dependence of light scattering on the concentrations of the individual hemoglobin species in unaltered whole blood. Fifth, many poorly understood, uncontrolled
processes occur in unaltered, whole blood that change its optical properties. Such miscellaneous causes of
unpredictable light scattering include 1) the different plasma protein concentrations that determine the
refractive index of plasma in one sample versus another, 2) the aggregation of red blood cells in the sample, 3) the different hemoglobin concentrations inside the red blood cells that alter their refractive index, 4) the size and shape of the red blood cells, 5) chylomicrons or other light-scattering lipid particles, 6) cell
fragments, 7) microscopic clots, and 8) light-sieving effects of sedimented RBCs.
As shown in the comparative example below, the apparatus of Lundsgaard, U.S. patent 4,997,769, fails to yield valid results when measuring a sample of unaltered (unhemolyzed) whole blood. Similarly, other prior art that relies on hemolysis such as Brown et al., U.S.
Patent 4,134,678; Raffaele, U.S. Patent 4,013,417; and Johansen et al., U.S. Patent 3,972,614 would also fail to yield valid results on unhemolyzed whole blood because these methods also fail to capture the light scattered at large angles by the sample, and because their
measurements do not take into account the magnitude, the wavelength dependence, or the hemoglobin-composition-dependence of the light-scattering effects of unaltered whole blood.
SUMMARY OF THE INVENTION
By making spectrophotometric measurements directly on unaltered whole blood and by correcting for the effects of light scattering on the measurements, the present invention eliminates the need to hemolyze the blood sample and the need to chemically convert the various hemoglobin derivatives to a single species.
Thus, the present invention overcomes the previously mentioned disadvantages of prior art that employs
hemolysis only, hemolysis and dilution, or chemical conversion. By contrast, the present invention makes appropriate measurements of the light scattering by red blood cells and of other light losses in unaltered, whole blood and then uses its assessment of these light losses to correct mathematically the measurements of total hemoglobin concentration and the concentrations of the individual hemoglobin species. By eliminating the need for a hemolyzing apparatus, the present invention avoids the problems caused by hemolysis such as the
fragmentation of red and white blood cells into light-scattering particles. Furthermore, the need for pumps, plumbing, and associated control circuitry is eliminated by use of an inexpensive disposable cuvette. Therefore, the problem of clogging of the apparatus is eliminated, and the nondestructive optical test performed by the present invention preserves the blood sample (with its red blood cells intact) for further subsequent analysis.
The present invention includes the following
component parts that, employed together and in
combination, assess the optical transmittance of a sample of unaltered whole blood to attain an accurate
measurement of its total hemoglobin concentration, and the concentrations of the following pigments of interest: bilirubin, oxy-, deoxy-, carboxy-, met-, and
sulfhemoglobin: 1. A spectrophotometric apparatus (including an optical cuvette) in which all optical parameters (for example, sample thickness, detector size and shape, sample-to-detector distance, wavelengths, monochromicity, and maximum angle of light capture by detector) are optimal values so as to minimize the contribution of light scattering to the total optical attenuation of unaltered whole blood and so as to maximize the
contribution of true optical absorbance.
2. A method for selecting an optimal set of four wavelengths for making the measurements of the
concentrations of oxy-, carboxy-, and methemoglobin with the least spectrophotometric error.
3. A set of seven measuring wavelengths, including the four selected by the aforementioned method; wherein the fifth wavelength is chosen specifically from the range of the visible spectrum in which absorption by bilirubin is especially large (475 to 500 nm); wherein the sixth wavelength is chosen specifically from the range of the visible spectrum in which absorption by sulfhemoglobin is especially large (615 to 625 nm); and wherein the seventh wavelength is chosen from that part of the spectrum where absorbance by bilirubin and each of the five hemoglobin species is as small as possible in comparison with the effects of light scattering, and small compared with the absorption by at least one of the pigments of interest at each of the other six
wavelengths. The seventh wavelength, the longest
wavelength, is preferably shorter than 675 nm to avoid errors due to the possible presence of indocyanine green dye in the sample and longer than 660 nm to avoid the relatively large absorbance of methemoglobin.
4. A second method to correct the aforesaid hemoglobin and bilirubin concentration measurements for the effects of light scattering by red blood cells, by other specific factors, and by nonspecific factors in unaltered whole blood, wherein the errors due to the various light-scattering losses are treated as functions of the wavelength of the measuring radiation and as mathematical functions of the concentrations of oxy-, carboxy-, met-, deoxy-, and sulfhemoglobin present in each analyzed sample.
5. A third method to correct the aforesaid
concentration measurements for the effects of finite bandwidth of the substantially monochromatic measuring wavelengths, wherein the errors due to finite bandwidth of the substantially monochromatic measuring wavelengths are treated as functions of the concentrations of oxy-, carboxy-, met-, deoxy-, and sulfhemoglobin present in each analyzed sample.
BRIEF DESCRIPTION OF THE DRAWINGS
Figure 1 is a graph of absorbance spectra for the five primary hemoglobin species.
Figure 2 is a graph comparing the light scattering of unaltered whole blood with that of hemolyzed blood.
Figure 3 is a graph of the theoretical wavelength dependence of the scattering of light by red blood cells.
Figure 4 is a graph of the wavelength dependence of the light scattering by red blood cells in unaltered whole blood in the present invention for varying
hemoglobin compositions of whole blood.
Figure 5 is a graph of the wavelength dependence of the nonspecific light-scattering losses in unaltered whole blood for varying hemoglobin compositions of whole blood. Figure 6 is a block diagram of the present invention including the optical geometry of the present invention.
Figure 7 is a graph of the errors in the
measurements of relative oxyhemoglobin concentration with and without the corrections for nonspecific light
scattering.
Figure 8 is a flow chart of the method in accordance with the present invention to select four principal measuring wavelengths.
Figure 9 is a flow chart of a first method of operating the apparatus of Figure 6, in accordance with the present invention, to correct for light scattering.
Figure 10 is a flow chart of a second method of operating the apparatus of Figure 6, in accordance with the present invention, to correct for light scattering.
Figure 11a-e includes a graphical computer program listing of an embodiment of the method of Figure 8.
DETAILED DESCRIPTION
1. Glossary of Terms
1. Specific Scattering Factor: Known factor causing light scattering, and thus light losses, in unaltered whole blood, the predominant example of which is light scattering due to red blood cells (RBCs). Other specific scattering factors include lipid particles, cell fragments, microscopic clots, and light-sieving effects of sedimented RBCs. 2. Nonspecific Scattering Factor: Unknown factor causing light scattering, and thus light losses in unaltered whole blood 3. Total Light-scattering Losses: The sum of light losses due to light scattering by red blood cells, other known causes, and unknown causes. In other words, the sum of light losses due to Specific and Nonspecific
Scattering Factors.
4. a. HbO2 = oxyhemoglobin
b. HbCO = carboxyhemoglobin
c. Hi = methemoglobin or hemiglobin d. Hb = reduced hemoglobin
e. SHb = sulfhemoglobin
f. br = bilirubin
g. Tbr = [br] = total bilirubin concentration
5. Total Hemoglobin Concentration (THb): Sum of the amounts of the various hemoglobin species divided by the volume of blood, i.e., the total amount of hemoglobin in a mixture of oxy-, carboxy-, met-, deoxy-, and
sulfhemoglobin divided by the volume of blood. THb =
[HbO2] + [HbCO] + [Hi] + [Hb] + [SHb]; THb' = [HbO2] + [HbCO] + [Hi] + [Hb]
6. Hemoglobin Fraction: Amount of a given species (such as oxyhemoglobin) divided by the sum of the amounts of oxy-, carboxy-, met-, deoxy-, and sulfhemoglobin, e.g., fraction of HbO2 = 0.75
7. Saturation or Relative Concentration:
Hemoglobin fraction expressed as a percentage, e.g., HbO2 saturation = 75%
8. Apparent Optical Density (OD) or Apparent
Absorbance (A): Logarithm of the total attenuation in light intensity, i.e., OD = A = log10 (I0/I), where I0 is the incident intensity and I is the intensity transmitted through the sample. Note that this is not a re-definition of Beer's Law because the apparent optical density in unaltered whole blood could be due to a combination of true Beer's Law absorbance and light losses due to scattering.
9. Error Index: The sum of the absolute values of the errors that are induced in the measurement of the relative concentration of the given hemoglobin species (either oxy-, carboxy-, or methemoglobin) due to a 1% (relative) change in each of OD1,...,OD4. 10. Unaltered Whole Blood: Whole blood that has been neither hemolyzed nor diluted.
2. Optical Geometry, Other Apparatus, and Mode of
Operation
Figure 6 shows the presently preferred embodiment of the present invention which includes a digital computer 13; a computer-controlled light source 10 capable of sequentially emitting at least seven different
substantially monochromatic wavelengths; an ultra-thin disposable optical cuvette 11; a large-area light
detector 12; and electronic circuitry 14 to amplify the detected signal. In operation, a sample of unaltered (undiluted and unhemolyzed) whole blood is placed in cuvette 11 and irradiated with selected wavelengths of radiation chosen in accordance with the criteria and other principles outlined below. Thus, the normal measurement cycle comprises 1) recording the dark current from the photodetector when the light source 10 is turned off, 2) recording the incident light intensity at each of the selected wavelengths, 3) placing a sample of
unaltered (undiluted and unhemolyzed) whole blood in the cuvette 11 and inserting it into the light path, 4) recording the light intensity transmitted through the sample at each of the selected wavelengths, 5) computing the apparent optical densities at each of the selected wavelengths, 6) correcting the concentration measurements for the effects of light scattering by the red blood cells and for nonspecific light-scattering losses, 7) correcting for the effects of the finite spectral
bandwidth of the plurality of substantially monochromatic wavelengths, and 8) reporting the final results to the operator. In one embodiment, all measurements are made at a substantially constant temperature.
Following such a measurement cycle, the operator can remove the disposable cuvette from the instrument and discard the sample, or he can withdraw the blood sample from the cuvette and subject the unaltered blood sample to further hematological analyses. In one embodiment, light source 10 may be a
samarium-neon hollow cathode lamp. In another
embodiment, light source 10 may be a bank of light-emitting diodes (LED) arranged so that the emissions of each LED pass through a narrow-band optical interference filter before falling on the sample. In yet another embodiment, light source 10 may be a white light source such as a halogen lamp optically coupled to a computer-controlled monochromator. In the first two embodiments, light source 10 may be pulsed at a frequency of
approximately 20 Hz in order to achieve a high signal-to-noise ratio by using synchronous detection.
Disposable cuvette 11 has a short optical path chosen to minimize total radiation scattering relative to absorbance by minimizing the number of scattering
interactions that a photon is likely to undergo with RBCs. Cuvette 11 may have an optical pathlength of 80 to 150 μm. In one embodiment, the optical pathlength is 90±10 μm.
Large-area radiation detector 12 is sensitive to the selected measuring radiation frequencies and may be placed within a distance d of from 0 to 10 mm, from cuvette 11. Detector 12 has a large active area and is placed close to cuvette 11 in order to capture radiation scattered at wide angles by the whole blood sample contained within cuvette 11. In one embodiment, the distance d from cuvette 11 to detector 12 is no more than 1.0 mm, the active area of detector 12 is at least 150 mm2, and preferably at least 600 mm2, and the receiving half angle α of the detector 12, with respect to the point where the incident radiation impinges on the sample, is at least 30° and preferably at least 70°.
This optical design minimizes light losses caused by light scattered at large angles. Detector 12 may be a United Detector Technology detector, PIN-25DP (active area = 613 mm2), or may be an SD-1100-11-21-181 detector from Silicon Detector Corporation.
Digital computer 13 may be any type of programmable computer, for example, an Apple Macintosh computer. In order to render the apparatus as portable as possible, digital computer 13 may be a programmed microprocessor, such as one of the family of Motorola 68000
microprocessors. Thus, the overall strategy of the optical
configuration of the present invention is to maximize the true optical absorbance of unaltered whole blood and to minimize the effects of light scattering so that the apparent optical density of the sample measured by the detector is due primarily to absorbance with as small a contribution by light scattering as possible. However, it should be noted that the optical geometry presented above, when used alone, does not attain commercially acceptable accuracy, i.e. it does not measure the
relative hemoglobin concentrations to an accuracy of 1% or less. The optical apparatus of the present invention achieves commercially acceptable accuracy when used in combination with the corrections (described below) that correct the hemoglobin concentration measurements for the effects of light scattering by the red blood cells, for nonspecific light-scattering losses, and for the effects of the finite spectral bandwidth of the plurality of substantially monochromatic wavelengths.
3. Choice of Principal Four Wavelengths In the one embodiment of the present invention, six of the seven measuring wavelengths are chosen as
measuring wavelengths for HbO2, HbCO, Hi, Hb, SHb, and bilirubin. Four principal wavelengths among the first six are chosen to measure HbO2, HbCO, Hi and Hb and are chosen to minimize the conversion factors by which errors in the optical density measurements (OD1,...,OD4) convert to errors in the measurements of %HbO2, %HbCO, and %Hi. The method for selecting these four wavelengths is described as follows.
A fixed hypothetical sample of hemolyzed blood whose hemoglobin composition is 85% HbO2 and 15% Hb, whose total hemoglobin concentration is 16.11 g/dl (10 mmol/L), is considered in a hypothetical cuvette whose pathlength is 100 μm. OD1,...,OD4 are defined as the absorbances of the hypothetical sample at the four wavelengths λ1,...,λ4, thus
OD1 = (0.85 × e1HbO2 + 0.15 × e1Hb)/10
OD2 = (0.85 × e2HbO2 + 0.15 × e2Hb)/10 (1) OD3 = (0.85 × e3HbO2 + 0.15 × e3Hb)/10
OD4 = (0.85 × e4HbO2 + 0.15 × e4Hb)/10 where the extinction coefficients shown are the
millimolar extinction coefficients for the two hemoglobin species at the wavelengths λ1,...,λ4. Note that once λ1,...,λ4 are fixed, %HbO2, %HbCO, %Hi, and %Hb are mathematical functions of OD1,...,OD4 as shown in the following equations:
Figure imgf000019_0001
Figure imgf000019_0002
THb' = [HbO2] + [HbCO] + [Hi] + [Hb];
%HbO2 = 100 × [HbO2] / THb'; %HbCO = 100 × [HbCO] / THb'; %Hi = 100 × [Hi] / THb'; %Hb = 100 × [Hb] / THb';
Here THb' indicates that SHb is left out of the sum. To account for the effects of light scattering when
absorbance is small, Applicants devised the following technique:
Define OD1' = (max {(0.85 × e1HbO2 + 0.15 × e1Hb), 5})/10
OD2' = (max {(0.85 × e2HbO2 + 0.15 × e2Hb), 5})/10
OD3' = (max {(0.85 × e3HbO2 + 0.15 × e3Hb), 5})/10
OD4' = (max {(0.85 × e4HbO2 + 0.15 × e4Hb), 5})/10
(The extinction coefficients are the millimolar
absorptivities.) Thus, whenever the millimolar
absorptivity falls below 5, then, for the computation of ODi', it is set equal to 5. Then for each of the three species (oxy-, carboxy-, and methemoglobin), an error index is computed as the sum of the absolute values of the errors that are induced in the measurement of the relative concentration of the given hemoglobin species (either oxy-, carboxy-, or methemoglobin) due to a 1% (relative) change in each of OD1',...,OD4'.
Thus: Error Index for oxyhemoglobin = 0.01
OD1'|d(%HbO2)/d(OD1)|+ 0.01 OD2'|d(%HbO2)/d(OD2)|+ 0.01 OD3'|d(%HbO2)/d(OD3)|+0.01 OD4'|d(%HbO2)/d(OD4)|.
Error Index for carboxyhemoglobin = 0.01
OD1'|d(%HbCO)/d(OD1)|+ 0.01 OD2'|d(%HbCO)/d(OD2)|+ 0.01 OD3'|d(%HbCO)/d(OD3)|+0.01 OD4'|d(%HbC0)/d(OD4)|.
Error Index for methemoglobin = 0.01
OD1'|d(%Hi)/d(OD1)|+ 0.01 OD2'|d(%Hi)/d(OD2)|+ 0.01
OD3'|d(%Hi)/d(OD3)|+0.01 OD4'|d(%Hi)/d(OD4)|.
The derivatives, e.g. d(%HbCO)/d(OD3), are taken at the fixed values of OD1,...,OD4 determined for the fixed hypothetical sample whose hemoglobin is comprised of 85% HbO2 and 15% Hb. An error criterion for the quadruple of wavelengths λ1,...,λ4 is then defined as the maximum of these three error indices. The mathematical criterion of the present invention consists in selecting the unique quadruple of wavelengths in the 510-630 nm range which minimizes the error criterion. The wavelengths are searched by 2 nm increments. When the extinction
coefficient values determined by the inventors are used, the final four wavelengths selected by this criteria are 522, 562, 584 and 600 nm. When the extinction
coefficient values of Zwart et al. are used (A. Zwart,
E.J. van Kampen and W.G. Zijlstra, Clinical Chemistry 32: 972-978, 1986), the final four wavelengths selected by this criteria are 518, 562, 580, and 590 nm.
Referring now to Figure 8, presented is a flow chart of the method of the present invention to select the unique quadruple of wavelengths, in accordance with the present invention.
Beginning in block 81, the Best Error Criterion is set to 1010, and the first quadruple of wavelengths is selected. For example, the first quadruple may be 510, 512, 514, and 516 nm. Control then passes to block 82 where the Error Index for each of HbO2, HbCO, and Hi are computed. Then, control passes to block 83 where the Error Criterion is set to the absolute value of the Error Indices calculated in block 82.
Then, in decision block 84, the Error Criterion calculated in block 83 is compared with the Best Error Criterion. If the Error Criterion is less than the Best Error Criterion, control passes to block 85 where the Best Error Criterion is set equal to the Error Criterion and the best quadruple of wavelengths is set equal to the present quadruple of wavelengths. Control then passes to block 86. If, on the other hand, decision block 84 determines that the Error Criterion is not less than the Best Error Criterion, control passes directly to decision block 86. In decision block 86, it is determined whether the present quadruple of wavelengths is equal to the last quadruple of wavelengths, for example, 624, 626, 628 and 630 nm. If so, control passes to block 88 where the Best Error Criterion and best quadruple of wavelengths is reported. If, on the other hand, block 86 determines that the last quadruple has not been processed, control passes to block 87 where the next quadruple of wavelengths is formed, and control returns to block 82 for continued processing. To form the next quadruple, only one of the wavelengths at a time is changed by 2 nm. This procedure results in the analysis of all possible combinations of four wavelengths between 510 and 630 nm. Any set having duplicate wavelengths is discarded.
Figures 11a-e hereto includes a source code listing in LabView graphical language which embodies the method of the flow chart of Figure 8. In practice, the method of Figure 8, either in the form of the source code of Figures 11a-e, or in an equivalent form, is used to program a computer to perform the wavelength quadruple selecting method of the present invention.
4. Corrections for Light Scattering by RBCs and for
Nonspecific Light Scattering
As defined in the Glossary, a Scattering Factor is any specific or nonspecific cause of light scattering, i.e. any factor, known or unknown, that causes light scattering and hence light losses in unaltered whole blood. Examples are red blood cells, lipid particles, red blood cell aggregation, clotting, sedimentation, etc.
According to the present invention, n measuring wavelengths are employed to measure k constituent
components, with n > k, thereby creating an
overdetermined system of equations with respect to the chemical compounds being measured. The n - k extra equations provide a means by which errors due to n - k scattering factors can be compensated. Each specific scattering factor in the above definition is assumed to contribute in a well-defined way to the apparent
absorbance spectrum of unaltered whole blood placed within cuvette C. For a given scattering factor y, the contribution to the apparent optical density of unaltered whole blood at wavelength i is denoted ODiy.
From these considerations, the following equations result:
OD1 = OD1abs + OD1y1 + . . . + OD1yp
OD2 = OD2abs + OD2y1 + . . . + OD2yp
.
.
.
ODn = ODnabs + ODny1 + . . . + ODnyp where 1, ..., n are wavelength indices and 1, ..., p are scattering factor indices. Since there are k constituent light-absorbing, chemical compounds to be determined, it follows that n = p + k. ODiabs is the part of the total optical density due to true optical absorption by the k light-absorbing compounds, i.e., ODiabs/d = eix1 cx1 + eix2 cx2 + . . . + eixk cxk where X1, ..., xk denote the k chemical identities of the light-absorbing compounds to be measured and cx1, ..., cxk are their concentrations.
In the context of the present invention, the
attenuation of light due to the presence of the
scattering factor y is assumed to obey the relationship ODiy = siy my d where sy = {s1y, s2y, ..., sny} is the scattering vector associated with the scattering factor y, and my is the magnitude of scattering caused by the scattering factor y. Thus it is possible to write the following matrix equation:
Figure imgf000024_0001
The Applicants have discovered that the scattering vectors syj (where j denotes the scattering factor index) vary with the hemoglobin species present in the sample under test. For example, the scattering vectors syj are different in completely oxygenated blood and blood completely saturated with carbon monoxide. Therefore, in the present invention, the scattering vectors syj are described as functions of the concentrations of the hemoglobin species present in the sample under test.
Since each scattering vector syj depends on the hemoglobin species composition of the sample under test, one further distinguishes such scattering vectors as syj(HbO2), syj(HbCO), etc. For an arbitrary sample of unaltered whole blood, the appropriate vector syj is computed as
Figure imgf000025_0001
Here h is the number of hemoglobin species present among the total number k of light-absorbing compounds, and X1, ..., xh denote the h hemoglobin species being measured. According to the present invention, the following scattering factors have been identified: 1) light
scattering by red blood cells, a specific scattering factor denoted by the subscript RBC, and 2) a nonspecific scattering factor, denoted by the subscript NS. The nonspecific scattering factor, discovered unexpectedly by the Applicants, significantly increases the utility of the present invention. Data showing the utility of the nonspecific scattering factor over and above the
corrections for light scattering by red blood cells are given in Figure 7 and Table II following the present disclosure of the general method to correct for light scattering.
Disclosed are two embodiments of the corrections for light scattering: Embodiments A and B. In Embodiment A, the following rules hold: only light scattering by the red blood cells is considered (so the nonspecific
scattering correction is ignored), and the concentrations of six compounds are measured, namely HbO2, HbCO, Hi, Hb, SHb, and br. In Embodiment B, the following rules hold: both light scattering by red blood cells and nonspecific light scattering are considered, and the concentrations of five compounds are measured, namely HbO2, HbCO, Hi, Hb and br. Both embodiments use the same set of seven wavelengths. As explained above, one wavelength (488 nm) is chosen at which absorbance by bilirubin is relatively large, another wavelength (622 nm) is chosen at which absorbance by sulfhemoglobin is relatively large, and another wavelength (672 nm) is used because light
scattering by red blood cells is great in comparison with absorbance by bilirubin and the hemoglobin species. In addition, the mathematical criterion selected an optimal set of four wavelengths (522,562,584, and 600 nm) for measuring HbO2, HbCO, Hi with maximum accuracy. If the light source is either a battery of light-emitting diodes combined with optical interference filters or a white light source with a monochromator, these seven
wavelengths can be used in either Embodiment A or B of the light-scattering corrections. However, if the samarium-neon hollow-cathode lamp is used, the most appropriate wavelengths among its emission lines are 488.4, 520.1, 562.4, 585.2, 597.5, 621.7, 671.7 nm.
Therefore, this set of wavelengths can be used in both Embodiments A and B of the light-scattering corrections. Once the seven wavelengths have been chosen, values for the extinction coefficients for bilirubin and the hemoglobin species can be determined. Therefore, the following equations obtain in Embodiments A and B of the light-scattering corrections.
Embodiment A:
ODiabs/d = eiHbO2 [HbO2] + eiHbCO [HbCO] eiHi [Hi] + eiHb [Hb] + eiSHb [SHb] + eibr [br]
Figure imgf000028_0001
THb = [HbO2] + [HbCO] + [Hi] + [Hb] + [SHb]
Figure imgf000029_0001
Embodiment B:
ODiabs/d = eiHbO2 [HbO2] + eiHbCO [HbCO] eiHi [Hi] + eiHb [Hb] + eibr [br ]
Figure imgf000030_0001
THb' = [HbO2] + [HbCO] + [Hi] + [Hb]
THB' = [HBO2] + [HbCO] + [Hi] + [Hb]
Figure imgf000031_0001
Figure imgf000032_0001
wherein [HbO2] , [HbCO], [Hi], [Hb], and [SHb] are the concentrations of the indicated hemoglobin species in the sample, mRBCscat and mΝSscat are magnitudes of light
scattering by the red blood cells and by the nonspecific factor, THb = [HbO2] + [HbCO] + [Hi] + [Hb] + [SHb], and THb' = [HbO2] + [HbCO] + [Hi] + [Hb]. OD1, ..., OD7 are the apparent optical densities of a sample of unaltered whole blood measured at each of the seven wavelengths, 488.4, 520.1, 562.4, 585.2, 597.5, 621.7, 671.7 nm, respectively. The method of finding the correct values for the scattering vectors SRBC and SNS when the relative concentrations (e.g., [HbO2]/THb) are initially unknown proceeds as follows. Default values for the scattering vectors SRBC and SNS are chosen to be the scattering vectors SRBc(HbO2) and SNS(HbO2), i.e. those values that are valid in case the sample is comprised purely of oxyhemoglobin.
With the vectors SRBC(HbO2) and SNS(HbO2) placed into the matrix equation 6A or 6B above, initial values for [HbO2], [HbCO], [Hi], [Hb], [br], mRBCscat, and [SHb]
(Embodiment A) or mNSscat (Embodiment B) are computed. The initial hemoglobin and bilirubin concentrations are not yet accurate enough to report as final results, but they are sufficiently close to the true values to compute more accurate SRBC and SNS vectors for the given blood sample according to equation 7A or equations 7B and 8B. With the newly computed SRBC vector (Embodiment A), or the both the new SRBC and SNS vectors (Embodiment B) placed into the matrix equation 6A or 6B above, the quantities [HbO2], [HbCO], [Hi], [Hb], [br], mRBCscat, and [SHb] or mNSscat are recomputed. These quantities are more accurate than their initial values because the SRBC or both SRBC and SNS vectors used in obtaining them are more accurate than those used in the initial estimates. This procedure of using the most recently computed hemoglobin
concentrations to compute more accurate SRBC or both SRBC and SNS vectors and in turn using the most recently computed SRBC or both SRBC and SNS vectors to compute more accurate hemoglobin and bilirubin concentrations provides an iterative scheme whereby the hemoglobin and bilirubin concentrations quickly converge to their final values. In both embodiments A and B, the fourth iteration of the computation of these concentrations is sufficiently accurate to report.
Table I shows the values for the scattering vectors SRBC(HbO2), SNS(HbO2), SRBC(HbCO), SNS(HbCO), SRBC(Hb), and SNS(Hb), which the Applicants have measured and have found to be valid for both present Embodiments A and B of the light-scattering corrections. Figures 4 and 5 show the same data graphically at each of the measuring wavelengths (488.4, 520.1, 562.4, 585.2, 597.5, 621.7, and 671.7 nm). The present embodiment of the invention does not include measured values for the scattering vectors SRBC(Hi), SNS(Hi) or SRBC(SHb) because these less common hemoglobin species usually occur in low
concentrations and because the most common hemoglobin species HbO2, HbCO, and Hb usually dominate the blood composition in healthy and diseased patients. However, in Table I are given default values for the vectors SRBC(Hi), SNS(Hi) and SRBC(SHb). Moreover, the equations are general, so it is within the scope of the present invention to include measured values for these scattering vectors as well.
Table I. Scattering Vectors for Various Hemoglobin
Species In this table the indices 1, ..., 7 refer to the seven wavelengths 488.4, 520.1, 562.4, 585.2, 597.5, 621.7, and 671.7 nm, respectively. a. Scattering vectors for HbO2:
S1NS(HbO2) 41.33
S2NS(HbO2) 50.00
S3NS(HbO2) 109.37
S4NS(HbO2) 80.45
S5NS(HbO2) 3.18
S6NS(HbO2) 2.00
S7Ns(HbO2) 0.81
S1RBC(HbO2) 3.375
S2RBC(HbO2) 2.869
S3RBC(HbO2) 2.977
S4RBC(HbO2) 3.133
S5RBC(HbO2) 1.647
S6RBC(HbO2) 1.109
S7RBC(HbO2) 1.036 b. Scattering vectors for HbCO:
S1NS(HbCO) 16.46
S2NS(HbCO) 44.27
S3NS(HbCO) 114.30
S4NS(HbCO) 10.47 S5NS(HbCO) 0.90
S6NS(HbCO) 1.32
S7NS(HbCO) 1.10
S1RBC(HbCO) 3.288
S2RBC(HbCO) 3.152
S3RBC(HbCO) 3.274
S4RBC(HbCO) 2.619
S5RBC(HbCO) 1.618
S6RBC(HbCO) 1.168
S7RBC(HbCO) 1.024 c. Scattering vectors for Hi:
S1NS(Hi) 6.216
S2NS(Hi) 6.629
S3NS(Hi) 7.065
S4NS(Hi) 7.200
S5NS(Hi) 8.944
S6NS(Hi) 21.220
S7ΝS(Hi) 2.800
S1RBC(Hi) 1.000
S2RBC(Hi) 1.000
S3RBC(Hi) 1.000
S4RBc(Hi) 1.000
S5RBC(Hi) 1.000
S6RBC(HΪ) 1.000
S7RBC(Hi) 1.000 d. Scattering vectors for Hb:
S1NS(Hb) -38.13
S2NS(Hb) -70.24
S3NS(Hb) -82.10
S4NS(Hb) -81.07
S5NS(Hb) -41.43
S6NS(Hb) -10.81 S7NS(Hb) -4.03
S1RBC(Hb) 2 .037
S2RBC(Hb) 2.063
S3RBC(Hb) 2 .108
S4RBC(Hb) 2 .130
S5RBC(Hb) 1 .785
S6RBC(Hb) 1 .259
S7RBC(Hb) 1 .092 e. Scattering vector for SHb:
S1RBC(SHb) 1.000
S2RBC(SHb) 1.000
S3RBC(SHb) 1.000
S4RBC(SHb) 1.000
S5RBC(SHb) 1.000
S6RBC(SHb) 1.000
S7RBC(SHb) 1.000
The nonspecific scattering factor (NS) discovered by the Applicants provides a refinement of the more coarse correction for scattering by the red blood cells (RBC). Table II and Figure 7 show that the nonspecific
scattering correction improves the method over and above the accuracy achieved by the RBC correction alone. Table II contains the errors in the measurement of unaltered whole blood fully saturated with carbon monoxide with and without the nonspecific scattering correction. Table II. Efficacy of the Corrections for Nonspecific Light scattering.
Standard Deviation of %HbO2 %HbCO %Hi %Hb Error
RBC Correction only 1. 41 3 . 19 2 . 25 0. 50
RBC & nonspecific 0. 67 1. 28 0. 88 0. 53 correction
5. Corrections for the Effect of the Finite Spectral Bandwidth of the Light source
According to the present invention, a method is used to correct the measurements of the concentrations of HbO2, HbCO, Hi, Hb, SHb, and br for the effects of the finite bandwidth of the substantially monochromatic measuring wavelengths. This method is not necessary when the measuring wavelengths provided by light source B are sufficiently monochromatic, as is the case when the substantially monochromatic wavelengths are provided by isolated emission lines of a hollow cathode lamp.
However, if the half-intensity bandwidths of the
measuring wavelengths are greater than 1.0 nm, as they would be for a battery of LEDs and optical interference filters, this method proves beneficial.
The corrections for the finite spectral width of the light source are necessary because the molar extinction coefficients of the hemoglobin species vary rapidly with wavelength. Thus, when a given spectral width of
substantially monochromatic light is used, a range of (wavelength-dependent) extinction coefficients is
represented. For fixed spectral bandwidths of the substantially monochromatic wavelengths provided by light source B and over the range of ODs encountered in
operation of the apparatus of the present invention, the extinction coefficients of the hemoglobin species are linear functions of the concentrations of HbO2, HbCO, Hi, Hb, SHb, and bilirubin present in the sample under test, and the corrections in concentrations (given below) are linear functions of [HbO2], [HbCO], [Hi], [Hb], [SHb], and Tbr.
When corrections for the finite spectral bandwidth of the light source are necessary, the order of operation of the invention should be first to measure the optical densities at each of the seven wavelengths, then to apply the corrections for light scattering by the red blood cells and for nonspecific light scattering losses, and finally to make the corrections for the finite spectral bandwidth of the light source.
The method for the compensation of errors due the effects of the finite bandwidths of the substantially monochromatic wavelengths emitted by light source B proceeds as follows. After values for the concentrations have been corrected for the effects of light scattering by the red blood cells and for nonspecific light-scattering losses, the corrected concentration values, [HbO2], [HbCO], [Hi], [Hb], [SHb], and Tbr, are then used to compute spectral bandwidth corrections according to the following matrix equations:
Figure imgf000039_0001
Figure imgf000039_0002
The final concentrations are then computed according to the following formulae:
[HbO2]final = [HbO2] + [HbO2]correction
[HbCO]final = [HbCO] + [HbCO]correction
[Hi]final = [Hi] + [Hi]correction
[Hb]final = [Hb] + [Hb]correction
[SHb]final = [SHb] + [SHb]correction
[br]final = [br] + [br]correction These matrix equations are completely general in that the measurement error that is due to the effects of finite bandwidth can depend on the hemoglobin composition of the sample under test. When this method is used, the extinction coefficients in matrices 6A and 6B must be the extrapolated values for the limit of small
concentrations. The matrices in equations 9A and 9B depend on the values of the particular measuring
wavelengths and on the individual bandwidths and spectral distributions of the light at each of these wavelengths.
Referring now to Figure 9, presented is a flow chart of the method of operating the apparatus of Figure 6 to perform the method of Embodiment A, to correct for light scattering in accordance with the present invention.
Beginning in block 91, the counter n is initialized to zero. Then, in block 92, scattering vector sRBC is set equal to sRBC (HbO2). Then, in block 93 equation 6A is used to solve for [HbO2], [HbCO], [Hi], [Hb], [SHb], [br], and mRBCscat.
Then, control passes to block 94 where the counter n is incremented by one. In block 95, it is determined whether the counter n is greater than four. If not, control passes to block 96 where the quantities
calculated for the concentrations in step 93 are inserted into equation 7A to compute a new value for sRBC.
Control then returns to block 93. If, on the other hand, decision block 95 determines that counter n is greater than four, control passes to decision block 97 where it is determined whether the spectral width is greater than 1 nm. If so, control passes to block 98 where the finite bandwidth correction of equation 9A is performed. Then, in block 99, the latest values for the concentrations of the six constituent components are reported. If, on the other hand, decision block 97 determines that the
spectral width is not greater than 1 nm, control passes directly to block 99 for report of the concentrations.
Appendix A includes a source code listing in the C programming language which embodies the method of the flow chart of Figure 9. In practice, the method of the flow chart of Figure 9 embodied in the source code program of Appendix A or an equivalent program, is used to program computer 13 of Figure 6, to cause the
apparatus of Figure 6 to perform the method of Embodiment A to correct for light scattering.
Referring now to Figure 10, presented is a method of operating the apparatus of Figure 6, in accordance with the present invention, to perform the light-scattering correction of Embodiment B.
Beginning in block 101, the counter n is initialized to zero. Then, in block 92, scattering vector sRBC is set equal to sRBC(HbO2) and sNS is set equal to sNS(HbO2). Then, in block 103 equation 6B is used to solve for
[HbO2], [HbCO], [Hi], [Hb], [br], mRBCscat, and mNSscat.
Then, control passes to block 104 where the counter n is incremented by one. In block 105, it is determined whether the counter n is greater than four. If not, control passes to block 106 where the quantities
calculated for the concentrations in step 103 are
inserted into equations 7B and 8B to compute a new value for sRBC. Control then returns to block 103. If, on the other hand, decision block 105 determines that counter n is greater than four, control passes to decision block 107 where it is determined whether the spectral width is greater than 1 nm. If so, control passes to block 108 where the finite bandwidth correction of equation 9B is performed. Then, in block 109, the latest values for the concentrations of the six constituent components are reported. If, on the other hand, decision block 107 determines that the spectral width is not greater than 1 nm, control passes directly to block 109 for report of the concentrations.
Appendix B includes a source code listing in the C programming language which embodies the method of the flow chart of Figure 10. In practice, the method of the flow chart of Figure 10, embodied either in the source code program of Appendix B or an equivalent program, is used to program computer 13 of Figure 6, to cause the apparatus of Figure 6 to perform the method of Embodiment B to correct for light scattering.
Neither Embodiment A nor B allows the simultaneous use of the nonspecific scattering factor and the
measurement of sulfhemoglobin. A third specific
embodiment. Embodiment C, which utilizes one more
wavelength than Embodiments A and B, accommodates both of these features. Embodiment C uses the same first seven wavelengths as do Embodiments A and B. In Embodiment C, the following rules hold: both light scattering by red blood cells and nonspecific light scattering are
considered, and the concentrations of six compounds are measured, namely HbO2, HbCO, Hi, Hb, SHb, and br. In Embodiment C, the eighth wavelength is chosen so that the differences e6HbO2 - e8HbO2, e6HbCO - e8HbCO, e6Hi - e8Hi, e6Hb - e8Hb, e6br - e8br, e6RBC - e8RBC, and e6NS - e8NS, are simultaneously small while e6SHb - e8SHb is quite large, i.e., in the 635 to 645 nm range. The choice of the eighth wavelength, in view of the mathematical relationship between a matrix and its inverse, assures that the computation of sulfhemoglobin concentration is primarily dependent on the 6th and 8th wavelengths and is affected very little by the other six wavelengths.
Embodiment C preferably uses 638 nm as its eighth
wavelength. If the samarium-neon hollow-cathode lamp is used, the preferred eighth wavelength among its emission lines is 638.3 nm.
The relevant equations for Embodiment C are as follows:
Embodiment C:
ODiabs = eiHbO2[HbO2] + eiHbCO[HbCO] + eiHi[Hi] + eiHb[Hb] + eisHb[SHb] + eibr[br]
Figure imgf000044_0001
Figure imgf000045_0001
Figure imgf000045_0002
Figure imgf000046_0001
wherein [HbO2], [HbCO], [Hi], [Hb], and [SHb] are the concentrations of the indicated hemoglobin species in the sample, mRBCscat and mNSscat are magnitudes of light
scattering by the red blood cells and by the nonspecific factor, and THb = [HbO2] + [HbCO] + [Hi] + [Hb] + [SHb]. OD1, ..., OD8 are the apparent optical densities of a sample of unaltered whole blood measured at each of the eight wavelengths, 488.4, 520.1, 562.4, 585.2, 597.5, 621.7, 671.7, and 638.3 nm, respectively.
Shown in the following addendum to Table I are the additional scattering parameters which are necessary (in addition to the parameters in Table I) for use in
Embodiment C.
Addendum to Table I. Values for s8NS(·), s8RBC(·), and sNS(SHb) for Embodiment C. In this addendum the indices 1,...,8 refer specifically (and only) to the seven wavelengths 488.4, 520.1, 562.4, 585.2, 597.5, 621.7, 671.7, and 638.3 nm, respectively. s8NS(HbO2) s8NS(HbCO) s8NS(Hi) s8NS(Hb) s8NS(SHb)
1.379 0.682 22.259 -7.463 22.259 s8RBC(HbO2) s8RBC (HbCO) s8RBC(Hi) s8RBC(Hb) S8RBC(SHb)
1.051 1.117 1.000 1.202 1.000 s1NS(SHb) 6.216
s2NS(SHb) 6.629
s3NS(SHb) 7.065
s4NS(SHb) 7.200
s5NS(SHb) 8.944
s6NS(SHb) 21.220
s7NS(SHb) 2.800
s8NS(SHb) 22.259 6. Comparative Example
To demonstrate the utility of the present invention in comparison with prior art, the Applicants made
measurements of the concentrations of various hemoglobin species using a Radiometer OSM3 Hemoximeter and using the present invention. The Radiometer OSM3 employs an ultrasonic hemolyzer, and is believed to embody the optical geometry of Johansen et al. (U.S. Patent
3,972,614), and the method and apparatus of Lundsgaard (U.S. Patent 4,997,769) to correct for the turbidity of hemolyzed blood.
In normal operation, the OSM3 first ultrasonically hemolyses each sample, then makes measurements of the sample's optical absorbance at multiple wavelengths, and finally uses the method of Lundsgaard to correct for the residual turbidity of the hemolyzed sample. To determine whether the method and apparatus of Lundsgaard could accurately measure hemoglobin concentrations in unaltered whole blood, the Applicants analyzed blood samples with the OSM3 operating normally and then analyzed the same blood samples with the OSM3's ultrasonic hemolyzer disabled.
Table III shows that the Radiometer OSM3, believed to use the method and apparatus of Lundsgaard (U.S.
Patent 4,997,769), gives completely erroneous results when the blood sample is not hemolyzed. For example, measurements of the total hemoglobin concentrations with and without hemolysis differ by as much as 7.4 grams/dl. Similarly, it is physically impossible for the relative concentration of oxyhemoglobin to be 400% or for the concentration of carboxyhemoglobin to be negative (-99%). Thus, it is readily apparent that the method and apparatus of Lundsgaard fail to yield even plausible results on unaltered, whole blood.
Figure imgf000050_0001
To evaluate the present invention's ability to make accurate measurements directly on unaltered, whole blood, the Applicants employed the herein described methods and apparatus that constitute the present invention and made measurements of the concentrations of various hemoglobin species in blood samples before and after hemolysis. The results appear in Table IV.
Figure imgf000052_0001
Table IV shows that the measured total hemoglobin concentrations with and without hemolysis typically differ by only a few tenths of a gram/dl. Similarly, the measurements of the relative concentrations of oxy-, carboxy-, and methemoglobin are consistently in close agreement in all of the samples. In summary, the results shown in Tables III and IV demonstrate conclusively that the present invention enables one skilled in the art to make accurate measurements of the hemoglobin
concentrations directly in unaltered, whole blood;
whereas the method and apparatus of Lundsgaard fail to obtain satisfactory results.
While the present invention has been described in connection with preferred embodiments, it will be
understood that these embodiments are only examples, and should not be considered a limitation of the present invention.
APPENDIX A
COPYRIGHT, 1992, BOARD OF REGENTS, THE UNIVERSITY OF TEXAS SYSTEM /***************************************************************/
I* FUNCTIONS: 1) void slope_comp_LED() */
/* 2) void OD_to_7sat_LED() */
/* 3) void slope_recur_LED() */
/***************************************************************/
#include "C:\ATG\AVOX\C_PROG\TYPE\AVOX_TYP.C"
#include "C:\ATG\AVOX\C J'ROGNDEF\AVOXJDEF.C"
include "C:\ATG\AVOX\C_PROG\MATH\MATH_DEF.C"
#include "C:\ATG\AVOX\C_PROG\HDR\A VOX_HDR.C"
extern const vector Insats_vec;
extern const matrix Identity_mtx;
extern const matrix Scat_mtx;
extern const matrix Sulf_mtx;
extern const matrix THbslp_mtx;
void slope_comp_LED(Xinsat,Xscat,Xsulf,XTHb)
vector *Xinsat; /* Xinsat (Input) = 'Initial %Sats' */
vector *Xscat; /* Xscat (Output) = 'Scat Slopes (Vector)' */
vector *Xsulf; /* Xsulf (Output) = 'Sulf Slopes (Vector)' */
vector *XTHb; /* XTHb (Output) = 'THb Slopes (Vector)' */
{
AtimesX((matrix*)Scat_mtx,Xinsat,Xscat);
AtimesX((matrix *)Sulf_mtx,Xinsat,Xsulf);
AtimesX((matrix *)THbslp_mtx,Xinsat,XTHb);
return;
} /* end slope_comp_LED() */
void OD_to_7sat_LED(AExtC2,ACa1S,ACsats,XODs,XSHbs,Xsats,XScatCF,Xsats1P,
xTotHb,xTHbc,EnSlp,EnTHb,EnVer)
matrix *AExtC2; /* AExtC2 (Input) = 'Extinction Coeffs.2' */
matrix *ACalS; /* ACalS (Input) = 'Calibration Sats' */
matrix *ACsats; /* ACsats (Input) = 'Computed Sats' */
vector *XODs; /* XODs (Input) = 'ODs' */
vector *XSHbs; /* XSHbs (Output) = 'SHb Correction Factors' */
vector *Xsats; /* Xsats (Output) = 'SATS' */
vector *XScatCF; /* XScatCF (Output) = 'Scattering Corr'n Fac.' */
vector *XsatslP; /* Ssats1P (Output) = 'SATS.1st.Pass' */
l_real *xTotHb; /* xTotHb (Output) = Total Hb' */
l_real xTHbc; /* xTHbc (Input) = 'THb constant' */
boolean EnSlp; /* EnSlp (Input) = 'Enable Slopes' */
boolean EnTHb; /* EnTHb (Input) = 'Enable THb Slopes' */
boolean EnVer, /* EnVer (Input) = 'Black-Old version; Wht-'*/
{
matrix Atmp1,Atmp2,Atmp3;
vector Xtmp1,Xtmp2,Xtmp3,Xtmp4,Xtmp5,Xtmp6,Xtmp7,Xtmp8;
l_real Xtmp1,xtmp2,xtmp3,xtmp4,xtmp5,xtmp6,xtmp7,xtmp8,xtmp9,xsum;
l_real sulf_thb_cutoff, sulf_slp_cutoff;
boolean enable_slp, enable_thb_slp;
Ainverse((matrix*)ACalS,(matrix *)Atmp1);
AtimesB((matrix *)Atmp1, (matrix *)ACsats,(matrix *)Atmp2);
AtimesB((matrix *)Atmp2,(matrix *)AExtC2,(matrix *)Atmp1);
Atranspose((matrix *)Atmp1,(matrix *)Atmp2);
Ainverse((matrix *)Atmp2,(matrix *)Atmp3); /* switch and calculate Y from XODs - do not change Atmp3 yet */
xtmp1 = getXvalue((vector *)XODs,0);
xtmp2 = x_abs(xtmp1);
xtmp3 = xtmp1 /xtmp2;
Xtimesx((vector *)XODs,xtmp3,(vector *)Xtmp1); /* Xtmp1 = Y */
AtimesX((matrix *)Atmp3,(vector *)Xtmp1,(vector *)Xtmp2); /* may discard Atmp3 now */
Xsubset((vector *)Xtmp2,0,5,(vector *)Xtmp3);
xsum = Xsum(( vector *)Xtmp3);
Xdivx((vector *)Xtmp2,xsum,(vector *)Xtmp1);
eep_set_var((u_long)&enable_slp,"Enable_Slopes");
eep_set_var((u_long)&enable_thb_slp,"Enable_THb_Slopes");
sulf_thb_cutoff = (l_real)- 1.0;
sulf_slp_cutoff = (l_real)- 1.0;
/*******************************************/
/* slope_recur_LED #1 */
/* parameter = variable IO */
/* Xsatsf = Xtmp1 */
/* Xconc = Xtmp2 */
/* Xscat = Xtmp3 (output-discarded) */
I* Xsulf = Xtmp4 (output-discarded) */
/* Xsats = Xtmp5 */
/* xsulfTHb = sulf_thb_cutoff */
/* xsulfslp = sulf_slp_cutoff */
/* xTHbc = xTHbc */
/* EnSlp = enable_slp */
/* EnTHb = enable_thb_slp */
/******************************************/
slope_recur_LED ((vector *)Xtmp1,
(vector *)Xtmp2,
(vector *)Xtmp3,
(vector *)Xtmp4,
(vector *)Xtmp5,
(l_real)sulf_thb_cutoff,
(l_real)sulf_slp_cutoff,
(l_real)xTHbc,
(boolean)enable_slp,
(boolean)enable_thb_slp);
Xtimesx((vector *)Xtmp5,(l_real)100.0,(vector *)Xsats1P); /* define SATS.1st.Pass *//*********************************/
/* slope_recur_LED #2 */
/* parameter = variable IO */
/* Xsatsf = Xtmp5 */
/* Xconc = Xtmp2 */
/* Xscat = Xtmp7 */
/* Xsulf = Xtmp8 */
/* Xsats = Xtmp1 */
/* xsulfTHb = sulf_thb_cutoff*/
/* xsulfslp = sulf_slp_cutoff*/
/* xTHbc = xTHbc */
/* EnSlp = enable_slp */
/* EnTHb = enable_thb_slp */
/********************************* /
slope_recur_LED ((vector *)Xtmp5,
(vector *)Xtmp2, (vector *)Xtmp7,
(vector *)Xtmp8,
(vector *)Xtmp1,
(l_real)sulf_thb_cutoff, (l_real)sulf_slp_cutoff, (l_real)xTHbc,
(boolean)enable_slp,
(boolean)enable_thb_slp);
/*******************************************/
/* slope_recur_LED #3 */
/* parameter = variable IO */
/* Xsatsf = Xtmp1 */
/* Xconc = Xtmp2 */
/* Xscat = Xtmp3 (output-discarded) */
/* Xsulf = Xtmp4 (output-discarded) */
/* Xsats = Xtmp5 */
/* xsulfTHb = sulf_thb_cutoff */
/* xsulfslp = sulf_slp_cutoff */
/* xTHbc = xTHbc */
/* EnSlp = enable_slp */
/* EnTHb = enable_thb_slp */
/******************************************/ slope_recur_LED ((vector *)Xtmp1,
(vector *)Xtmp2,
(vector *)Xtmp3,
(vector *)Xtmp4,
(vector *)Xtmp5,
(l_real)sulf_thb_cutoff, (l_real)sulf_slp_cutoff, (l_real)xTHbc,
(boolean)enable_slp,
(boolean)enable_thb_slp);/*********************************/
/* slope_recur_LED #4 */
/* parameter = variable IO */
/* Xsatsf = Xtmp5 */
/* Xconc = Xtmp2 */
/* Xscat =Xtmp7 */
/* Xsulf = Xtmp8 */
/* Xsats = Xtmp1 */
/* xsulfTHb = sulf_thb_cutoff*/
/* xsulfslp = sulf_slp_cutoff*/
/* xTHbc = xTHbc */
/* EnSlp = enable_slp */
/* EnTHb = enable_thb_slp */
/*********************************/
slope_recur_LED ((vector *)Xtmp5,
(vector *))tmp2,
(vector *)Xtmp7,
(vector *)Xtmp8,
(vector *)Xtmp1,
(l_real)sulf_thb_cutoff, (l_real)sulf_slp_cutoff, (l_real)xTHbc,
(boolean)enable_slp, (boolean)enable_thb_slp);
Xsubset((vector *)Xtmp5,0,4,(vector *)Xtmp3);
Xtimesx((vector *)Xtmp1,(l_real)100.0,(vector *)Xsats); /* define Xsats */
Xclear((vector *)Xtmp6);
Xtmp6[0] = (l_real)0.020;
Xtmp6[1] = (l_real)0.020;
Xtmp6[2] = (l_real)0.000;
Xtmpό[3] = (l_real)0.016;
xtmp4 = XY_inproduct((vector *)Xtmp3,(vector *)Xtmp6);
xtmp1 = Xtmp2[6];
xtmp7 = xtmp1 * xtmp4;
xtmp8 = Xtmp2[4];
xtmp9 = xtmp7 + xtmp 8;
xtmp4 = xtmp9 / xsum; /* xtmp4 gets compared to -1.0 */
Xclear((vector *)Xtmp7);
Xtmp7[0] = (l_real)-7.50;
Xtmp7[1] = (l_real)-2.50;
Xtmp7[2] = (l_real) 0.00;
Xtmp7[3] = (l_real) 12.00;
xtmp5 = XY_inproduct((vector *)Xtmp3, (vector *)Xtmp7);
Xclear((vector *)Xtmp8);
Xtmp8[0] = (l_real)-0.280;
Xtmp8[1] = (l_real)-0.280;
Xtmp8[2] = (l_real) 0.000;
Xtmp8[3] = (l_real)-0.150;
xtmp6 = XY_inproduct((vector *)Xtmp3, (vector *)Xtmp8);
if (EnSlp == FALSE) {
xtmp5 = (l_real)0.0;
xtmp6 = (l_real)0.0;
} /* end if Enable Slopes is FALSE */
if(xtmp4 > (l_real)- 1.0) { xtmp5 = (l_real)0.0; }
xtmp4 = xtmp5 * xtmp9;
xtmp2 = xtmp6 * xtmp1;
xtmp3 = xtmp4 + xtmp2;
xtmp4 = xsum + xtmp3;
*xTotHb = xTHbc * xtmp4;
return;
} /* end OD_to_7sat_LED() */ void slope_recur_LED(Xsatsf, Xconc, Xscat, Xsulf, Xsats, xsulfTHb,
xsulfslp, xTHbc, EnSlp, EnTHb)
vector *Xsatsf; /* Xsatsf (Input) = 'Sats (fractional)' */
vector *Xconc; /* Xconc (Input) = 'Concentrations' */
vector *Xscat; /* Xscat (Output) = 'Scat slopes' */
vector *Xsulf; /* Xsulf (Output) = 'Sulf slopes' */
vector *Xsats; /* Xsats (Output) = 'SATS' */
l_real xsulfTHb; /* xsulfTHb (Input) = 'Sulf THb Cut-off */
l_real xsulfslp; /* xsulfslp (Input) = 'Sulf Slope Cut-off */
l_real xTHbc; /* xTHbc (Input) = "THb constant' */
boolean EnSlp; /* EnSlp (Input) = 'Enable Slopes' */
boolean EnTHb; /* EnTHb (Input) = 'Enable THb Slopes' */
{
vector Xtmp1,Xtmp2,Xtmp3,Xtmp4; l_real xtmp1,xtmp2,xtmp3, xsum;
long int1;
/* function call: slope_comp_LED() */
/* parameter = variable I/O */
I* Xinsat = Xsatsf I */
/* Xscat = Xscat O */
/* Xsulf = Xsulf O */
/* XTHb = Xtmp1 O */
slope_comp_LED((vector *)Xsatsf,(vector *)Xscat,(vector *)Xsulf, (vector *)Xtmp1); if (EnTHb == TRUE){ xtmp1 = (Lreal) 1.0; }
else{ xtmp1 = (l_real)0.0; }
Xtimesx((vector *)Xtmp1,xtmp1,(vector *)Xtmp2) ;
Xsubset((vector *)Xconc,0,5,(vector *)Xtmp3);
xsum = Xsum((vector *)Xtmp3);
xtmp1 = xTHbc * xsum;
xtmp2 = xtmp1 - (l_real) 13.5;
Xtimesx((vector *)Xtmp2,xtmp2,(vector *)Xtmp1);
Xdivx((vector *)Xtmp1,(l_real) 100.0,(vector *)Xtmp3); /* save Xtmp3 */ if (EnSlp == TRUE){ xtmp1 = (l_real) 1.0; }
else{ xtmp1 = (l_real)0.0; }
Xtimesx((vector *)Xscat,xtmp1, (vector *)Xtmp1);
xtmp2 = getXvalue( (vector *)Xconc,6);
Xtimesx((vector *)Xtmp1,xtmp2,(vector *)Xtmp2);
XplusY((vector *)Xtmp2,(vector *)Xconc,(vector *)Xtmp1);
xtmp3 = getXvalue((vector *)Xtmp1,4);
xtmp2 = xtmp3 / xsum;
if(xtmp2 > xsulfTHb) { int1 = 5; )
else{ intl = 4; }
if(xtmp2 > xsulfslp) { xtmp2 = (l_real)0.0; }
else( xtmp2 = (l_real) 1.0; }
Xtimesx((vector *)Xsulf,xtmp1, (vector *)Xtmp4);
Xtimesx((vector *)Xtmp4,xtmp2,(vector *)Xtmp2);
Xtimesx((vector *)Xtmp2,xtmp3,(vector *)Xtmp4);
XplusY((vector *)Xtmp1, (vector *)Xtmp4,(vector *)Xtmp2);
Xsubset((vector *)Xtmp2,0,int1, (vector *)Xtmp1);
xtmp3 = Xsum((vector *)Xtmp1);
Xdivx((vector *)Xtmp2,xtmp3,(vector *)Xtmp4);
xtmp1 = Xtmp2[5];
xtmp2 = xTHbc * xtmp1;
Xtmp4[5] = xtmp2; /* place value into vector */
XplusY((vector *)Xtmp3, (vector *)Xtmp4,(vector *)Xsats);
return;
} /* end slope_recur_LED() */
/* END FILE: MTX_COMP.C */ APPENDIX B
COPYRIGHT , 1992 , BOARD OF REGENTS , THE UNIVERSITY OF TEXAS SYSTEM /***************************************************************/
/* FUNCTIONS: 1) void slope_comp_LED() */
I* 2) void OD_to_7sat_LED() */
/* 3) void slope_recur_LED() */
/***************************************************************/
#include "C:\ATGV\VOX\C_PROG\TYPE\AVOX_TYP.C"
#include ''C:\ATG\A VOX\C_ ROG\DEF\AVOX_DEF.C"
#include "C:\ATG\AVOX\C_PROG\MATHMATH_DEF.C"
#include "C:\ATG\AVOX\C_PROG \HDR\AVOX_HDR.C"
extern const vector Insats_vec;
extern const matrix Identity_mtx;
extern const matrix Scat_mtx;
extern const matrix Sulf_mtx;
extern const matrix TΗbslp_mtx;
void slope_comp_LED(Xinsat,Xscat,Xsulf,XTHb)
vector *Xinsat; /* Xinsat (Input) = 'Initial %Sats' */
vector *Xscat; /* Xscat (Output) = 'Scat Slopes (Vector)' */
vector *Xsulf; /* Xsulf (Output) = 'Sulf Slopes (Vector)' */
vector *XTΗb; /* XTHb (Output) = 'THb Slopes (Vector)' */
{
AtimesX((matrix *)Scat_mtx,Xinsat,Xscat);
AtimesX((matrix *)Sulf_mtx,Xinsat,Xsulf) ;
AtimesX((matrix *)THbslp_mtx,Xinsat,XTHb);
return;
} /* end slope_comp_LED() */
void OD_to_7sat_LED(AExtC2,ACalS,ACsats,XODs,XSHbs,Xsats,XScatCF,Xsats1P,
xTotHb,xTHbc,EnSlp,EnTHb,EnVer)
matrix *AExtC2; /* AExtC2 (Input) = 'Extinction Coeffs.2' */
matrix *ACalS; /* ACalS (Input) = 'Calibration Sats' */
matrix *ACsats; /* ACsats (Input) = 'Computed Sats' */
vector *XODs; /* XODs (Input) = 'ODs' */
vector *XSHbs; /* XSHbs (Output) = 'SHb Correction Factors' */
vector *Xsats; /* Xsats (Output) = 'SATS' */
vector *XScatCF; /* XScatCF (Output) = 'Scattering Corr'n Fac.' */
vector *XsatslP; /* Ssats1P (Output) = 'SATS.lst.Pass' */
l_real *xTotHb; /* xTotHb (Output) = Total Hb' */
l_real xTHbc; /* xTHbc (Input) = 'THb constant' */
boolean EnSlp; /* EnSlp (Input) = 'Enable Slopes' */
boolean EnTHb; /* EnTHb (Input) = 'Enable THb Slopes' */
boolean EnVer, /* EnVer (Input) = 'Black-Old version; Wht-'*/
{
matrix Atmp1,Atmp2,Atmp3;
vector Xtmp1,Xtmp2,Xtmp3,Xtmp4,Xtmp5,Xtmp6,Xtmp7,Xtmp8;
l_real Xtmp1,xtmp2,xtmp3,xtmp4,xtmp5,xtmp6,xtmp7,xtmp8,xtmp9,xsum;
l_real sulf_thb_cutoff, sulf_slp_cutoff;
boolean enable_slp, enable_thb_slp;
Ainverse((matrix *)ACalS, (matrix *)Atmp1);
AtimesB ((matrix *)Atmp1, (matrix *)ACsats,(matrix *)Atmp2);
AtimesB ((matrix*)Atmp2,(matrix *)AExtC2,(matrix *)Atmp1);
Atranspose((matrix *)Atmp1, (matrix *)Atmp2);
Ainverse((matrix *)Atmp2,(matrix *)Atmp3); /* switch and calculate Y from XODs - do not change Atmp3 yet */
xtmp1 = getXvalue((vector *)XODs,0);
xtmp2 = x_abs(xtmp1);
xtmp3 = xtmp1 / xtmp2;
Xtimesx((vector *)XODs,xtmp3,(vector *)Xtmp1); /* Xtmp1 = Y */
AtimesX((matrix *)Atmp3,(vector *)Xtmp1,( vector *)Xtmp2); /* may discard Atmp3 now */
Xsubset((vector *)Xtmp2,0,5,(vector *)Xtmp3);
xsum = Xsum((vector *)Xtmp3);
Xdivx((vector *)Xtmp2,xsum,(vector *)Xtmp1);
eep__set_var((u_long)&enable_slp,"Enable_Slopes");
eep_set_var((u_long)&enable_thb_slp,"Enable_THb_Slopes");
sulf_thb_cutoff = (l_real) 1.25;
sulf_slp_cutoff = (Lreal) 1.25;
/*******************************************/
/* slope_recur_LED #1 */
/* parameter = variable IO */
/* Xsatsf = Xtmp1 */
/* Xconc = Xtmp2 */
/* Xscat = Xtmp3 (output-discarded) */
/* Xsulf = Xtmp4 (output-discarded) */
/* Xsats = Xtmp5 */
/* xsulfTHb = sulf_thb_cutoff */
/* xsulfslp = sulf_slp_cutoff */
/* xTHbc = xTHbc */
/* EnSlp = enable_slp */
/* EnTHb = enable_thb_slp */
/*******************************************/
slope_recur_LED((vector *)Xtmp1,
(vector *)Xtmp2,
(vector *)Xtmp3,
(vector *)Xtmp4,
(vector *)Xtmp5,
(l_real)sulf_thb_cutoff,
(l_real)sulf_slp_cutoff,
(Lreal)xTHbc,
(boolean)enable_slp,
(boolean)enable_thb_slp);
Xtimesx((vector *)Xtmp5,(l_real)100.0,(vector *)Xsats1P); /* define SATS.1st.Pass *//*********************************/
/* slope_recur_LED #2 */
/* parameter = variable IO */
/* Xsatsf = Xtmp5 */
/* Xconc = Xtmp2 */
/* Xscat = Xtmp7 */
I* Xsulf = Xtmp8 */
/* Xsats = Xtmp1 */
I* xsulfTHb = sulf_thb_cutoff*/
/* xsulfslp = sulf_slp_cutoff*/
/* xTHbc = xTHbc */
/* EnSlp = enable_slp */
I* EnTHb = enable_thb_slp */
/********************************* /
slope_recur_LED((vector *)Xtmp5,
(vector *)Xtmpm, (vector *)Xtmp7,
(vector *)Xtmp8,
(vector *)Xtmp1,
(l_real)sulf_thb_cutoff, (l_real)sulf_slp_cutoff, (l_real)xTHbc,
(boolean)enable_slp ,
(boolean)enable_thb_slp); /*******************************************/
/* slope_recur_LED #3 */
/* parameter = variable IO */
/* Xsatsf = Xtmp1 */
/* Xconc = Xtmp2 */
/* Xscat = Xtmp3 (ouφut-discarded) */
/* Xsulf = Xtmp4 (output-discarded) */
/* Xsats = Xtmp5 */
/* xsulfTHb = sulf_thb_cutoff */
/* xsulfslp = sulf_slp_cutoff */
/* xTHbc = xTHbc */
/* EnSlp = enable_slp */
/* EnTHb = enable_thb_slp */
/******************************************* / slope_recur_LED ((vector *)Xtmp1,
(vector *)Xtmp2,
(vector *)Xtmp3,
(vector *)Xtmp4,
(vector *)Xtmp5,
(l_real)sulf_thb_cutoff, (l_real)sulf_slp_cutoff, (l_real)xTHbc,
(boolean)enable_slp,
(boolean)enable_thb_slp);/*********************************/
/* slope_recur_LED #4 */
/* parameter = variable IO */
/* Xsatsf =Xtmp5 */
/* Xconc = Xtmp2 */
/* Xscat =Xtmp7 */
/* Xsulf = Xtmp8 */
/* Xsats = Xtmp1 */
/* xsulfTHb = sulf_thb_cutoff*/
/* xsulfslp = sulf_slp_cutoff*/
/* xTHbc = xTHbc */
/* EnSlp = enable_slp */
/* EnTHb = enable_thb_slp */
/*********************************/
slope_recur_LED((vector *)Xtmp5,
(vector *)Xtmp2,
(vector *)Xtmp7,
(vector *)Xtmp8,
(vector *)Xtmp1,
(l_real)sulf_thb_cutoff, (l_real)sulf_slp_cutoff, (l_real)xTHbc,
(boolean)enable_slp, (boolean)enable_thb_slp);
Xsubset((vector *)Xtmp5,0,4,(vector *)Xtmp3);
Xtimesx((vector *)Xtmp1,(l_real)100.0,(vector *)Xsats); /* define Xsats */
Xclear((vector *)Xtmp6);
Xtmp6[0] = (l_real)0.020;
Xtmp6[1] = (l_real)0.020;
Xtmp6[2] = (l_real)0.000;
Xtmp6[3] = (l_real)0.016;
xtmp4 = XY_inproduct((vector *)Xtmp3, (vector *)Xtmp6);
xtmp1 = Xtmp2[6];
xtmp7 = xtmp1 * xtmp4;
xtmp8 = Xtmp2[4];
xtmp9 = xtmp7 + xtmp 8;
xtmp4 = xtmp9 / xsum; /* xtmp4 gets compared to 1.25 */
Xclear((vector *)Xtmp7);
Xtmp7[0] = (l_real)-7.50;
Xtmp7[1] = (l_real)-2.50;
Xtmp7[2] = (l_real) 0.00;
Xtmp7[3] = (l_real)12.00;
xtmp5 = XY_inproduct((vector *)Xtmp3,(vector *)Xtmp7);
Xclear((vector *)Xtmp8);
Xtmp8[0] = (l_real)-0.280;
Xtmp8[1] = (l_real)-0.280;
Xtmp8[2] = (Lreal) 0.000;
Xtmp8[3] = (l_real)-0.150;
xtmp6 = XY_inproduct((vector *)Xtmp3, (vector *)Xtmp8);
if (EnSlp = FALSE) {
xtmp5 = (l_real)0.0;
xtmp6 = (l_real)0.0;
} /* end if Enable Slopes is FALSE */
if(xtmp4 > (l_real) 1.25) { xtmp5 = (l_real)0.0; }
xtmp4 = xtmp5 * xtmp9;
xtmp2 = xtmp6 * xtmp1;
xtmp3 = xtmp4 + xtmp2;
xtmp4 = xsum + xtmp3;
*xTotHb = xTHbc * xtmp4;
return;
) /* end OD_to_7sat_LED0 */ void slope_recur_LED(Xsatsf, Xconc, Xscat, Xsulf, Xsats, xsulfTHb,
xsulfslp, xTHbc, EnSlp, EnTHb)
vector *Xsatsf; /* Xsatsf (Input) = 'Sats (fractional)' */
vector *Xconc; /* Xconc (Input) = 'Concentrations' */
vector *Xscat; /* Xscat (Output) = 'Scat slopes' */
vector *Xsulf; /* Xsulf (Output) = 'Sulf slopes' */
vector *Xsats; /* Xsats (Output) = 'SATS' */
l_real xsulfTHb; /* xsulfTHb (Input) = 'Sulf THb Cut-off */
l_real xsulfslp; /* xsulfslp (Input) = 'Sulf Slope Cut-off */
l_real xTHbc; /* xTHbc (Input) = 'THb constant' */
boolean EnSlp; /* EnSlp (Input) = 'Enable Slopes' */
boolean EnTHb; /* EnTHb (Input) = 'Enable THb Slopes' */
{
vector Xtmp1,Xtmp2,Xtmp3,Xtmp4, l_real xtmp1,xtmp2,xtmp3,xsum;
long int1;
/* function call: slope_comp_LED() */
/* parameter = variable I/O */
I* Xinsat = Xsatsf I */
/* Xscat = Xscat O */
/* Xsulf = Xsulf O */
/* XTHb = Xtmp1 O */
slope_comp_LED((vector *)Xsatsf,(vector *)Xscat,(vector *)Xsulf,(vector *)Xtmp1); if(EnTHb = TRUE){ xtmp1 = (l_real)l.O; }
else{ xtmp1 = (l_real)0.0; }
Xtimesx((vector *)Xtmp1, xtmp1, (vector *)Xtmp2);
Xsubset((vector *)Xconc,0,5,(vector *)Xtmp3);
xsum = Xsum((vector *)Xtmp3);
xtmp1 = xTHbc * xsum;
xtmp2 = xtmp1 - (l_real)13.5;
Xtimesx((vector *)Xtmp2,xtmp2,(vector *)Xtmp1);
Xdivx((vector *)Xtmp1, (l_real) 100.0,(vector *)Xtmp3); /* save Xtmp3 */ if (EnSlp == TRUE){ xtmp1 = (l_real) 1.0; }
else{ xtmp1 = (l_real)0.0; }
Xtimesx((vector *)Xscat,xtmp1, (vector *)Xtmp1);
xtmp2 = getXvalue((vector *)Xconc,6);
Xtimesx((vector *)Xtmp1,xtmp2,(vector *)Xtmp2);
XplusY(( vector *)Xtmp2,(vector *)Xconc,(vector *)Xtmp1);
xtmp3 = getXvalue((vector *)Xtmp1,4);
xtmp2 = xtmp3 / xsum;
if(xtmp2 > xsulfTHb) { int1 = 5; }
else{ intl = 4; }
if(xtmp2 > xsulfslp) { xtmp2 = (l_real)0.0; }
else{ xtmp2 = (l_real) 1.0; }
Xtimesx((vector *)Xsulf, xtmp1, (vector *)Xtmp4);
Xtimesx((vector *)Xtmp4,xtmp2,(vector *)Xtmp2);
Xtimesx((vector *)Xtmp2,xtmp3,(vector *)Xtmp4);
XplusY((vector *)Xtmp1, (vector *)Xtmp4,(vector *)Xtmp2);
Xsubset((vector *)Xtmp2,0,int1, (vector *)Xtmp1);
xtmp3 = Xsum((vector *)Xtmp1);
Xdivx((vector *)Xtmp2,xtmp3,(vector *)Xtmp4);
xtmp1 = Xtmp2[5];
xtmp2 = xTHbc * xtmp1;
Xtmp4[5] = xtmp2; /* place value into vector */
XplusY((vector *)Xtmp3, (vector *)Xtmp4,(vector *)Xsats);
return;
} /* end slope_recur_LED() */
/* END FILE: MTX_COMP.C */

Claims

CLAIMS :
1. A method of determining the concentrations of a plurality of constituent components of unaltered whole blood, including: generating a plurality of substantially
monochromatic radiation wavelengths, each wavelength of an absorbance subset of said plurality of wavelengths having been selected by their ability to distinguish the constituent components and having been selected to minimize the effects of radiation scattering and to maximize radiation absorbance by said constituent components, and each wavelength of a scattering subset of said plurality of wavelengths having been selected to maximize the effects of radiation scattering by unaltered whole blood relative to the effects of radiation absorbance by unaltered whole blood; irradiating a sample of unaltered whole blood with said plurality of radiation wavelengths, through a depth of said sample chosen to minimize radiation scattering by unaltered whole undiluted blood; detecting intensities of said radiation wavelengths, after passing through said depth of said sample, at a distance from said sample, and over a detecting area, both chosen to minimize the effects of radiation scattering by unaltered whole blood on the determination of concentration of said constituent components; and calculating concentrations of said plurality of
constituent components of said sample of unaltered whole blood, based upon detected intensities of each of said plurality of radiation wavelengths, and based upon predetermined molar extinction coefficients for each of said constituent components at each of said radiation wavelengths of said absorbance subset.
2. The method of claim 1, wherein said depth of said sample is in the range of 80 to 150 micrometers.
3. The method of claim 2 , wherein said depth of said sample is approximately 90 micrometers.
4. The method of claim 1, wherein said detecting area is at least approximately 150 square millimeters.
5. The method of claim 4, wherein said detecting area is at least approximately 600 square millimeters.
6. The method of claim 1, wherein said distance from said sample is within the range of 0 to 10 millimeters.
7. The method of claim 6, wherein said distance from said sample is approximately 1 millimeter.
8. The method of claim 1, wherein said step of
detecting is performed over a half-aperture angle of radiation emanating from said sample of at least
approximately 30 degrees.
9. The method of claim 8, wherein said step of
detecting is performed over a half-aperture angle of radiation emanating from said sample of at least
approximately 70 degrees.
10. The method of claim 1, further comprising: correcting said calculated concentrations of
constituent components for the effects of finite spectral bandwidth of the substantially monochromatic wavelengths on the extinction coefficients of each constituent component.
11. The method of claim 1, said plurality of constituent components including HbO2, HbCO, Hi and Hb, said method further comprising: before said generating step, selecting four
radiation wavelengths by computing an error index for each of HbO2, HbCO and Hi as the sum of the absolute values of the errors that are induced in the measurement of relative concentrations of HbO2, HbCO and Hi due to a change in optical density measurements; and selecting a quadruple of radiation wavelengths
having minimum error indices.
12. The method of claim 11, said quadruple of radiation wavelengths each being within the range of 510 to 630 nanometers.
13. The method of claim 12 , said quadruple of radiation wavelengths comprising 522, 562, 584 and 600 nanometers.
14. The method of claim 12 , said quadruple of radiation wavelengths comprising 518, 562, 580 and 590 nanometers.
15. The method of claim 12, said quadruple of radiation wavelengths comprising 520.1, 562.4, 585.2 and 597.5 nanometers.
16. The method of claim 12, said constituent components further including bilirubin, said method further
comprising: before said generating step, selecting a radiation wavelength within the range of 475 to 500 nanometers as the radiation wavelength for the measurement of bilirubin.
17. The method of claim 16, said radiation wavelength for the measurement of bilirubin being 488.4 nanometers.
18. The method of claim 12, said constituent components further including sulfhemoglobin, said method further comprising: before said generating step, selecting a radiation wavelength within the range of 615 to 625 nanometers as the radiation wavelength for the measurement of sulfhemoglobin.
19. The method of claim 18, said radiation wavelength for the measurement of sulfhemoglobin being 621.7
nanometers.
20. The method of claim 1, further comprising: correcting said calculated concentrations of
constituent components for the effects of light scattering by red blood cells.
21. The method of claim 20, said correcting step
comprising, correcting said calculated concentrations of constituent components as a function of the relative concentrations of the constituent components.
22. The method of claim 21, said correcting step further comprising: iteratively determining a red blood cell scattering vector for the particular composition of the whole blood sample being analyzed; and using said red blood cell scattering vector to
correct said calculated constituent component concentrations.
23. The method of claim 1, further comprising: correcting said calculated constituent component
concentrations for the effects of non-specific light scattering.
24. The method of claim 23, said correcting step
comprising, correcting said calculated concentrations of constituent components as a function of the relative concentrations of the constituent components under consideration.
25. The method of claim 24, said correcting step further comprising: iteratively determining a non-specific scattering vector for the particular composition of the whole blood sample being analyzed; and using said non-specific scattering vector to correct said calculated constituent component concentrations.
26. The method of claim 1, further comprising,
correcting said calculated concentrations of constituent components for the effects of light scattering by red blood cells and for the effects of non-specific light scattering.
27. The method of claim 26, said correcting step
comprising, correcting said calculated concentrations of constituent components as a function of the relative concentrations of the constituent components under consideration.
28. The method of claim 27, said correcting step further comprising: iteratively determining a red blood cell scattering vector for the particular composition of the whole blood sample being analyzed; iteratively determining a non-specific scattering vector for the particular composition of the whole blood sample being analyzed; and using said non-specific scattering vector and said red blood cell scattering vector to correct said calculated constituent component concentrations.
29. The method of claim 28, said plurality of
constituent components including HbO2, HbCO, Hi and Hb, said method further comprising: before said generating step, selecting four
radiation wavelengths by computing an error index for each of HbO2, HbCO and Hi as the sum of the absolute values of the errors that are induced in the measurement of relative concentrations of HbO2, HbCO and Hi due to a change in optical density measurements; and selecting a quadruple of radiation wavelengths
having minimum error indices.
30. The method of claim 29, said quadruple of radiation wavelengths each being within the range of 510 to 630 nanometers.
31. The method of claim 30, said constituent components further including bilirubin, said method further
comprising: before said generating step, selecting a radiation wavelength within the range of 475 to 500 nanometers as the radiation wavelength for the measurement of bilirubin.
32. The method of claim 31, said constituent components further including sulfhemoglobin, said method further comprising: before said generating step, selecting a radiation wavelength within the range of 615 to 625 nanometers as the radiation wavelength for the measurement of sulfhemoglobin.
33. The method of claim 32, further comprising, before said generating step, selecting a radiation wavelength within the range of 635 to 645 nanometers as an
additional radiation wavelength for the measurement of sulfhemoglobin.
PCT/US1993/009154 1992-09-29 1993-09-27 Method and apparatus for direct spectrophotometric measurements in unaltered whole blood WO1994008237A1 (en)

Priority Applications (4)

Application Number Priority Date Filing Date Title
DE69328783T DE69328783T2 (en) 1992-09-29 1993-09-27 METHOD FOR DIRECT SPECTROPHOTOMETRIC MEASUREMENTS IN UNCHANGED BLOOD
AU51410/93A AU5141093A (en) 1992-09-29 1993-09-27 Method and apparatus for direct spectrophotometric measurements in unaltered whole blood
EP93922402A EP0663070B1 (en) 1992-09-29 1993-09-27 Method for direct spectrophotometric measurements in unaltered whole blood
DK93922402T DK0663070T3 (en) 1992-09-29 1993-09-27 Method for direct spectrophotometric measurements in unchanged whole blood

Applications Claiming Priority (2)

Application Number Priority Date Filing Date Title
US07/953,680 US6262798B1 (en) 1992-09-29 1992-09-29 Method and apparatus for direct spectrophotometric measurements in unaltered whole blood
US07/953,680 1992-09-29

Publications (1)

Publication Number Publication Date
WO1994008237A1 true WO1994008237A1 (en) 1994-04-14

Family

ID=25494388

Family Applications (1)

Application Number Title Priority Date Filing Date
PCT/US1993/009154 WO1994008237A1 (en) 1992-09-29 1993-09-27 Method and apparatus for direct spectrophotometric measurements in unaltered whole blood

Country Status (6)

Country Link
US (4) US6262798B1 (en)
EP (1) EP0663070B1 (en)
AU (1) AU5141093A (en)
DE (1) DE69328783T2 (en)
DK (1) DK0663070T3 (en)
WO (1) WO1994008237A1 (en)

Cited By (7)

* Cited by examiner, † Cited by third party
Publication number Priority date Publication date Assignee Title
EP0693682A2 (en) * 1994-07-18 1996-01-24 AVL Medical Instruments AG Method for determining the concentration c of an absorbent homogeneously distributed on a support
EP0720013A3 (en) * 1994-12-28 1997-09-10 Coretech Medical Technologies Spectrophotometric blood analysis
EP0800074A1 (en) * 1996-04-02 1997-10-08 AVL Medical Instruments AG Apparatus and method for determining the concentration of hemoglobin derivatives in a nondiluted and nonhemolyzed whole blood sample
US5773301A (en) * 1996-07-12 1998-06-30 Avl Medical Instruments Ag Method for optically determining total hemoglobin concentration
WO1999015880A1 (en) * 1997-09-25 1999-04-01 Bayer Corporation Spectroscopic analysis of samples with turbidity and high absorbance
US6510330B1 (en) 1998-11-30 2003-01-21 Gambro Ab Method and device for measuring blood parameters
US6943883B2 (en) 2000-01-18 2005-09-13 Radiometer Medical A/S Apparatus, sample cuvette and method for optical measurements

Families Citing this family (121)

* Cited by examiner, † Cited by third party
Publication number Priority date Publication date Assignee Title
US6262798B1 (en) * 1992-09-29 2001-07-17 Board Of Regents, The University Of Texas System Method and apparatus for direct spectrophotometric measurements in unaltered whole blood
EP1086366B1 (en) * 1998-06-12 2010-04-14 Radiometer Medical ApS A method in quality control of a spectrophotometer
US6284142B1 (en) * 1999-09-03 2001-09-04 Baxter International Inc. Sensing systems and methods for differentiating between different cellular blood species during extracorporeal blood separation or processing
US20030027347A1 (en) * 2001-05-25 2003-02-06 Phyllis Shapiro Automated method for correcting blood analysis parameter results affected by interference from exogenous blood substitutes in whole blood, plasma, and serum
FR2829286B1 (en) * 2001-09-03 2008-04-04 Ge Med Sys Global Tech Co Llc DEVICE AND METHOD FOR TRANSMITTING X-RAYS
US7050157B2 (en) 2001-11-08 2006-05-23 Optiscan Biomedical Corp. Reagent-less whole-blood glucose meter
US6989891B2 (en) 2001-11-08 2006-01-24 Optiscan Biomedical Corporation Device and method for in vitro determination of analyte concentrations within body fluids
US7061593B2 (en) 2001-11-08 2006-06-13 Optiscan Biomedical Corp. Device and method for in vitro determination of analyte concentrations within body fluids
US6958809B2 (en) 2001-11-08 2005-10-25 Optiscan Biomedical Corporation Reagent-less whole-blood glucose meter
WO2003045234A2 (en) * 2001-11-21 2003-06-05 Optiscan Biomedical Corporation Method and apparatus for adjusting signal variation of an electronically controlled infrared transmissive window
US7009180B2 (en) * 2001-12-14 2006-03-07 Optiscan Biomedical Corp. Pathlength-independent methods for optically determining material composition
US6862534B2 (en) * 2001-12-14 2005-03-01 Optiscan Biomedical Corporation Method of determining an analyte concentration in a sample from an absorption spectrum
SE0104443D0 (en) * 2001-12-28 2001-12-28 Hemocue Ab Analysis method and cuvette for that
US7002670B2 (en) * 2002-06-12 2006-02-21 Baxter International Inc. Optical sensor and method for measuring concentration of a chemical constituent using its intrinsic optical absorbance
US20040132168A1 (en) * 2003-01-06 2004-07-08 Peter Rule Sample element for reagentless whole blood glucose meter
EP1618389A1 (en) * 2003-04-15 2006-01-25 Optiscan Biomedical Corporation Sample element qualification
US7271912B2 (en) * 2003-04-15 2007-09-18 Optiscan Biomedical Corporation Method of determining analyte concentration in a sample using infrared transmission data
AU2004229538A1 (en) * 2003-04-15 2004-10-28 Optiscan Biomedical Corporation Dual measurement analyte detection system
US9176121B2 (en) * 2004-02-13 2015-11-03 Roche Diagnostics Hematology, Inc. Identification of blood elements using inverted microscopy
CA2460898A1 (en) * 2004-03-09 2005-09-09 James Samsoondar Apparatus and method for combining in vivo and in vitro testing
WO2006040387A1 (en) * 2004-10-11 2006-04-20 Thermo Fisher Scientific Oy Method for automatically detecting factors that disturb analysis by a photometer
EP1805499A4 (en) * 2004-10-21 2010-07-21 Optiscan Biomedical Corp Method and apparatus for determining an analyte concentration in a sample having interferent
US8936755B2 (en) 2005-03-02 2015-01-20 Optiscan Biomedical Corporation Bodily fluid composition analyzer with disposable cassette
US8251907B2 (en) 2005-02-14 2012-08-28 Optiscan Biomedical Corporation System and method for determining a treatment dose for a patient
US20060200070A1 (en) * 2005-02-14 2006-09-07 Callicoat David N Method and apparatus for calibrating an analyte detection system with a calibration sample
US20060189926A1 (en) * 2005-02-14 2006-08-24 Hall W D Apparatus and methods for analyzing body fluid samples
US7860542B2 (en) * 2005-02-14 2010-12-28 Optiscan Biomedical Corporation Analyte detection system with reduced sample volume
US7785258B2 (en) * 2005-10-06 2010-08-31 Optiscan Biomedical Corporation System and method for determining a treatment dose for a patient
US8425444B2 (en) * 2006-04-11 2013-04-23 Optiscan Biomedical Corporation Anti-clotting apparatus and methods for fluid handling system
US7364562B2 (en) * 2005-10-06 2008-04-29 Optiscan Biomedical Corp. Anti-clotting apparatus and methods for fluid handling system
US20060194325A1 (en) * 2005-02-14 2006-08-31 Gable Jennifer H Fluid handling cassette with a fluid control interface
SE530896C2 (en) * 2005-04-01 2008-10-14 Diaspect Medical Ab Device for determining a blood hemoglobin concentration
US20100245803A1 (en) * 2005-04-12 2010-09-30 Chromedx Inc. Blood sample holder for spectroscopic analysis
CA2517299A1 (en) * 2005-08-26 2007-02-26 Chromedx Inc. Hollow needle assembly
US7740804B2 (en) * 2005-04-12 2010-06-22 Chromedx Inc. Spectroscopic sample holder
US8206650B2 (en) * 2005-04-12 2012-06-26 Chromedx Inc. Joint-diagnostic spectroscopic and biosensor meter
US20060228258A1 (en) * 2005-04-12 2006-10-12 Chromedx Inc. Blood collection and measurement apparatus
CA2507323A1 (en) * 2005-05-13 2006-11-13 Chromedx Inc. Diagnostic whole blood and plasma apparatus
US20060233667A1 (en) * 2005-04-19 2006-10-19 Chromedx Inc. Joint-diagnostic spectroscopic and biosensor apparatus
US9561001B2 (en) 2005-10-06 2017-02-07 Optiscan Biomedical Corporation Fluid handling cassette system for body fluid analyzer
US20080161723A1 (en) * 2006-09-06 2008-07-03 Optiscan Biomedical Corporation Infusion flow interruption method and apparatus
US20070179436A1 (en) * 2005-12-21 2007-08-02 Braig James R Analyte detection system with periodic sample draw and laboratory-grade analyzer
EP2645086A3 (en) * 2006-03-16 2014-03-12 Sysmex Corporation Sample analyzer
SE530244C2 (en) * 2006-05-05 2008-04-08 Hemocue Ab Method and system for quantitative hemoglobin determination
EP1987762A1 (en) * 2007-05-03 2008-11-05 F.Hoffmann-La Roche Ag Oximeter
US20090160656A1 (en) * 2007-10-11 2009-06-25 Mahesh Seetharaman Analyte monitoring system alarms
US8412293B2 (en) * 2007-07-16 2013-04-02 Optiscan Biomedical Corporation Systems and methods for determining physiological parameters using measured analyte values
US20100145175A1 (en) * 2008-08-22 2010-06-10 Soldo Monnett H Systems and methods for verification of sample integrity
US8597190B2 (en) 2007-05-18 2013-12-03 Optiscan Biomedical Corporation Monitoring systems and methods with fast initialization
WO2008144575A2 (en) * 2007-05-18 2008-11-27 Optiscan Biomedical Corporation Fluid injection and safety system
US8417311B2 (en) 2008-09-12 2013-04-09 Optiscan Biomedical Corporation Fluid component analysis system and method for glucose monitoring and control
US7972296B2 (en) * 2007-10-10 2011-07-05 Optiscan Biomedical Corporation Fluid component analysis system and method for glucose monitoring and control
KR100885123B1 (en) 2007-08-31 2009-02-20 김세헌 Portable bilirubin analyzer
WO2009048977A1 (en) * 2007-10-08 2009-04-16 Optiscan Biomedical Corporation Low draw volume analyte detection systems
CA2702113A1 (en) * 2007-10-11 2009-04-16 Optiscan Biomedical Corporation Synchronization and configuration of patient monitoring devices
US7959598B2 (en) 2008-08-20 2011-06-14 Asante Solutions, Inc. Infusion pump systems and methods
US20100198037A1 (en) * 2009-01-30 2010-08-05 Cole Steven W Feedback sensor for real-time management of sickle cell disease
US8970820B2 (en) 2009-05-20 2015-03-03 Nikon Corporation Object exchange method, exposure method, carrier system, exposure apparatus, and device manufacturing method
EP2456355B1 (en) 2009-07-20 2016-09-14 Optiscan Biomedical Corporation Adjustable connector and dead space reduction
US8731639B2 (en) 2009-07-20 2014-05-20 Optiscan Biomedical Corporation Adjustable connector, improved fluid flow and reduced clotting risk
US9554742B2 (en) 2009-07-20 2017-01-31 Optiscan Biomedical Corporation Fluid analysis system
US10475529B2 (en) 2011-07-19 2019-11-12 Optiscan Biomedical Corporation Method and apparatus for analyte measurements using calibration sets
US8521244B2 (en) * 2009-09-16 2013-08-27 Analogic Corporation Physiological parameter monitoring apparatus
ES2369686B1 (en) * 2009-11-16 2012-12-04 Alejandro Cáceres Gálvez Portable equipment for measuring the concentration of hemoglobin derivatives in arterial blood in a non-destructive manner and use procedure
WO2011156522A1 (en) 2010-06-09 2011-12-15 Optiscan Biomedical Corporation Measuring analytes in a fluid sample drawn from a patient
US8489164B2 (en) * 2010-10-27 2013-07-16 Medtronic, Inc. Monitoring of tissue hemoglobin concentration
US9522396B2 (en) 2010-12-29 2016-12-20 S.D. Sight Diagnostics Ltd. Apparatus and method for automatic detection of pathogens
EP2729784A4 (en) 2011-07-06 2015-05-13 Optiscan Biomedical Corp Sample cell for fluid analysis system
CN103917870B (en) 2011-11-16 2016-04-13 贝克顿·迪金森公司 For detecting the method and system of the analysis thing in sample
CN106840812B (en) 2011-12-29 2019-12-17 思迪赛特诊断有限公司 Methods and systems for detecting pathogens in biological samples
KR101608684B1 (en) 2012-04-13 2016-04-05 바디텍메드(주) Device and method for measuring hemoglobin level from whole blood
JP5961482B2 (en) * 2012-08-20 2016-08-02 株式会社日立ハイテクノロジーズ Spectrophotometer
TW201410869A (en) * 2012-09-10 2014-03-16 Maestrogen Inc Protein detection device
CN104755925B (en) 2013-01-11 2017-06-23 贝克顿·迪金森公司 The point-of-care of low cost determines device
CN109342282A (en) * 2013-05-09 2019-02-15 艾博特健康公司 The method and apparatus for determining the parameter in uncracked blood sample based on hemoglobin
WO2014188405A1 (en) 2013-05-23 2014-11-27 Parasight Ltd. Method and system for imaging a cell sample
IL227276A0 (en) 2013-07-01 2014-03-06 Parasight Ltd A method and system for preparing a monolayer of cells, particularly suitable for diagnosis
EP3039477B1 (en) 2013-08-26 2021-10-20 S.D. Sight Diagnostics Ltd. Digital microscopy systems, methods and computer program products
CN113477149B (en) 2013-11-06 2023-09-12 贝克顿·迪金森公司 Microfluidic devices and methods of making and using the same
US10018640B2 (en) 2013-11-13 2018-07-10 Becton, Dickinson And Company Optical imaging system and methods for using the same
WO2015095239A1 (en) 2013-12-18 2015-06-25 Optiscan Biomedical Corporation Systems and methods for detecting leaks
GB2523989B (en) 2014-01-30 2020-07-29 Insulet Netherlands B V Therapeutic product delivery system and method of pairing
KR20170010361A (en) 2014-05-31 2017-01-31 크로메드엑스 코포레이션 Joint spectroscopic and biosensor system for point-of-care testing
US10482595B2 (en) 2014-08-27 2019-11-19 S.D. Sight Diagnostics Ltd. System and method for calculating focus variation for a digital microscope
EP3094252B1 (en) 2014-10-14 2021-08-25 Becton, Dickinson and Company Blood sample management using open cell foam
EP4261523A3 (en) 2014-10-14 2023-12-06 Becton, Dickinson and Company Blood sample management using open cell foam
US9833557B2 (en) 2014-12-19 2017-12-05 Fenwal, Inc. Systems and methods for determining free plasma hemoglobin
WO2016134137A1 (en) 2015-02-18 2016-08-25 Insulet Corporation Fluid delivery and infusion devices, and methods of use thereof
JP6426832B2 (en) 2015-03-10 2018-11-21 ベクトン・ディキンソン・アンド・カンパニーBecton, Dickinson And Company Microsample management system for biological fluid
WO2017040650A1 (en) 2015-09-01 2017-03-09 Becton, Dickinson And Company Depth filtration device for separating specimen phases
JP6952683B2 (en) 2015-09-17 2021-10-20 エス.ディー.サイト ダイアグノスティクス リミテッド Methods and devices for detecting entities in body samples
TWI584786B (en) 2015-10-01 2017-06-01 緯創資通股份有限公司 Method for sensing physiological feature
WO2017123525A1 (en) 2016-01-13 2017-07-20 Bigfoot Biomedical, Inc. User interface for diabetes management system
CA3009351A1 (en) 2016-01-14 2017-07-20 Bigfoot Biomedical, Inc. Adjusting insulin delivery rates
US11733150B2 (en) 2016-03-30 2023-08-22 S.D. Sight Diagnostics Ltd. Distinguishing between blood sample components
US9976946B2 (en) 2016-04-21 2018-05-22 Instrumentation Laboratory Company Optical flow cell and test head apparatus
US10288556B2 (en) 2016-04-21 2019-05-14 Instrumentation Laboratory Company Optical flow cell apparatus and method for reducing deflection of sample chamber
EP3455607B1 (en) 2016-05-11 2022-07-20 Nova Biomedical Corporation Whole blood so2 sensor
WO2017195205A1 (en) 2016-05-11 2017-11-16 S.D. Sight Diagnostics Ltd Sample carrier for optical measurements
AU2017263807B2 (en) 2016-05-11 2023-02-02 S.D. Sight Diagnostics Ltd Performing optical measurements on a sample
CA3031081C (en) 2016-07-18 2021-08-31 Siemens Healthcare Diagnostics Inc. System and method for optical whole blood hemolysis detection
US10765807B2 (en) 2016-09-23 2020-09-08 Insulet Corporation Fluid delivery device with sensor
US11921272B2 (en) 2017-11-14 2024-03-05 S.D. Sight Diagnostics Ltd. Sample carrier for optical measurements
USD928199S1 (en) 2018-04-02 2021-08-17 Bigfoot Biomedical, Inc. Medication delivery device with icons
CN112236826A (en) 2018-05-04 2021-01-15 英赛罗公司 Safety constraints for drug delivery systems based on control algorithms
US11628251B2 (en) 2018-09-28 2023-04-18 Insulet Corporation Activity mode for artificial pancreas system
WO2020077223A1 (en) 2018-10-11 2020-04-16 Insulet Corporation Event detection for drug delivery system
US10883927B2 (en) * 2019-06-05 2021-01-05 Taiwan Redeye Biomedical Inc. Hemoglobin detecting device
US11801344B2 (en) 2019-09-13 2023-10-31 Insulet Corporation Blood glucose rate of change modulation of meal and correction insulin bolus quantity
US11935637B2 (en) 2019-09-27 2024-03-19 Insulet Corporation Onboarding and total daily insulin adaptivity
US11833329B2 (en) 2019-12-20 2023-12-05 Insulet Corporation Techniques for improved automatic drug delivery performance using delivery tendencies from past delivery history and use patterns
US11551802B2 (en) 2020-02-11 2023-01-10 Insulet Corporation Early meal detection and calorie intake detection
US11547800B2 (en) 2020-02-12 2023-01-10 Insulet Corporation User parameter dependent cost function for personalized reduction of hypoglycemia and/or hyperglycemia in a closed loop artificial pancreas system
US11324889B2 (en) 2020-02-14 2022-05-10 Insulet Corporation Compensation for missing readings from a glucose monitor in an automated insulin delivery system
DE102020104266B3 (en) * 2020-02-18 2021-04-22 Technische Hochschule Lübeck Device and method for analyzing blood
US11607493B2 (en) 2020-04-06 2023-03-21 Insulet Corporation Initial total daily insulin setting for user onboarding
US11684716B2 (en) 2020-07-31 2023-06-27 Insulet Corporation Techniques to reduce risk of occlusions in drug delivery systems
US11904140B2 (en) 2021-03-10 2024-02-20 Insulet Corporation Adaptable asymmetric medicament cost component in a control system for medicament delivery
DE102021116189A1 (en) 2021-06-23 2022-12-29 Benjamin Kern Spectroscopy device and method for determining blood parameters
US11738144B2 (en) 2021-09-27 2023-08-29 Insulet Corporation Techniques enabling adaptation of parameters in aid systems by user input
US11439754B1 (en) 2021-12-01 2022-09-13 Insulet Corporation Optimizing embedded formulations for drug delivery

Family Cites Families (33)

* Cited by examiner, † Cited by third party
Publication number Priority date Publication date Assignee Title
US2878715A (en) 1956-02-06 1959-03-24 Mark C Rhees Method of blood plasma prothrombin time determinations
US3296922A (en) 1963-04-22 1967-01-10 American Optical Corp Apparatus for determining oxygen saturation of blood
US3516746A (en) 1965-01-28 1970-06-23 Shimadzu Corp Cross slide spectrophotometer with a diffusing element between sample cell and photoelectric tube
US3527542A (en) 1966-06-15 1970-09-08 Beckman Instruments Inc Cardiac output apparatus
US3638640A (en) 1967-11-01 1972-02-01 Robert F Shaw Oximeter and method for in vivo determination of oxygen saturation in blood using three or more different wavelengths
US3649204A (en) 1968-09-18 1972-03-14 Farr Devices Inc Metering pump for analytical samples
HU164637B (en) 1970-02-02 1974-03-28
US3799672A (en) 1972-09-15 1974-03-26 Us Health Education & Welfare Oximeter for monitoring oxygen saturation in blood
GB1486505A (en) 1974-06-04 1977-09-21 Compur Werk Gmbh & Co Handheld photoelectric appliance for testing liquids
US3972614A (en) 1974-07-10 1976-08-03 Radiometer A/S Method and apparatus for measuring one or more constituents of a blood sample
IT1019866B (en) 1974-08-09 1977-11-30 Biomedix Ag EQUIPMENT FOR THE DETERMINATION OF THE CONCENTRATION OF HEMOGLOBES NA TOTAL OXYGEN AND RISOTTA CAR BOSSIHEMOGLOBIN OF THE CAPACITY OF THE HEMOGLOBIN FOR THE OXYGEN OF THE SATURATION PER CENTUAL IN OXYGEN AND IN OXIDE OF CARBON IN SOLOIL OR BLOOD
US3922598A (en) 1974-08-15 1975-11-25 Robert R Steuer Hematocrit measurements by electrical conductivity
CH581836A5 (en) 1974-08-20 1976-11-15 Contraves Ag
US4057394A (en) 1976-05-24 1977-11-08 Miles Laboratories, Inc. Test device and method for determining blood hemoglobin
DK146287C (en) 1976-10-18 1984-01-30 Radiometer As PROCEDURE FOR DEOXYGENATION OF A BLOOD SAMPLING MATERIAL AND CAPILLAR BEARS USED BY THE PROCEDURE
US4134678A (en) 1977-03-16 1979-01-16 Instrumentation Laboratory Inc. Automatic blood analysis apparatus and method
AT374008B (en) 1977-10-25 1984-03-12 Compur Electronic Gmbh CUEVETTE
US4243883A (en) 1979-01-19 1981-01-06 Midwest Cardiovascular Institute Foundation Blood hematocrit monitoring system
US4301412A (en) 1979-10-29 1981-11-17 United States Surgical Corporation Liquid conductivity measuring system and sample cards therefor
US4303887A (en) 1979-10-29 1981-12-01 United States Surgical Corporation Electrical liquid conductivity measuring system
US4502786A (en) 1979-12-26 1985-03-05 Helena Laboratories Corporation Method and apparatus for automated determination of hemoglobin species
US4324556A (en) 1980-03-25 1982-04-13 The United States Of America As Represented By The Secretary Of The Navy Portable COHB analyzer
US4453266A (en) 1980-04-21 1984-06-05 Rush-Presbyterian-St. Luke's Medical Center Method and apparatus for measuring mean cell volume of red blood cells
US4357105A (en) 1980-08-06 1982-11-02 Buffalo Medical Specialties Mfg., Inc. Blood diagnostic spectrophotometer
US4444498A (en) 1981-02-27 1984-04-24 Bentley Laboratories Apparatus and method for measuring blood oxygen saturation
FR2530029A1 (en) 1982-07-06 1984-01-13 Centre Nat Rech Scient IMPROVED LASER NEPHELOMETER FOR DETECTION OF ANTIGENS AND ANTIBODIES
US4700708A (en) 1982-09-02 1987-10-20 Nellcor Incorporated Calibrated optical oximeter probe
US4565448A (en) 1983-03-11 1986-01-21 E. I. Du Pont De Nemours And Company Particle counting apparatus
US4651741A (en) 1985-05-30 1987-03-24 Baxter Travenol Laboratories, Inc. Method and apparatus for determining oxygen saturation in vivo
DK282085D0 (en) 1985-06-21 1985-06-21 Radiometer As METHOD AND APPARATUS FOR DETERMINING BLOOD COMPONENTS
US4805623A (en) * 1987-09-04 1989-02-21 Vander Corporation Spectrophotometric method for quantitatively determining the concentration of a dilute component in a light- or other radiation-scattering environment
US6262798B1 (en) * 1992-09-29 2001-07-17 Board Of Regents, The University Of Texas System Method and apparatus for direct spectrophotometric measurements in unaltered whole blood
US5064282A (en) * 1989-09-26 1991-11-12 Artel, Inc. Photometric apparatus and method for measuring hemoglobin

Non-Patent Citations (2)

* Cited by examiner, † Cited by third party
Title
Phys. Med. Bio., Vol. 12, No. 2, 1967, ANDERSON et al., "Light Absorbing and Scattering Properties of Non-Haemolysed Blood", pages 173-184; see entire document. *
See also references of EP0663070A4 *

Cited By (11)

* Cited by examiner, † Cited by third party
Publication number Priority date Publication date Assignee Title
EP0693682A2 (en) * 1994-07-18 1996-01-24 AVL Medical Instruments AG Method for determining the concentration c of an absorbent homogeneously distributed on a support
EP0693682A3 (en) * 1994-07-18 1996-10-30 Avl Medical Instr Ag Method for determining the concentration c of an absorbent homogeneously distributed on a support
EP0720013A3 (en) * 1994-12-28 1997-09-10 Coretech Medical Technologies Spectrophotometric blood analysis
EP0800074A1 (en) * 1996-04-02 1997-10-08 AVL Medical Instruments AG Apparatus and method for determining the concentration of hemoglobin derivatives in a nondiluted and nonhemolyzed whole blood sample
AT403412B (en) * 1996-04-02 1998-02-25 Avl Verbrennungskraft Messtech DEVICE AND METHOD FOR DETERMINING THE CONCENTRATION OF HEMOGLOBIN DERIVATIVES IN AN UNDILINED, UNHEMOLYZED WHOLE BLOOD SAMPLE
US5773301A (en) * 1996-07-12 1998-06-30 Avl Medical Instruments Ag Method for optically determining total hemoglobin concentration
WO1999015880A1 (en) * 1997-09-25 1999-04-01 Bayer Corporation Spectroscopic analysis of samples with turbidity and high absorbance
US6172744B1 (en) 1997-09-25 2001-01-09 Bayer Corporation Method and apparatus for performing spectroscopic analysis with applicability to samples with turbidity and absorption
US6219132B1 (en) 1997-09-25 2001-04-17 Bayer Corporation Method and apparatus for performing spectroscopic analysis with applicability to samples with turbidity and absorption
US6510330B1 (en) 1998-11-30 2003-01-21 Gambro Ab Method and device for measuring blood parameters
US6943883B2 (en) 2000-01-18 2005-09-13 Radiometer Medical A/S Apparatus, sample cuvette and method for optical measurements

Also Published As

Publication number Publication date
US20030202170A1 (en) 2003-10-30
US20060203225A1 (en) 2006-09-14
US6262798B1 (en) 2001-07-17
EP0663070A1 (en) 1995-07-19
US6519025B2 (en) 2003-02-11
US20020041371A1 (en) 2002-04-11
US7075628B2 (en) 2006-07-11
AU5141093A (en) 1994-04-26
DE69328783D1 (en) 2000-07-06
DE69328783T2 (en) 2000-09-21
DK0663070T3 (en) 2000-10-02
EP0663070A4 (en) 1995-08-30
EP0663070B1 (en) 2000-05-31

Similar Documents

Publication Publication Date Title
US6519025B2 (en) Method and apparatus for direct spectrophotometric measurements in unaltered whole blood
EP0419223B1 (en) Characterizing biological matter in a dynamic condition using near infrared spectroscopy
EP2016390B1 (en) A method and a system for quantitative hemoglobin determination
CA2468513C (en) Analysis method and system therefor
US5706208A (en) Method for the prediction of properties of biological matter by analysis of the near-infrared spectrum thereof
Zwart et al. Multicomponent analysis of hemoglobin derivatives with reversed-optics spectrophotometer.
CA2025329C (en) Characterizing matter of biological origin using near infrared spectroscopy
Polanyi et al. New reflection oximeter
Cookson et al. A simple spectrophotometric method for the quantification of residual haemoglobin in platelet concentrates
US20050037505A1 (en) Spectroscopic method and apparatus for analyte measurement
US7449339B2 (en) Spectroscopic method and apparatus for total hemoglobin measurement
Lin et al. Detection of free hemoglobin in blood products using transmission spectra and fluorescence spectra for quality assurance
US6623972B2 (en) Automated method for detecting, quantifying and monitoring exogenous hemoglobin in whole blood, plasma and serum
US6995835B2 (en) Method and apparatus for measuring analytes in blood bags
Anderson et al. Studies on the light transmission of nonhemolyzed whole blood. Determination of oxygen saturation
JP2005274568A (en) Spectroscopic method and apparatus for total hemoglobin measurement
US5939327A (en) Measurement of bile pigments in serum or plasma
US20050134833A1 (en) Method and apparatus for measuring cell-by-cell hemoglobin
Can et al. Modeling diffuse reflectance spectra of donated blood with their hematological parameters
US20240060957A1 (en) Point-of-care testing system, analyzer and method
RU2140083C1 (en) Method of determination of content of main derivatives of hemoglobin
Hallemann et al. Technical aspects of bilirubin determination in whole blood
Mullins et al. Effects of Fluosol-DA (artificial blood) on clinical chemistry tests and instruments

Legal Events

Date Code Title Description
AK Designated states

Kind code of ref document: A1

Designated state(s): AT AU BB BG BR BY CA CH CZ DE DK ES FI GB HU JP KP KR KZ LK LU LV MG MN MW NL NO NZ PL PT RO RU SD SE SK UA VN

AL Designated countries for regional patents

Kind code of ref document: A1

Designated state(s): AT BE CH DE DK ES FR GB GR IE IT LU MC NL PT SE BF BJ CF CG CI CM GA GN ML MR NE SN TD TG

DFPE Request for preliminary examination filed prior to expiration of 19th month from priority date (pct application filed before 20040101)
121 Ep: the epo has been informed by wipo that ep was designated in this application
WWE Wipo information: entry into national phase

Ref document number: 1993922402

Country of ref document: EP

WWP Wipo information: published in national office

Ref document number: 1993922402

Country of ref document: EP

REG Reference to national code

Ref country code: DE

Ref legal event code: 8642

NENP Non-entry into the national phase

Ref country code: CA

WWG Wipo information: grant in national office

Ref document number: 1993922402

Country of ref document: EP